Agentic AIOps Guide
Traditional IT ops can’t keep up with today’s complexity. Agentic AIOps is the future. This guide is your go-to resource—from basics to advanced strategies—for using AI to boost…
Forrester Total Economic Impact™ study finds Edwin AI delivered a 313% ROI for composite organization.
Proactively manage modern hybrid environments with predictive insights, intelligent automation, and full-stack observability.
Explore solutionsExplore our resource library for IT pros. Get expert guides, observability strategies, and real-world insights to power smarter, AI-driven operations.
Explore resources
Our observability platform proactively delivers the insights and automation CIOs need to accelerate innovation.
About LogicMonitor
Traditional IT ops can’t keep up with today’s complexity. Agentic AIOps is the future. This guide is your go-to resource—from basics to advanced strategies—for using AI to boost…
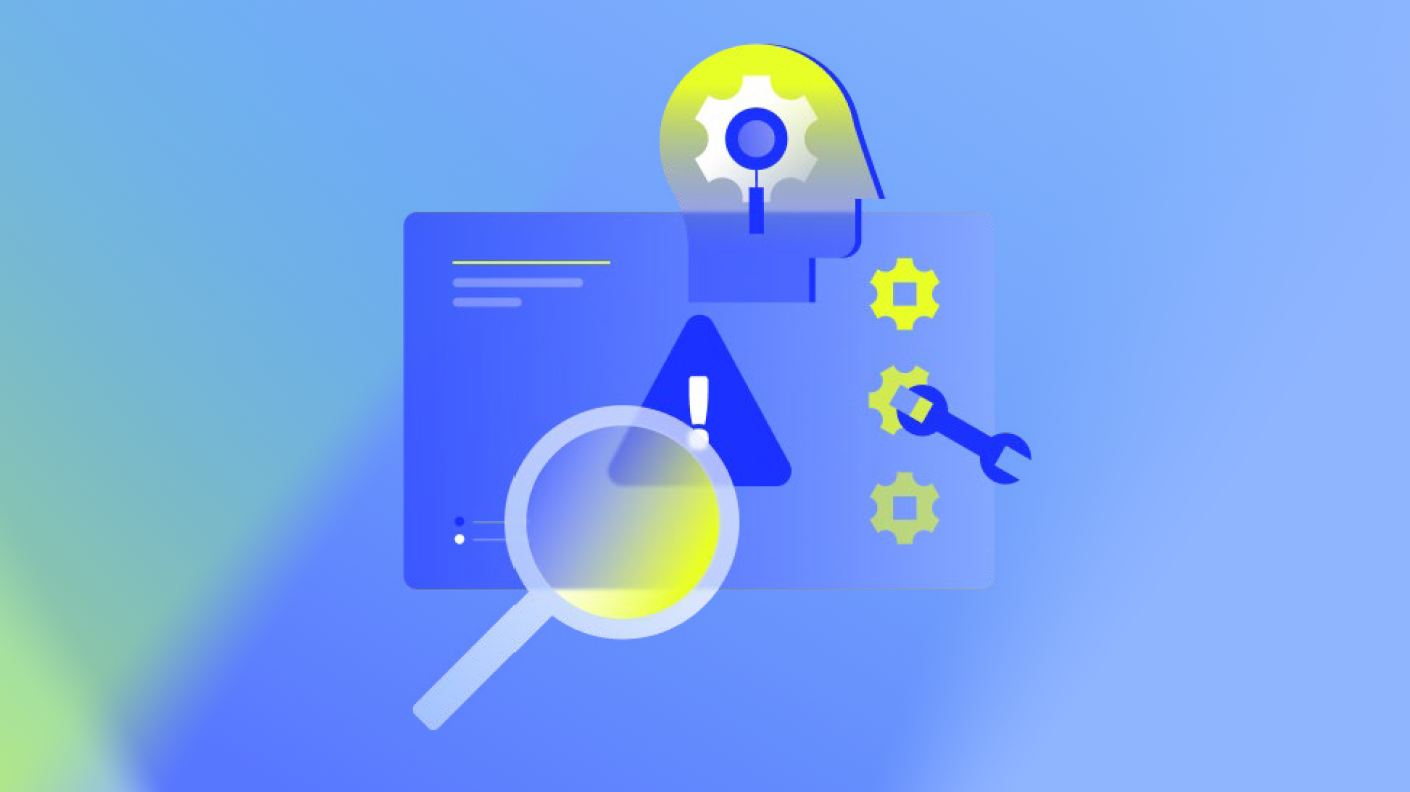
Across nine comprehensive chapters, this guide takes you through the complete spectrum of monitoring your network—from essential fundamentals to sophisticated techniques. Whether you’re just getting started or looking…
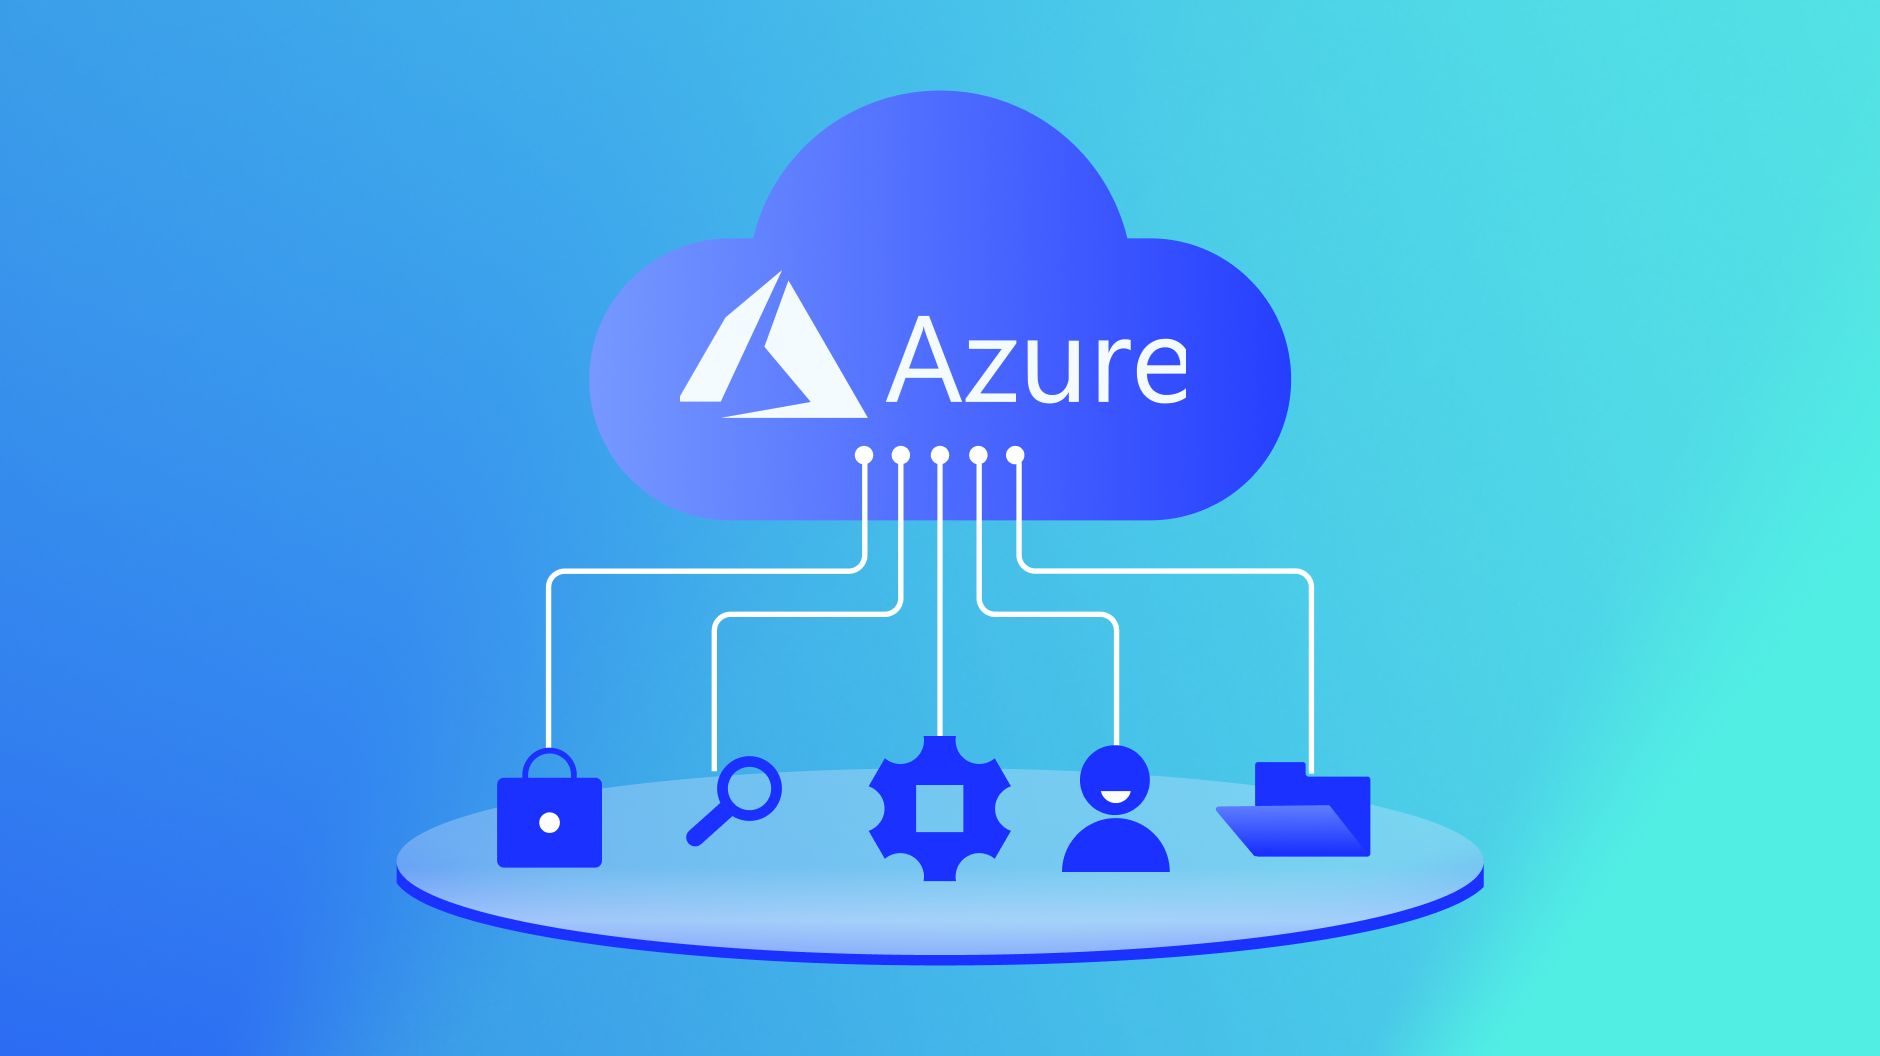
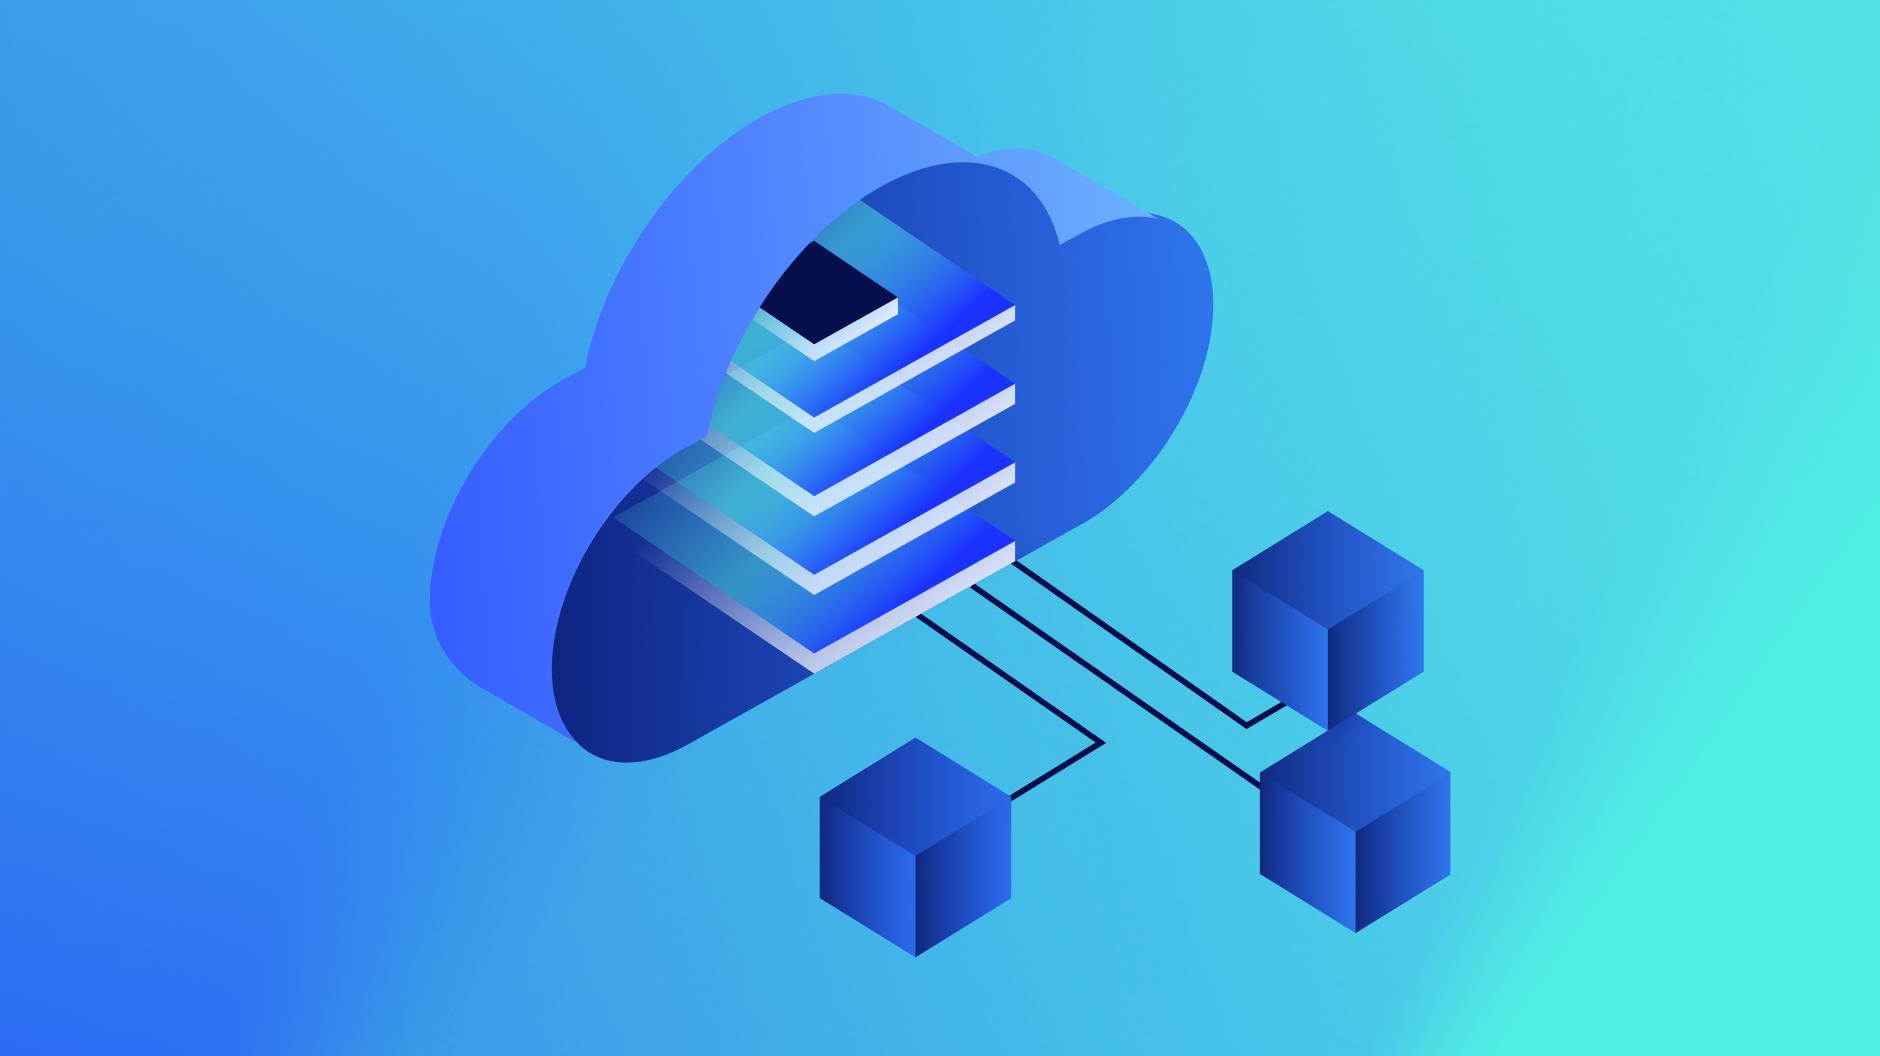
Most Azure monitoring tools leave you chasing symptoms—latency here, a cost spike there—without the full picture. This series gives you practical guidance to rebuild your monitoring strategy around…
Understand what it takes to monitor APIs across modern architectures, from availability, latency, throughput, and error rates to performance testing, microservices, REST, GraphQL, gRPC, and WebSocket APIs.
Learn the network concepts, tools, and troubleshooting techniques that keep modern infrastructure reliable, from SD-WAN and MPLS to DNS security, VLAN routing, traceroute, switching loops, IP transit, and…
Understand how BGP keeps internet traffic moving, and what network teams need to monitor to detect route leaks, hijacks, peer instability, path changes, resets, and policy misconfigurations before…

We’ll send you real talk, smart tips, and proven ways to make faster decisions and better calls right to your inbox.
Your video will begin shortly
