LogicMonitor vs. Datadog: Which Observability Platform is Best?

LogicMonitor’s unified observability platform is built for complexity and scale while Datadog’s tools are limited.

Compare the Top Observability Solutions

See how LogicMonitor’s observability suite stacks up in this comprehensive report by G2, the world’s largest B2B software review platform.

View Report
2022 G2 Observability Solution Suite Report cover

2022 Gartner® Hype Cycle™

Gartner® outlines new and emerging monitoring trends in their 2022 “Hype Cycle™ for Monitoring, Observability and Cloud Operations” analyst report.

Read the guide
Gartner® Hype Cycle™, 2022

LM Envision Solution Brief

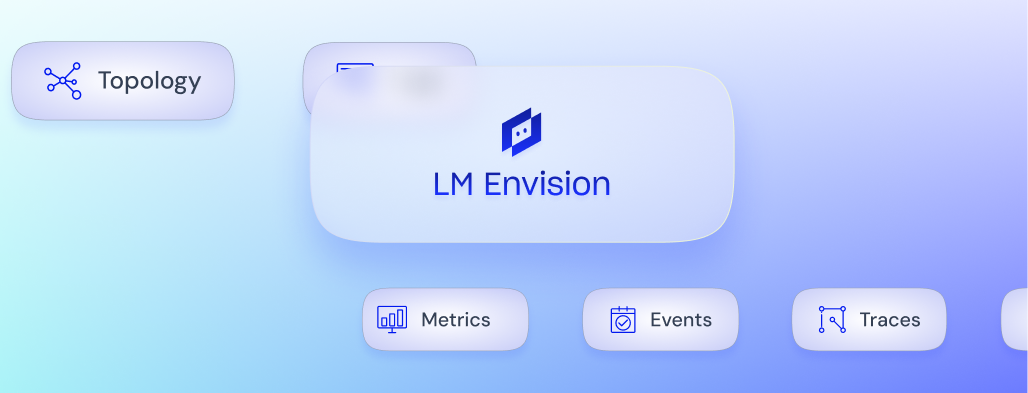
LM Envision, a unified observability platform, brings together comprehensive monitoring capabilities and enables observability across data centers, public/private clouds, and applications. LM Envision provides correlation, context and clarity to understand the business impact and causes of complex IT incidents. Read the solution brief to learn more!

View the brief
LM Envision solution brief

On-demand webinar: How to eliminate tool sprawl without causing a rebellion

Check out this webinar to learn about the causes of tool sprawl, why Ops teams struggle with it, and how to solve these challenges within your organization.

Watch the webinar
Card image for webinar

Our customers say it best

Simple Effective Event Log and Resource Monitoring/Alerting tool

LogicMonitor is used by our organization to actively monitor servers and cloud infrastructure for both events and resource utilization. Our main objective is to use the tool to detect and alert IT staff of anomalies or other potential downtime that could impact our customers and employees. LogicMonitor is currently deployed to key infrastructures such as VM hosts, domain controllers, critical servers, and Azure resources such as VMs, Frontdoor, Kubernetes, etc.

Nov 21, 2022

Aaron Nielson

Security Systems Architect

NSP

LogicMonitor has been a homerun!

LogicMonitor is great for organizations needing to get better visibility into their IT Operations and those needing to reduce workloads so that their IT teams can focus on more strategic projects.

Jul 01, 2022

Zachary Brand

Senior Director of Connected Solutions Delivery

Virteva

LogicMonitor: Highly Recommended

LogicMonitor replaced the others because it provides better value for us: it is more effective, reliable and efficient at delivering functionality.

Jun 28, 2022

Michael Dieter

Senior Systems Engineer

Loyola University Maryland

LogicMonitor vs. the competition

LogicMonitor

Legacy vendors

e.g. SolarWinds, CA Broadcom

Point solution
vendors

e.g. Nagios, ScienceLogic

Cloud-focused
vendors

e.g. Datadog, Splunk

  • Application microservices
  • Log analysis
  • Cloud infrastructure & Saas applications
  • Container & pods
  • Single set of APIs
  • Single role-based access control
  • Single data platform and visualization
Complete
Quarter
Three quarters
Half
  • Network devices
  • On-premise servers
  • Storage
  • Virtual machines
Complete
Three quarters
Half
Quarter
  • Automated onboarding
  • Prebuilt integrations
  • API-based data collection
  • Customizable dashboards
Complete
Quarter
Three quarters
Three quarters
  • Data discovery and analysis
  • Open collection
  • Data de-silozation
  • Data management
Complete
Quarter
Half
Three quarters
  • Cloud provider health
  • Resource and performance inventory
  • Spend data monitoring
  • Cost monitoring and chargebacks
  • ROI Analysis
Complete
Quarter
Half
Three quarters
  • ML-based anomaly detection
  • Intelligent alerting
  • Guided troubleshooting
  • Context-based view
Complete
Half
Quarter
  • Automated key processes
  • Remaining secure
  • Delivering responsive support
Complete
Quarter
Quarter
Half

LogicMonitor’s unified observability platform is a better Datadog alternative

Reduce tool sprawl and unify teams with contextual insights that span infrastructure, applications, and logs in a single platform. LogicMonitor’s AI-based platform goes beyond data to give you actionable insights for your entire tech stack.

  • 100% built on OpenTelemetry and OpenMetrics allowing for a vendor neutral approach to better understand the user experience and accelerate business transformation.
  • Log intelligence at scale – instant access to contextualized and correlated logs and metrics in a single, unified cloud-based platform. With tiered retention options, including unlimited retention, and hot storage to optimize data hygiene and internal compliance initiatives.
  • Never miss an application error, improve code quality, and diagnose and fix issues faster. Gain insight into the performance of the entire app stack, from code to cloud, to ensure a flawless customer experience in agile environments.

AI assistance at scale

LogicMonitor allows enterprises to rise above the limitations of legacy monitoring tools. Our AIOps platform is a future-proof solution that scales with our customers’ expectations – providing these AI-based features to help streamline troubleshooting and proactively prevent issues:

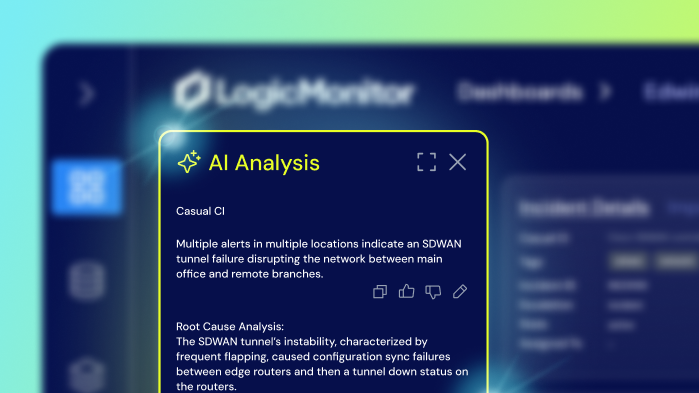
  • Automatically surface anomalies and get precise root cause analysis for service-impacting issues.
  • Ensure your teams only receive alerts for the issues that matter with dynamic thresholds tuned to your environment.
  • Predict future trends and plan utilization with advanced forecasting.
  • Visualize dependencies with dynamic topology mapping.
2023 LogicMonitor badges

Customer-first approach

Our story starts with our customers. Rated #1 in support on TrustRadius and #1 in Customer Satisfaction on G2, we provide 24×7 live support with real technical engineers in your region. These engineers work as an extension of your team, enabling rapid results and providing a clear path to digital transformation.

Visibility for ITOps and DevOps to partner in business modernization

LogicMonitor eliminates application and information silos between ITOps & DevOps and prevents context switching with a single view of application services, performance, and infrastructure. Execute and achieve digital transformation initiatives by empowering ITOps & DevOps teams to correlate signals across applications and infrastructure with business outcomes.

Gather, track, trace and measure application performance across hybrid and multi-cloud architectures. Optimize user experience, detect application latency and identify bottlenecks to resolve issues faster, maximize application resiliency and eliminate application silos – delivered via LogicMonitor’s Unified Observability Platform.

LM Cloud simplifies cloud monitoring, and delivers comprehensive visibility into AWS infrastructure health and performance that is otherwise challenging to obtain.

Four reasons to choose LogicMonitor over Datadog

observability

The broadest full-stack observability platform for complete visibility

This dashboard provides an a listing of various metrics that are monitored for Azure Billing Service. The metrics displayed are total cost for previous month, cost per account, advisor recommendations, cost by operation, cost by region and cost by service

Rapid and automatic deployment for immediate time to value

Datadog requires significant work on the customer’s part when it comes to deploying and maintaining it across thousands of servers. Get the answers you need to solve problems faster with LogicMonitor’s fully automated platform. Our agentless collectors automatically discover, map, and set baselines for complex and distributed infrastructure in a matter of minutes.

Smarter with effortless scaling

Standalone monitoring solutions like those Datadog offers aren’t designed to handle the scale and complexity of the new cloud-native world. With LogicMonitor, you can scale seamlessly and allow your business to better serve customers.

GCP Billing dashboard

Stay savvy with billing built for the modern age

Datadog bills by high-water marks, and by the hour. Conversely, LogicMonitor bills by monthly averages built with daily snapshots. That means you won’t get snagged with huge usage overages.

It's almost like magic. Let's chat.