Virtual Machine Monitoring for Every Environment
Monitor virtualized infrastructure at scale with complete observability, AI-powered insights, and the control your teams need to deliver reliable digital experiences.


Monitor virtualized infrastructure at scale with complete observability, AI-powered insights, and the control your teams need to deliver reliable digital experiences.
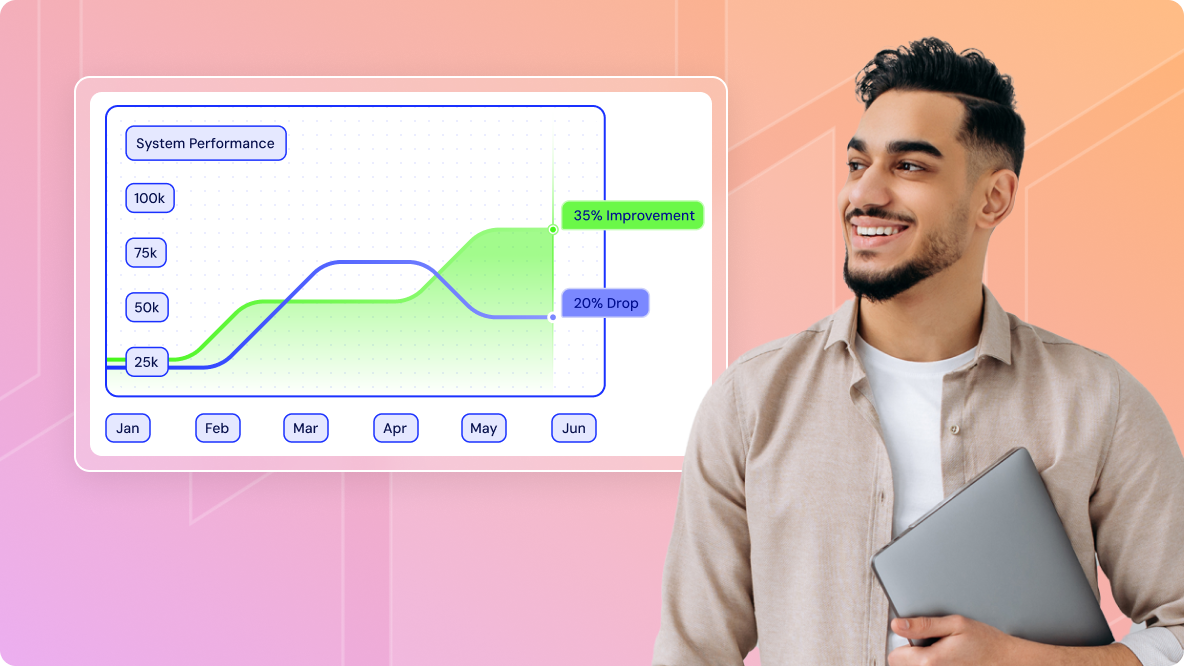
Catch performance dips early, minimize downtime, and keep apps responsive—no matter how many virtual machines you’re managing.
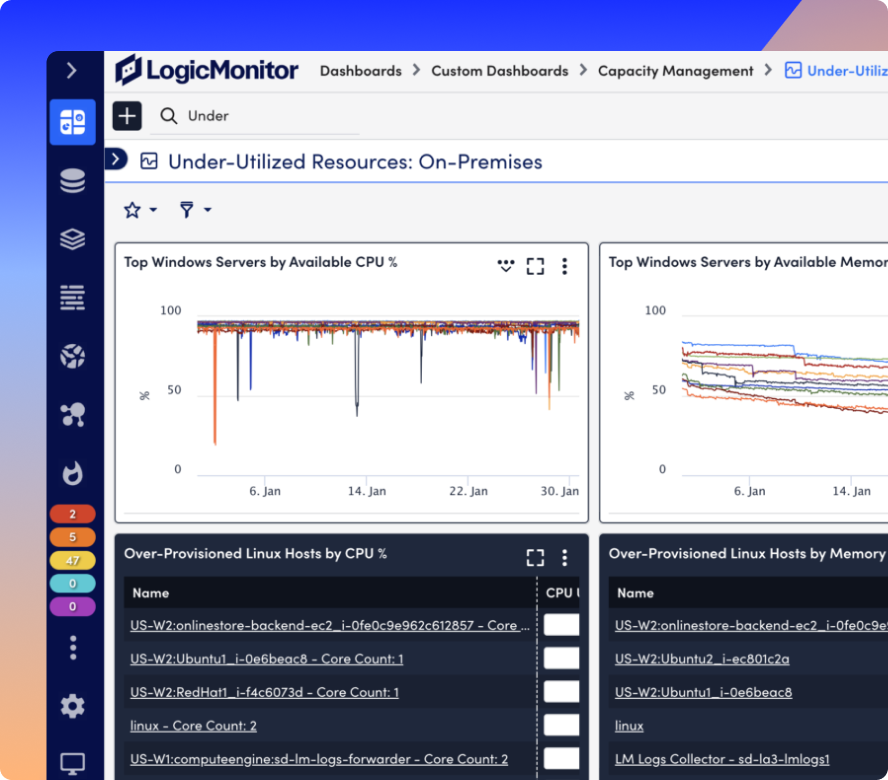
Eliminate overprovisioning and underutilization with real-time visibility into how VM resources are actually being consumed.
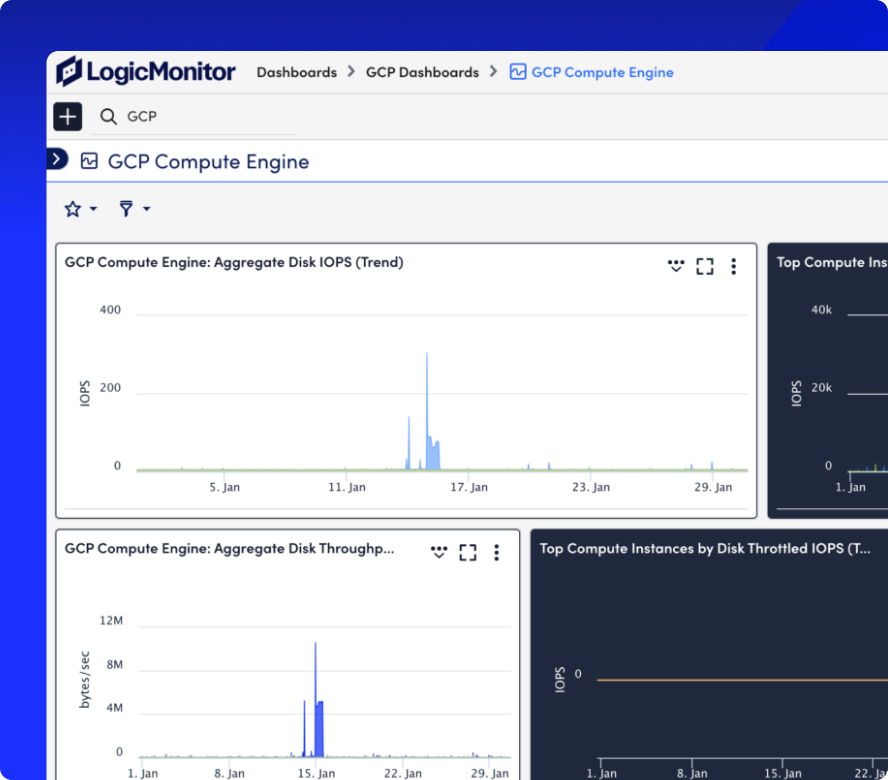
Monitor virtual machines across on-prem, private, and public cloud from one place, so you can manage complexity without added chaos.
Stay ahead of outages with early insight into resource strain and performance degradation, so users stay connected and systems stay online.
Stop chasing alerts and start focusing on higher-impact work with intelligent monitoring that filters noise and prioritizes what matters.
Ensure your VMs stay healthy and available across all environments, so the business stays running, everywhere work happens.
Observability powered by LogicMonitor Envision and Edwin AI
From automated discovery and resource tracking to dynamic alerting and hybrid visibility, LM Envision gives you the tools to manage VM performance across private, public, and on-prem environments with confidence.
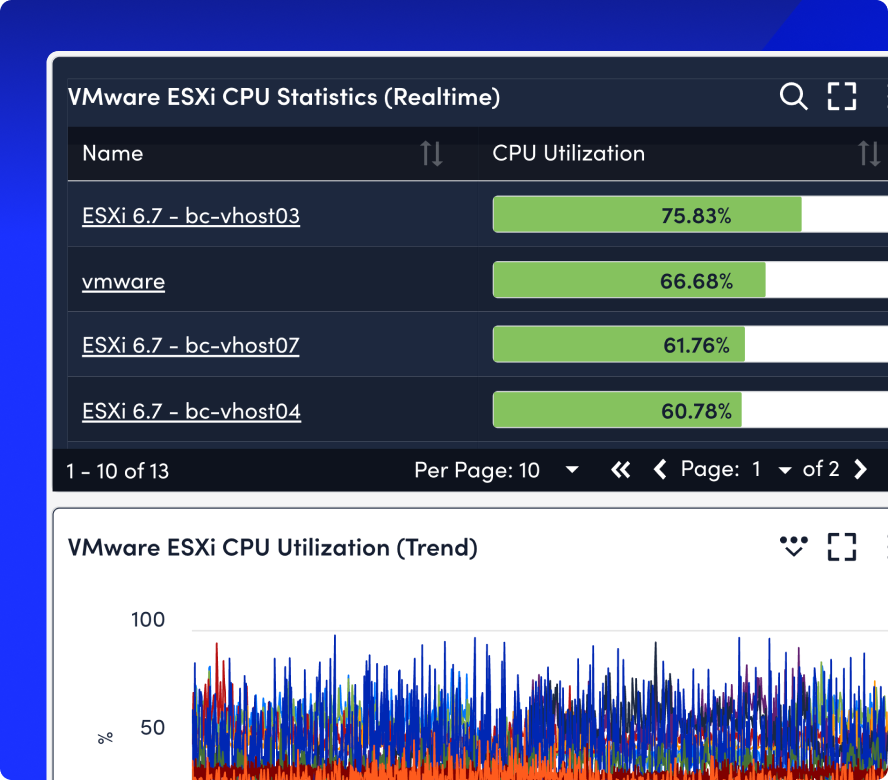
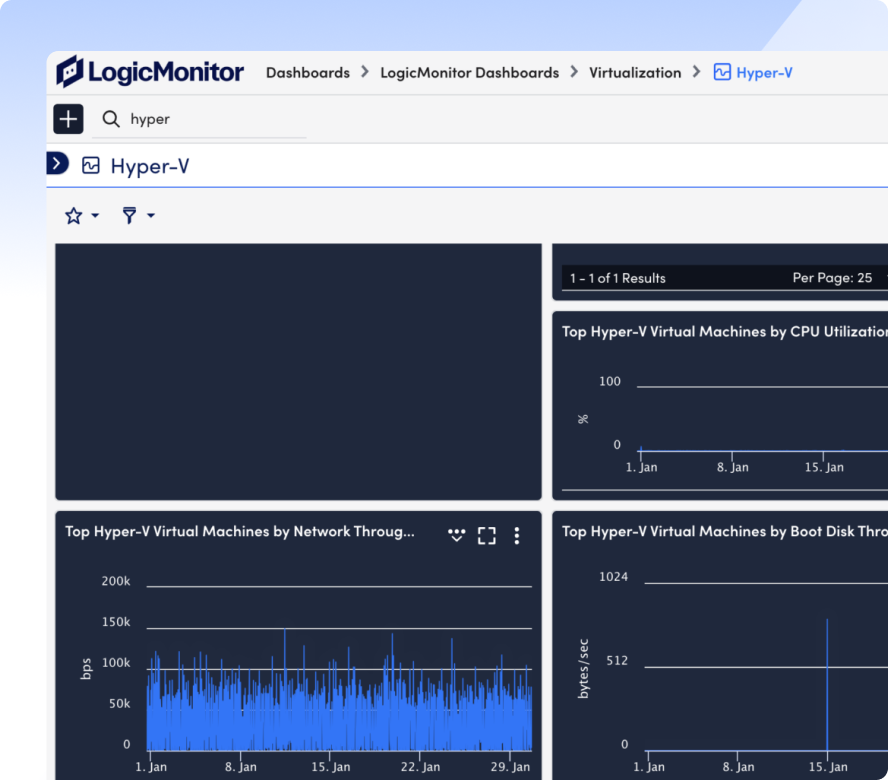
Automatically detect hypervisors, hosts, and VMs across your environments—no manual setup or agents required.
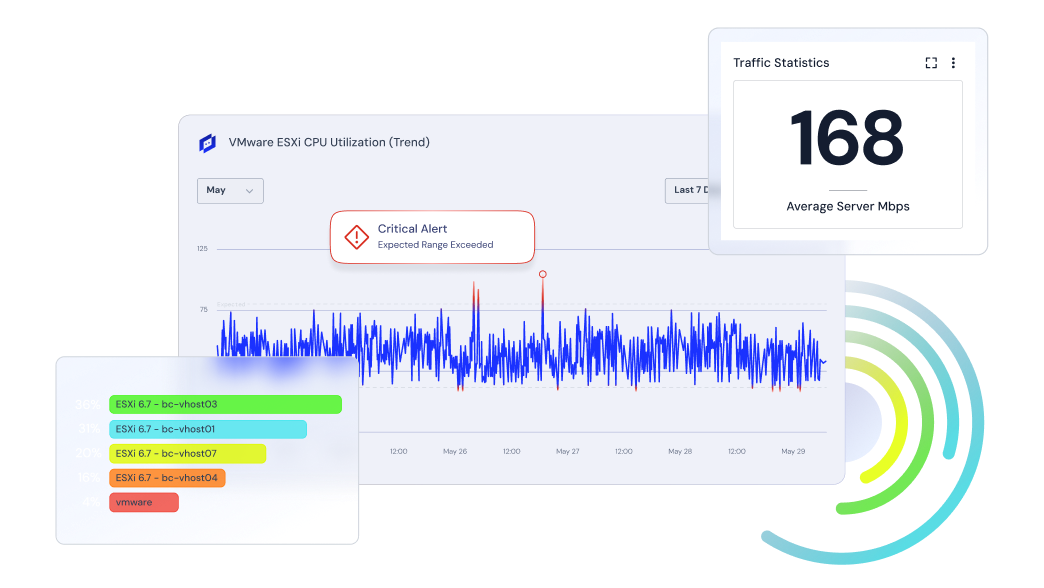
Use intelligent thresholds and anomaly detection to stay ahead of capacity strain and prevent service-impacting slowdowns.
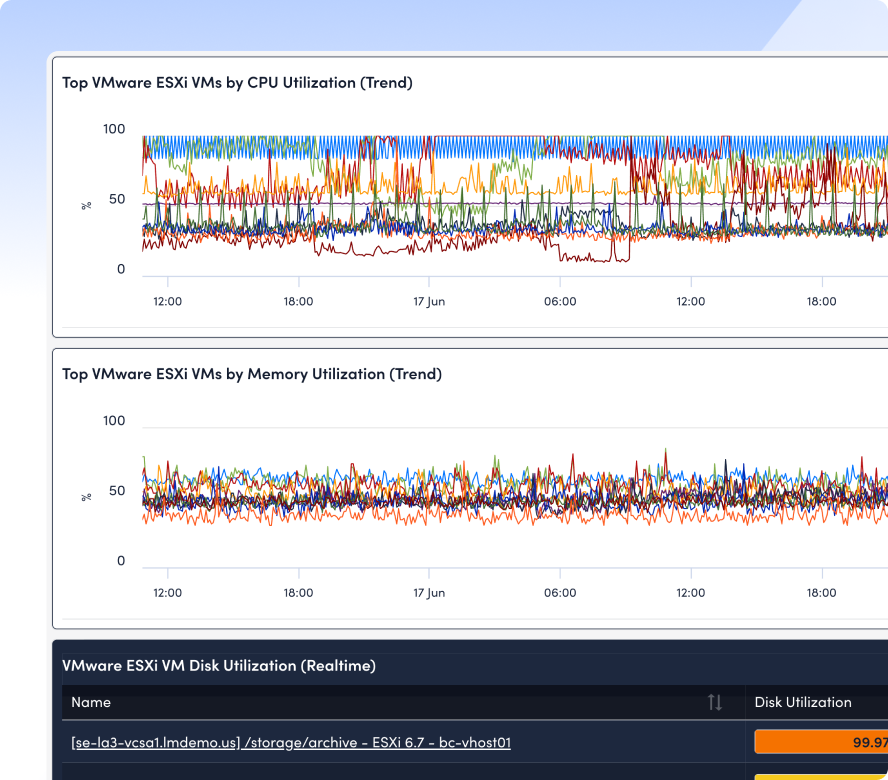
Correlate CPU, memory, storage, and IOPS metrics to right-size your environment and eliminate resource waste.
Automatically generate maps that show how VMs, hosts, and dependencies connect, so your team can troubleshoot faster.
Start secure remote sessions from your browser—no clients, no plugins, no hassle.
Integrations
LM Envision connects to your entire virtualization ecosystem, from VMware vCenter and Horizon to Microsoft Hyper-V and Nutanix Clusters. Monitor every VM, host, and hypervisor alongside your broader infrastructure, with built-in integrations for ITSM tools, public clouds, and collaboration platforms.
100%
collector-based and API-friendly
3,000+
integrations and counting
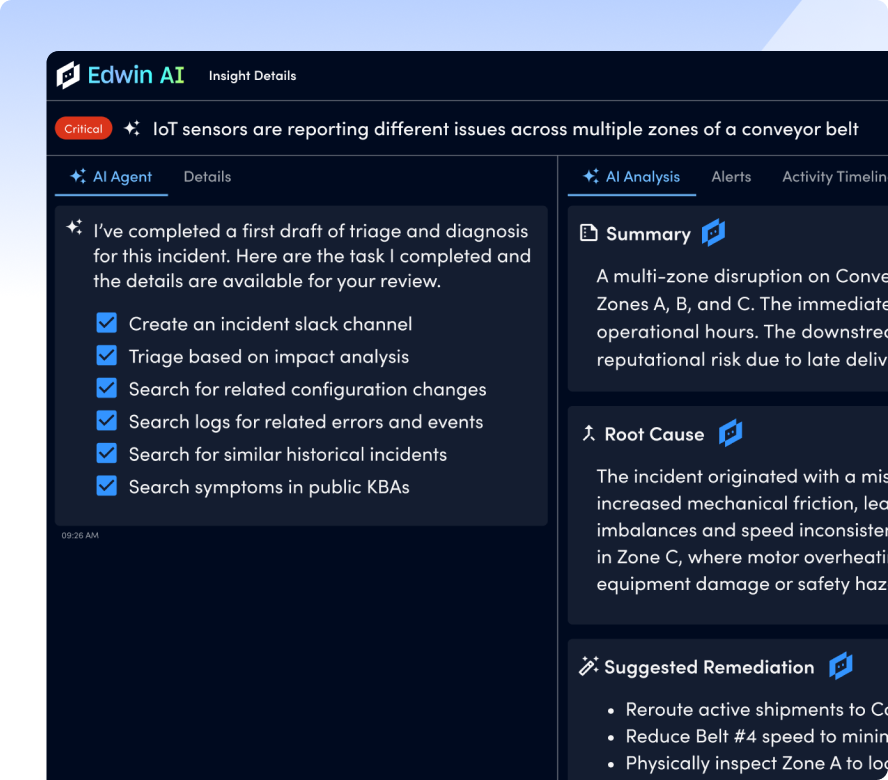
AI AGENT FOR ITOPS
Edwin AI turns noisy VM data into clear, actionable insight. Automatically summarize incidents in plain language, correlate alerts across your hypervisors, storage, and apps, and surface the root cause before end users even notice.
67%
ITSM incident reduction
88%
noise reduction
BY THE NUMBERS
GET ANSWERS
Get the answers to the top VM monitoring questions.
No. LM Envision uses a lightweight, agentless collector to discover and monitor remote infrastructure via standard protocols like SNMP, WMI, and API. That means you can start monitoring remote environments quickly without installing software on individual devices.
Yes. LM Envision includes built-in integrations for monitoring performance, availability, and license usage across key SaaS platforms, including Zoom, Microsoft 365, GitHub, and GitLab, ideal for remote collaboration and engineering tools.
You can monitor VPN tunnel health, bandwidth utilization, and connectivity across distributed users and locations. LM Envision also tracks ISP availability and performance, giving you the data you need to identify slow connections or outages in real time.
LM Envision uses Edwin AI to reduce alert noise, correlate related events, and route incidents automatically to the right team. You can also set up automated workflows, custom thresholds, and escalation policies to fit your team’s needs.
Yes. Remote sessions can be initiated directly from the LM portal using protocols like RDP, SSH, VNC, Telnet, and HTTPS. No client installations or plugins are required—just secure, browser-based access.
Most teams begin monitoring infrastructure within minutes using agentless discovery and pre-built dashboards. You’ll have immediate access to real-time metrics, alerts, and insights without a lengthy setup process.