Hybrid Observability for Tech and Software
Technology & Software IT Monitoring: Scalable, Predictive, Autonomous
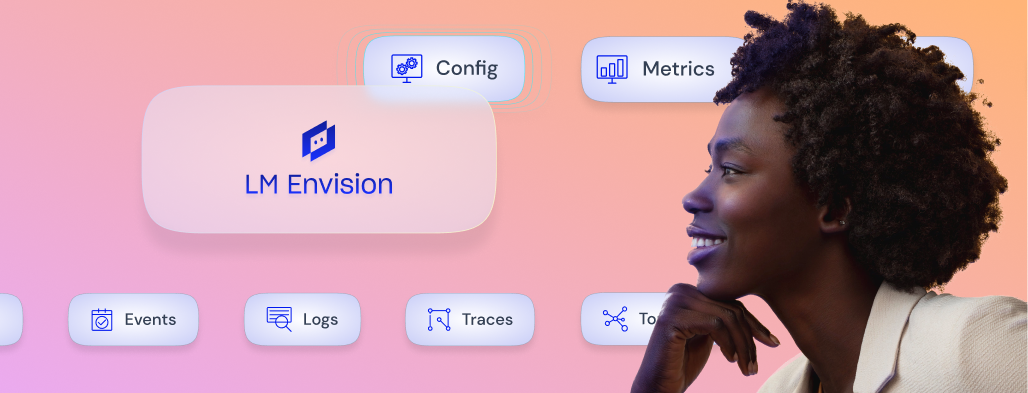
From microservices to internet-delivered experiences, LogicMonitor helps technology teams keep complex environments observable, resilient, and ready to scale. Unify infrastructure, cloud, digital experience, and internet performance signals with Edwin AI to move from detection to action.