
Application Performance Monitoring That Keeps Apps Fast, Reliable, And Ready For Users
See when application issues affect performance, reliability, or user experience, so your teams can fix problems faster and protect every digital journey.
See when application issues affect performance, reliability, or user experience, so your teams can fix problems faster and protect every digital journey.
Catch application slowdowns, failed journeys, and service issues early, so teams can protect customers, employees, revenue, and SLAs.
Understand whether issues are tied to the app, infrastructure, network, cloud, Internet, or third-party services before teams lose time guessing.
Measure performance across locations, devices, networks, and journeys, so teams can spot the issues that internal checks alone might miss.
Connect user impact to application behavior so teams can prioritize the pages, APIs, regions, and journeys that affect satisfaction, conversion, and productivity.
Give DevOps, ITOps, SRE, and platform teams a shared view of application health, dependencies, and impact, so they can reduce handoffs and resolve issues faster.
Monitor apps, APIs, cloud services, and release paths across the DevOps lifecycle to catch regressions before they affect users, revenue, or SLAs.
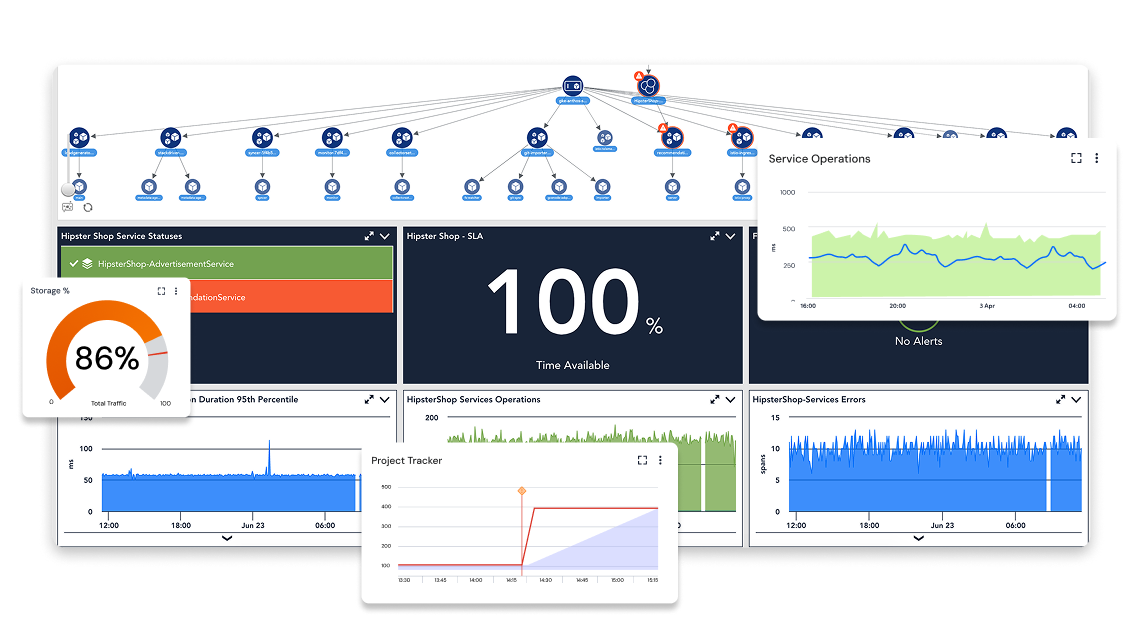
LM Envision brings application, infrastructure, user experience, and Internet performance signals together so teams can spot issues earlier, understand impact faster, and keep critical digital experiences running.
Track transactions across services, APIs, cloud apps, PaaS, and hybrid environments so teams can see where performance breaks down and what depends on what.
Capture real user behavior across web and mobile apps to understand where journeys stall, which users are affected, and what deserves attention.

Run synthetic and API tests from global and private locations to validate availability, latency, and workflows before users are disrupted.
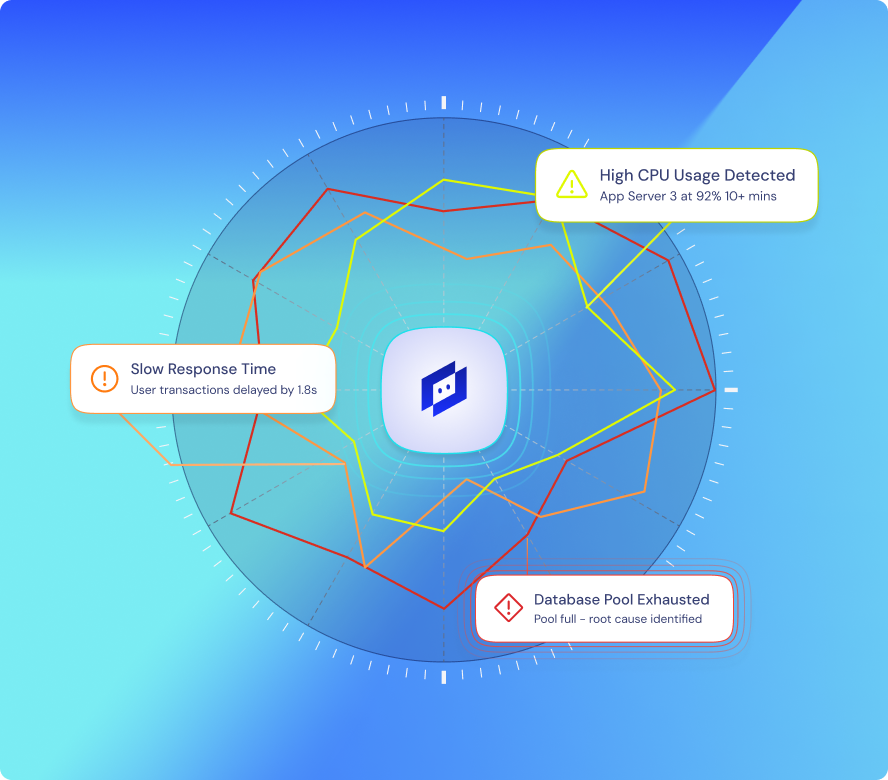
Correlate application, infrastructure, network, user experience, and Internet signals so teams can identify root cause faster and avoid finger-pointing.

Integrations
Connect OpenTelemetry, OpenMetrics, CI/CD, ITSM, collaboration, alerting, and business systems with application, Internet, and user-experience telemetry. LM Envision helps teams ingest, correlate, and act without stitching together separate APM, NPM, DEM, and IPM tools.
100%
collector-based and API-friendly
3,000+
integrations and counting
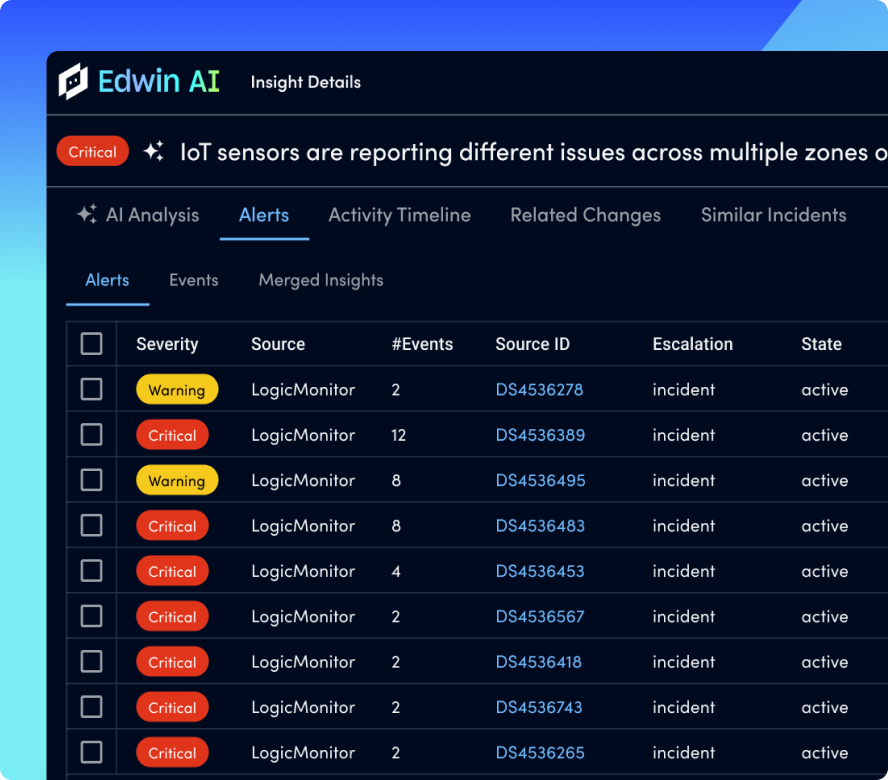
AI AGENT FOR ITOPS
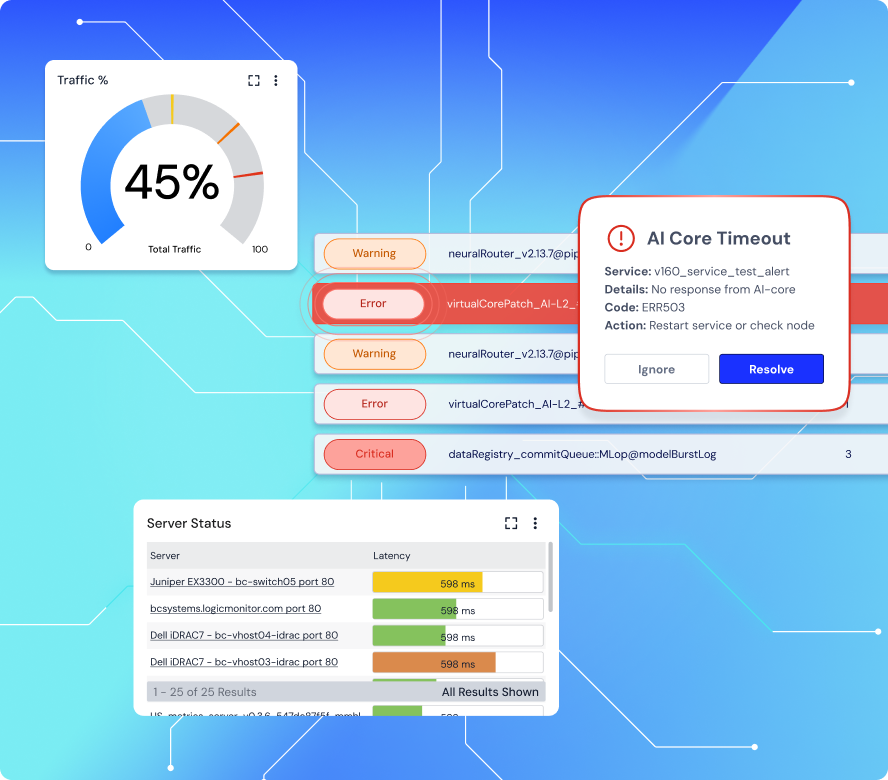
Edwin AI connects traces, metrics, logs, events, synthetics, RUM, and Internet telemetry to explain what happened, who is affected, and where to act. Reduce alert noise, distinguish internal issues from external dependencies, and move from triage to remediation faster.
67%
ITSM incident reduction
88%
noise reduction

GET ANSWERS
Get the answers to the top application monitoring questions.
LM Envision collects traces, metrics, logs, custom metrics, synthetics, RUM, and Internet telemetry, then correlates them with infrastructure and service context so teams can detect issues, understand impact, and resolve root cause faster.
Traditional APM shows what happens inside your code and services. Outside-in monitoring adds the user and Internet perspective, including DNS, CDN, ISP, BGP/routing, SaaS, cloud, edge, and third-party dependencies that can break experience even when your app looks healthy.
Learn moreYes. Use global vantage points for public applications and private, on-premises, or enterprise nodes for internal apps, APIs, and services behind the firewall. That gives teams consistent measurements across environments instead of competing tool signals.
Synthetic monitoring proactively tests availability, latency, APIs, and user journeys before users are affected. RUM captures what real users experience in production. Together, they show both early warning signals and live user impact.
Edwin AI analyzes correlated signals across apps, infrastructure, users, and Internet dependencies to reduce alert noise, summarize root cause, prioritize business impact, and trigger workflows that speed remediation.
