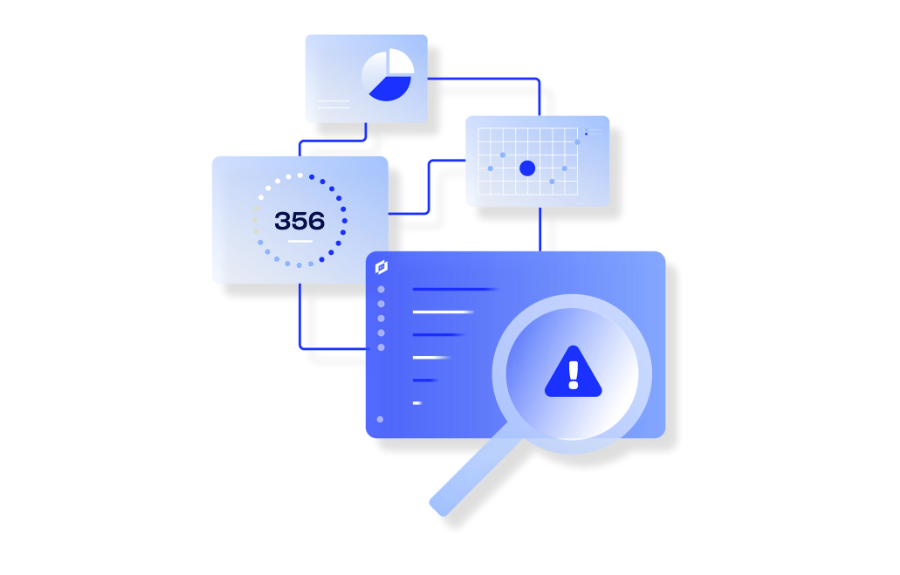
Stop Reacting, Start Innovating with Agentic AIOps
IT teams often spend more time troubleshooting issues than working on the strategic projects that matter. See what’s coming, solve problems faster, and do more with agentic AIOps.
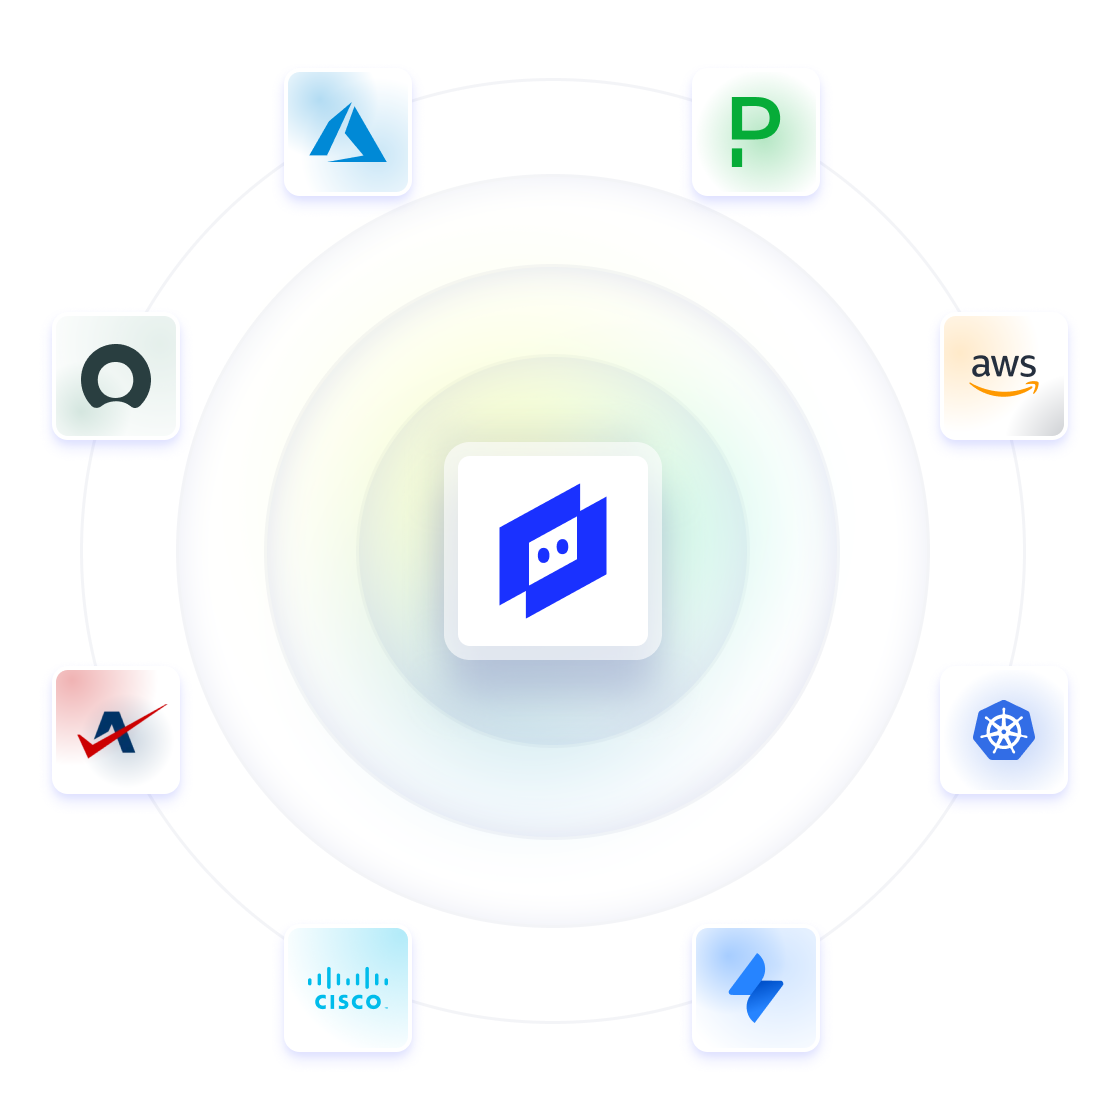
MORE THAN 3,000 OUT-OF-THE-BOX INTEGRATIONS


Legacy AIOps reacts. Agentic AIOps prevents.
Today’s IT teams face a tidal wave of complexity. Legacy AIOps react when it’s too late, still relying on predefined rules and static integrations that fail to deliver real outcomes. Agentic AIOps is proactive. It doesn’t wait for a failure to trigger a response—it anticipates, acts, and adapts before issues escalate.
Agentic AIOps: A new standard for operational excellence
Agentic AI
Agentic AIOps operates independently, continuously learning, adapting to changing environments, and making real-time, contextual decisions—resolving issues proactively without human intervention.
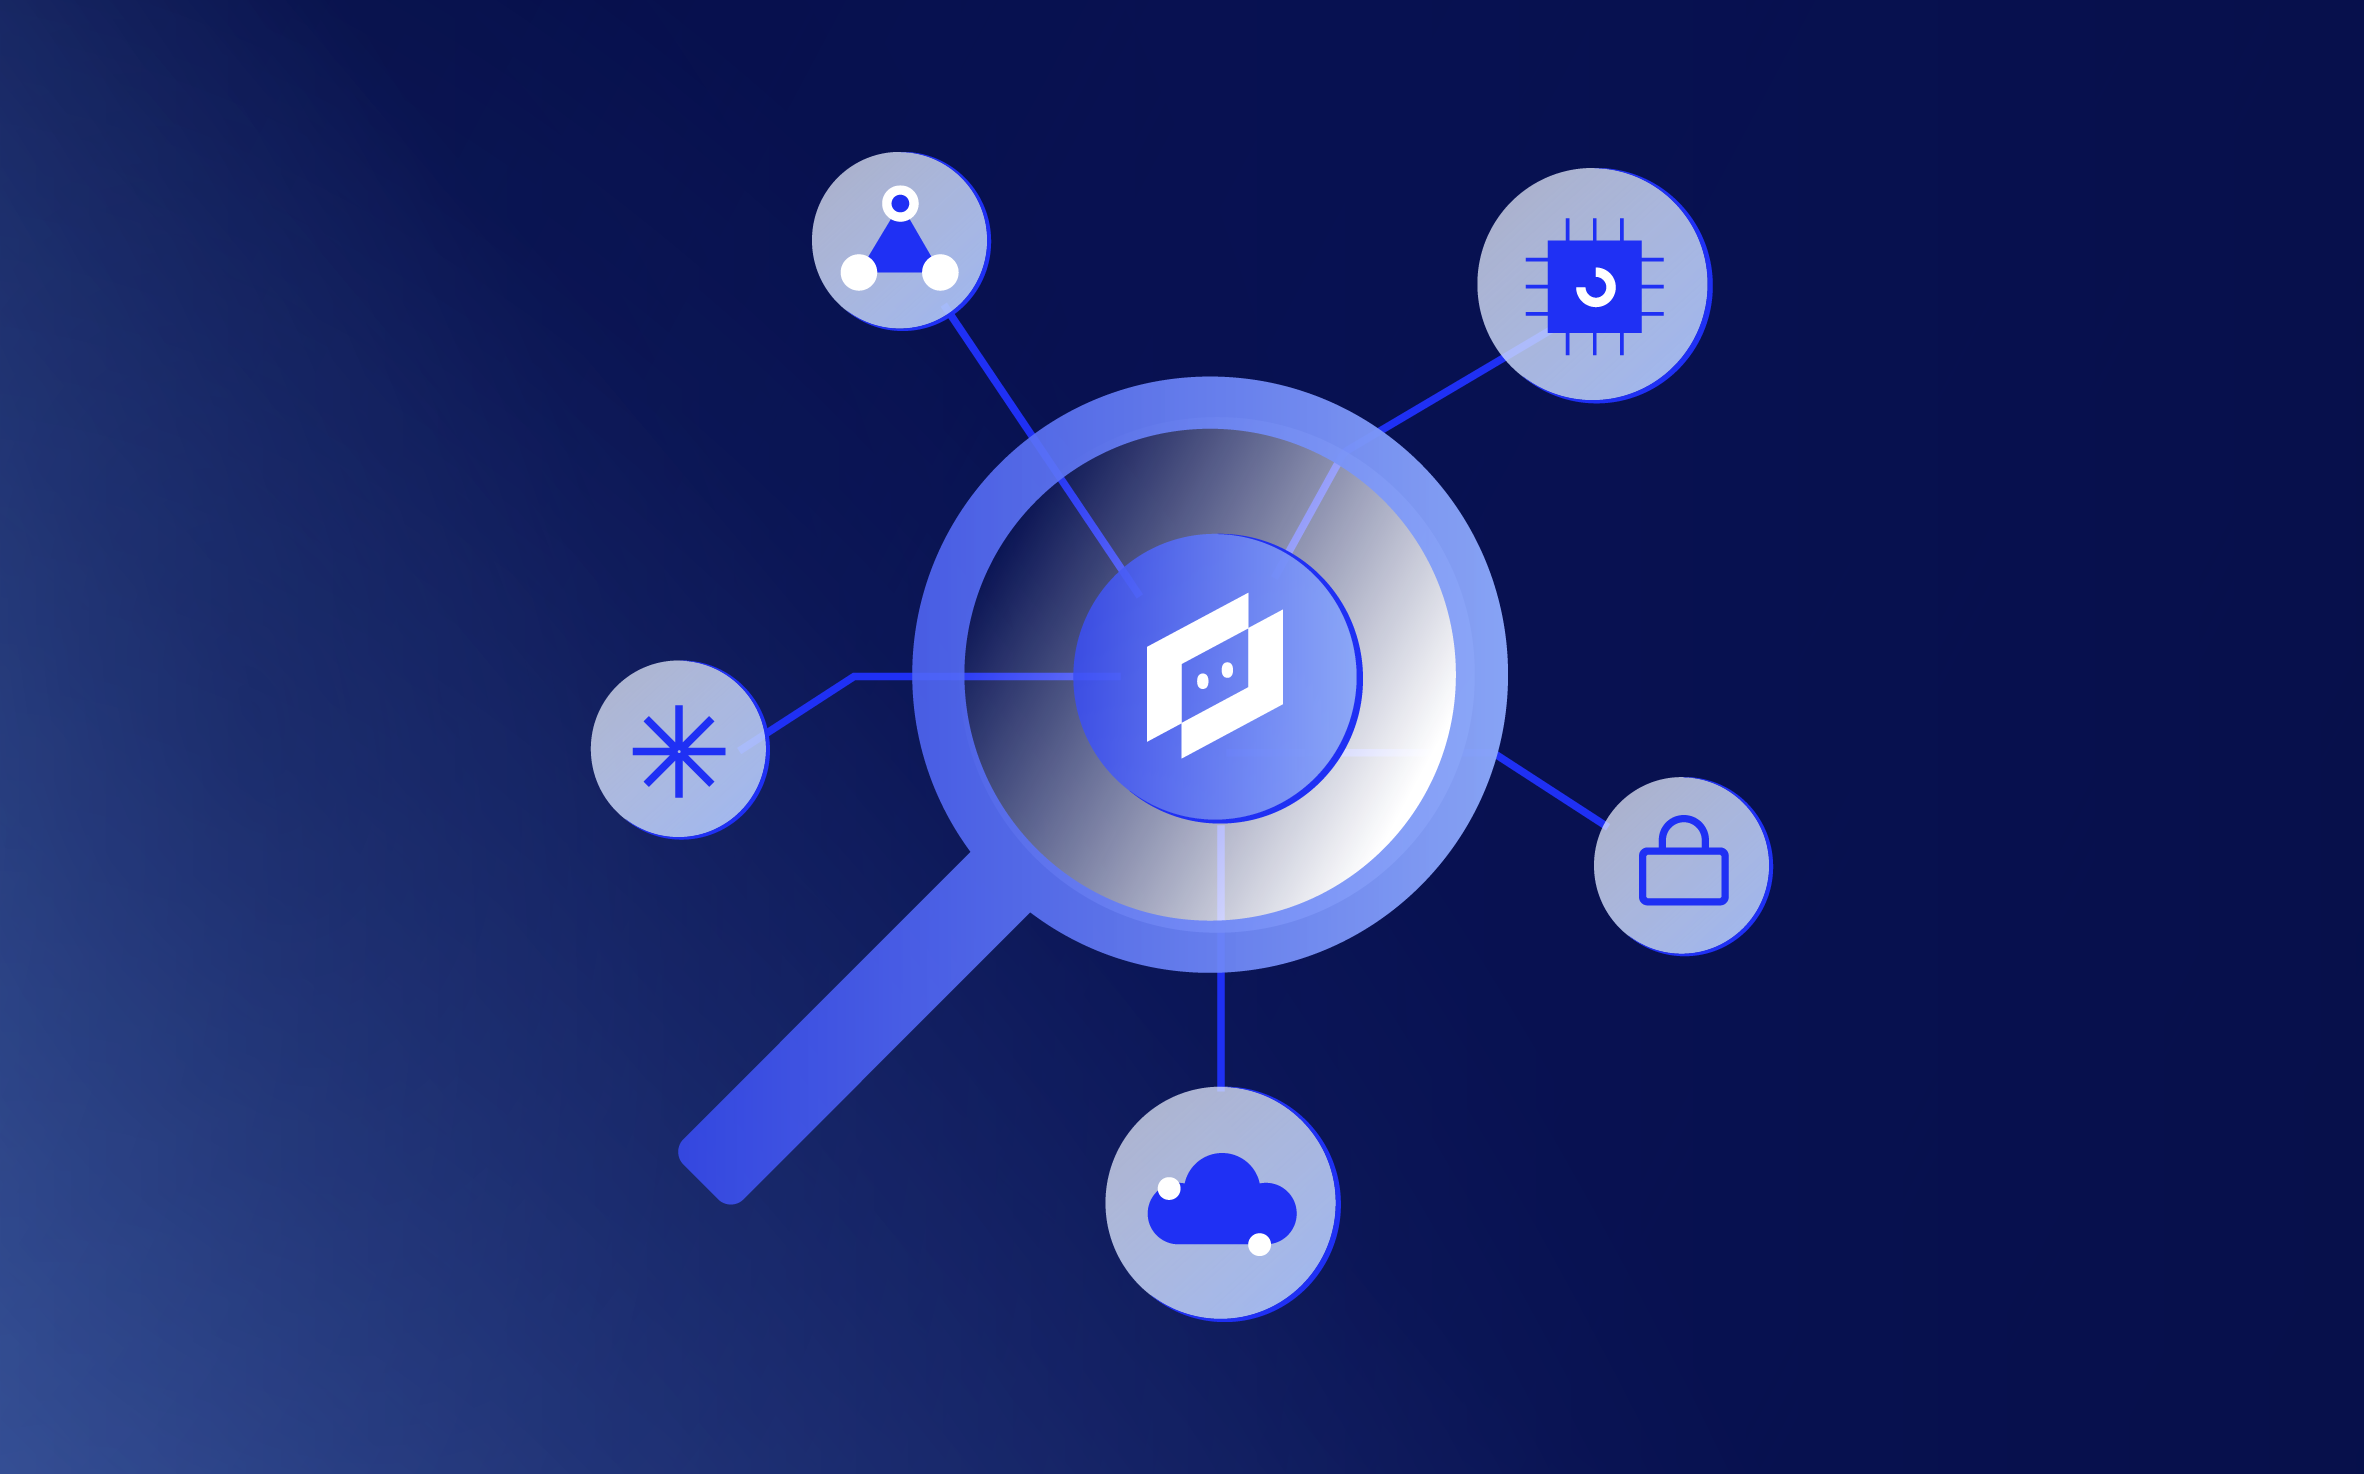
Cross-domain observability
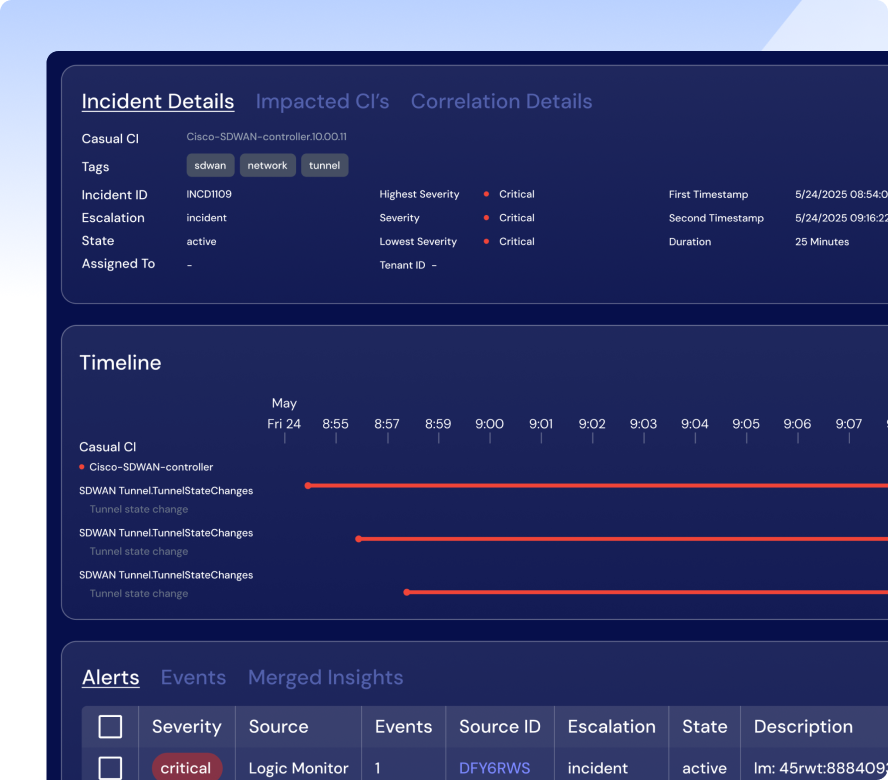
Not just data collection—agentic AIOps works with your observability data, unifying structured and unstructured data and enriching it with metadata for a real-time, contextual view of your IT systems.
Conversational interface
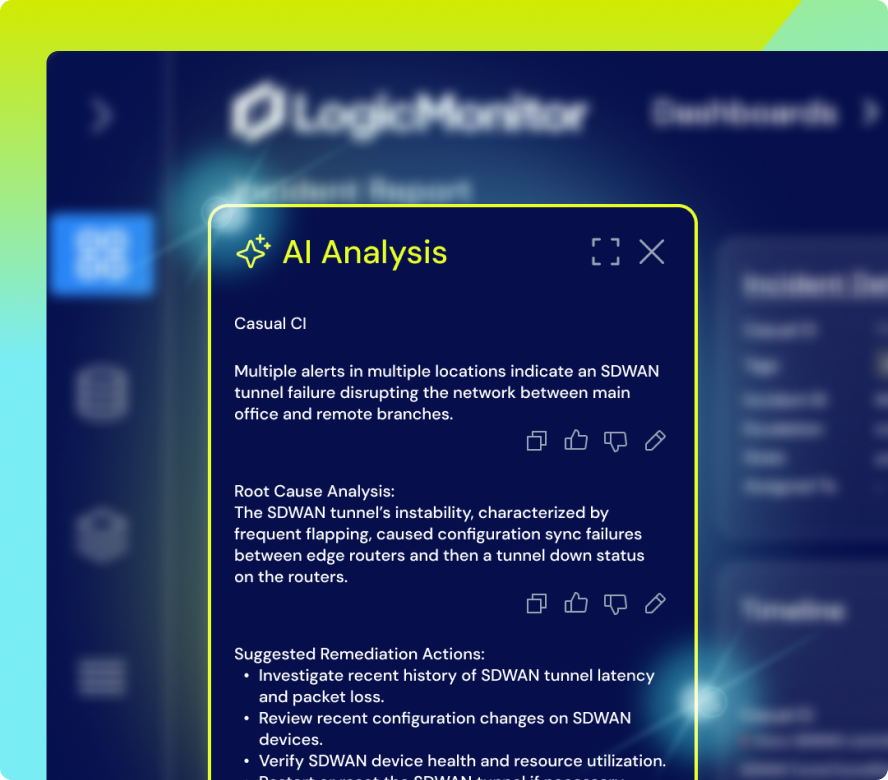
Generative AI, powered by a context-aware knowledge graph, enables a natural, conversational interface. Using Retrieval-Augmented Generation (RAG), it translates complex system data into clear, actionable insights, providing real-time troubleshooting, root cause analysis, and more.
End-to-end automation
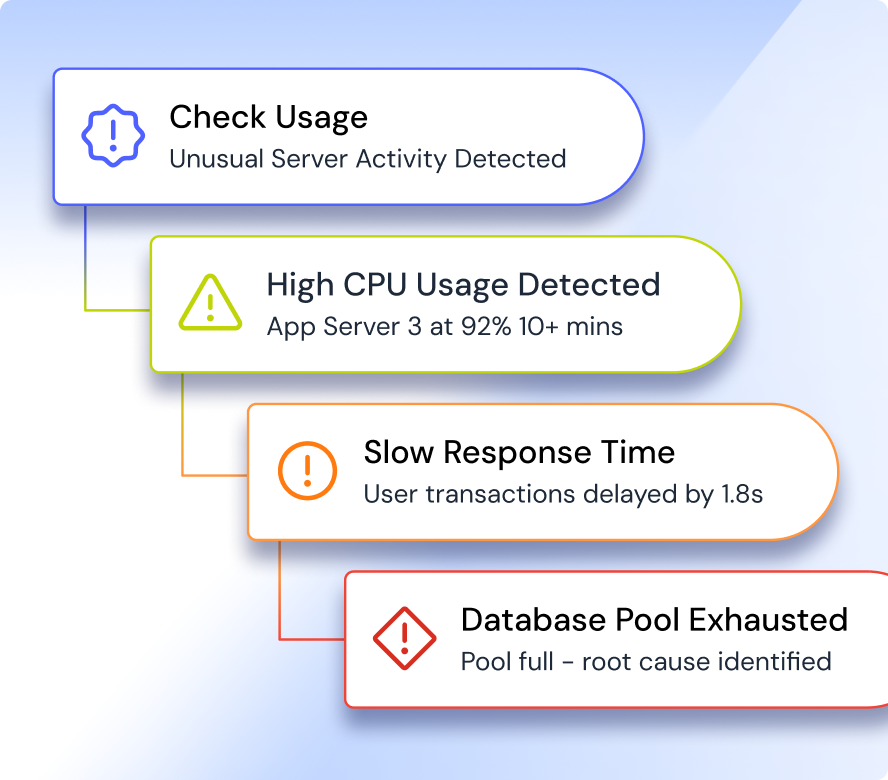
Automate the entire incident lifecycle—detection, correlation, and remediation—to reduce resolution time and minimize overhead. AI agents not only identify issues but can fix them proactively.
No rules, No topology, No outdated dependencies
It’s time to say goodbye to manual tuning and outdated topologies. LogicMonitor’s AI agent—Edwin AI—adapts in real-time to provide a dynamic, always-updated view of your IT environment, eliminating the need for constant maintenance. Edwin AI keeps you ahead of the curve and focused on what matters most.
Act before alerts escalate
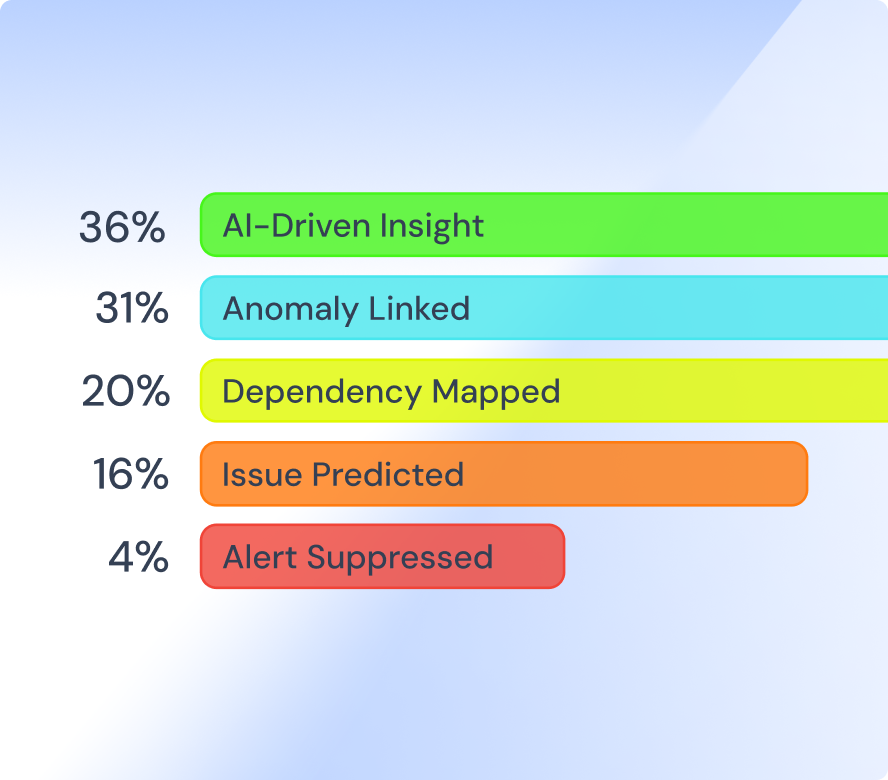
Edwin AI filters out 80% of noise—but more importantly, it detects early warning signals and responds before incidents occur. Event Intelligence ensures your team only sees the signals that matter, empowering you to act proactively. It’s the most efficient way to prevent downtime and optimize your operations.
Your AI Agent built for ITOps
Edwin AI offers an AI agent that turns structured and unstructured data into actionable insights with plain-language summaries, predictive analysis, and step-by-step troubleshooting. This dramatically cuts MTTR, improves SLA compliance, and lets your team focus on the big picture without getting bogged down by repetitive tasks.

Broad data integration for better insights
Edwin AI integrates both structured and unstructured data from diverse sources like your ITSM, offering a comprehensive view of your IT environment. This broader context allows for faster, more accurate decision-making and quicker responses to potential problems.
GET ANSWERS
AIOps FAQs
What is AIOps?
AIOps (Artificial Intelligence for IT Operations) is a method for analyzing IT data and identifying patterns, combining historical and real-time data to provide insights for IT teams. Traditional AIOps solutions rely on predefined rules and static thresholds that require manual adjustments, while also struggling to adapt to dynamic changes in IT environments.
What is agentic AIOps?
Agentic AIOps is an advanced approach to IT operations that combines generative AI, agentic AI, and cross-domain observability to automate problem-solving and decision-making. Unlike traditional AIOps, which depends on static rules and manual oversight, Agentic AIOps continuously learns, adapts, and takes real-time actions to prevent disruptions and optimize system performance.
By analyzing structured and unstructured data from across the IT ecosystem, agentic AIOps provides deeper context, enabling proactive issue resolution and reducing downtime. Generative AI powers insights, summaries, and recommendations in natural language, making troubleshooting more accessible. Agentic AI goes further by autonomously executing corrective actions, such as rolling back configurations or initiating failovers, without requiring human intervention. Cross-domain observability integrates disparate data sources, including applications, networks, and infrastructure, into a unified view, allowing IT teams to detect patterns, uncover root causes, and resolve issues faster with complete operational visibility.
Learn moreWhat is anomaly detection?
Anomaly detection is the identification and notification of outliers within gathered datapoints. An anomalous datapoint is something that significantly deviates from a normal data range without reason.
What is machine learning?
Machine learning is the use of algorithms that improve automatically through historical analysis and experience.
What is event correlation?
Event correlation automatically groups event alerts into their most succinct form, vastly reducing the time it takes for support teams to reason about the mass of alerts. Effective event clustering can reduce alerts by over 97%.
What is root cause analysis?
Root cause analysis is the process of finding the core of an issue that caused a chain reaction effect ending in problems.
What are dynamic thresholds?
Dynamic thresholds are data ranges that show an acceptable changing range of datapoints based on similar historical factors.
What is Edwin AI?
Edwin AI is the first AI agent for IT operations, built by LogicMonitor to move beyond traditional AIOps. It proactively predicts, prevents, and resolves issues by analyzing real-time data, filtering out noise, and automating incident response. Unlike conventional tools that only detect problems, Edwin AI understands root causes, recommends actions, and executes fixes autonomously.
With advanced AI reasoning, cross-domain observability, and IT-specific automation, Edwin AI helps IT teams reduce alert noise by 90%, boost productivity by 20%, and prevent outages before they happen—all within a single, intuitive platform.
Learn moreTransform your IT operations with AI
Schedule a demo to see how agentic AI will shift your team from reactive to proactive.
RESOURCES
Check out our latest resources

Agentic AIOps is just one part of LogicMonitor Envision
Our comprehensive suite of monitoring and observability tools empowers your team to optimize performance, reduce downtime, and drive innovation.