
Website Monitoring That Protects Performance and Customer Experience
See when your websites are slow, unavailable, or hurting the user experience so your team can fix issues faster and keep digital journeys running smoothly.
See when your websites are slow, unavailable, or hurting the user experience so your team can fix issues faster and keep digital journeys running smoothly.
Find and fix availability, latency, and user journey issues before they reach customers, so teams can prevent disruption instead of reacting to complaints.
See how your websites perform across regions, networks, and journeys, so you’re not relying on internal health checks alone.
Connect slowdowns, outages, and front-end symptoms to the systems behind them so teams can move from detection to resolution faster.
Cut through alert noise and prioritize the issues most likely to affect customers, revenue, or business-critical digital services.
Understand which performance issues hurt key journeys, conversions, and user trust, so teams can improve what matters most.
Give operations teams, executives, and business stakeholders a clear view of uptime, performance, SLAs, and digital resilience.
With LM Uptime, as part of LM Envision, you can detect availability issues early, understand the user impact, and connect digital experience signals to the systems and services behind them.
Monitor websites, APIs, endpoints, and critical user journeys with continuous synthetic checks that show when something is slow, unavailable, or failing.
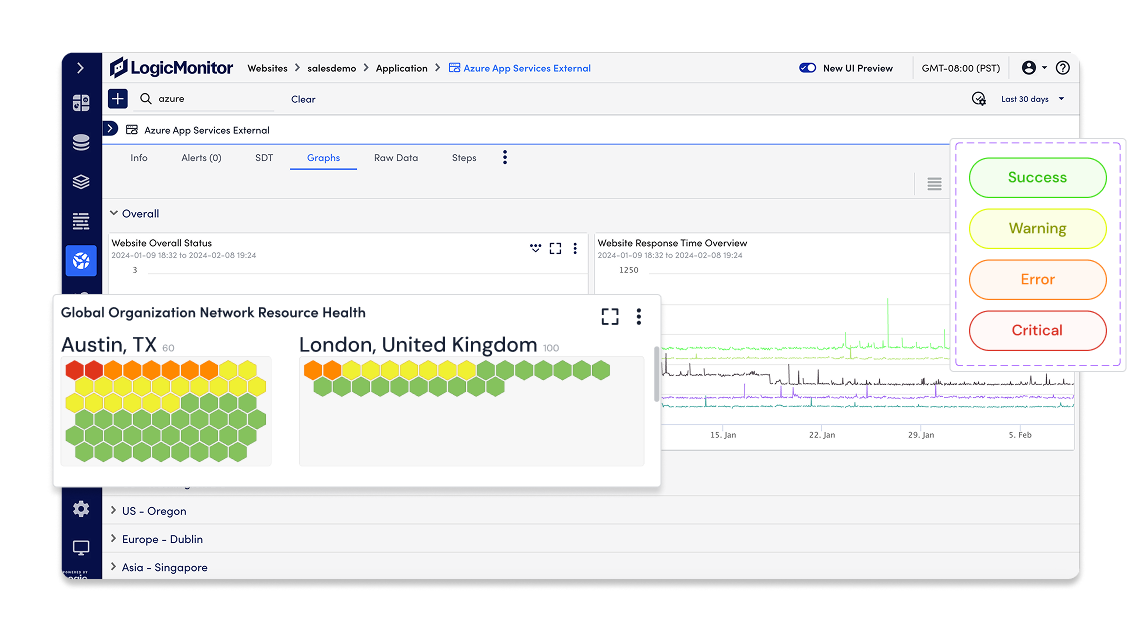
Validate performance from global locations, internal networks, and real user sessions so teams can understand whether an issue is isolated, regional, or business-critical.
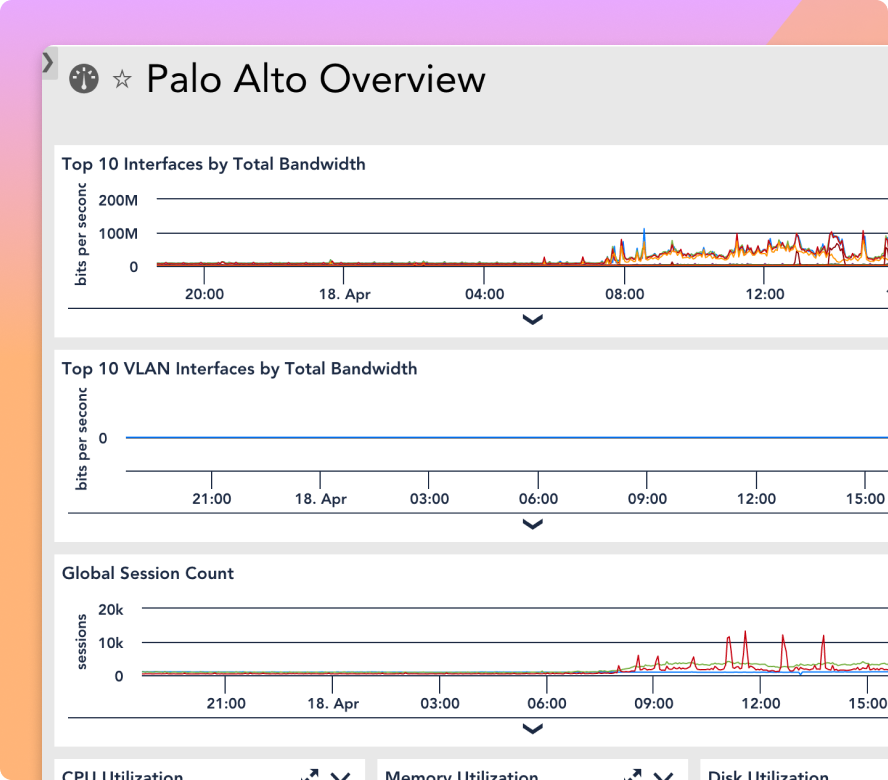
Bring website, API, DNS, CDN, cloud, network, application, and infrastructure signals together in LM Envision so teams can quickly see what’s behind an outage or slowdown.
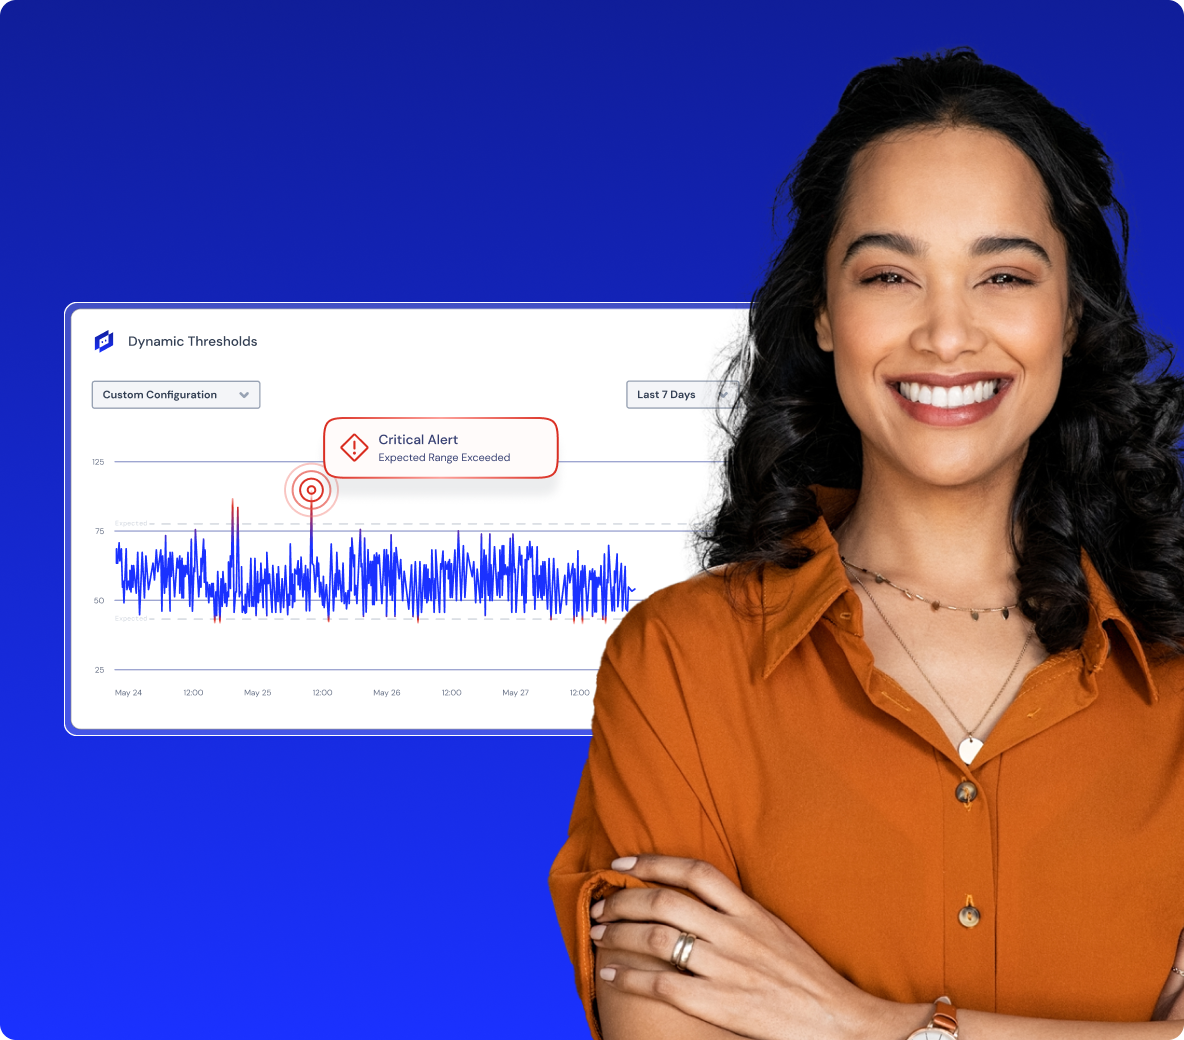
Get alerted when a site, endpoint, or journey is down or degraded, with the context teams need to prioritize real customer impact instead of chasing noise.
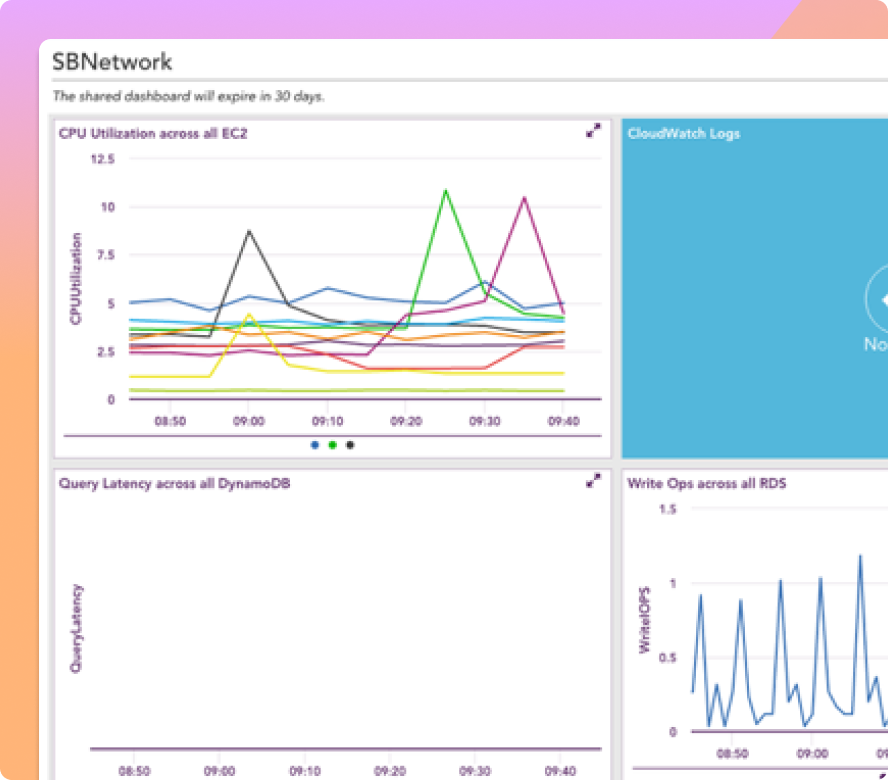
Keep teams aligned with dashboards and reports that connect uptime, performance, user experience, and operational health to the outcomes stakeholders care about.

INTEGRATIONS
Our platform connects with the tools your team relies on, from cloud providers, CDNs, DNS, CI/CD pipelines, and APIs to collaboration, alerting, and ITSM platforms. Extend website monitoring into existing workflows and reduce the noise of jumping between point solutions.
100%
collector-based and API-friendly
3,000+
integrations and counting
AI AGENT FOR Cloud-Native Ops
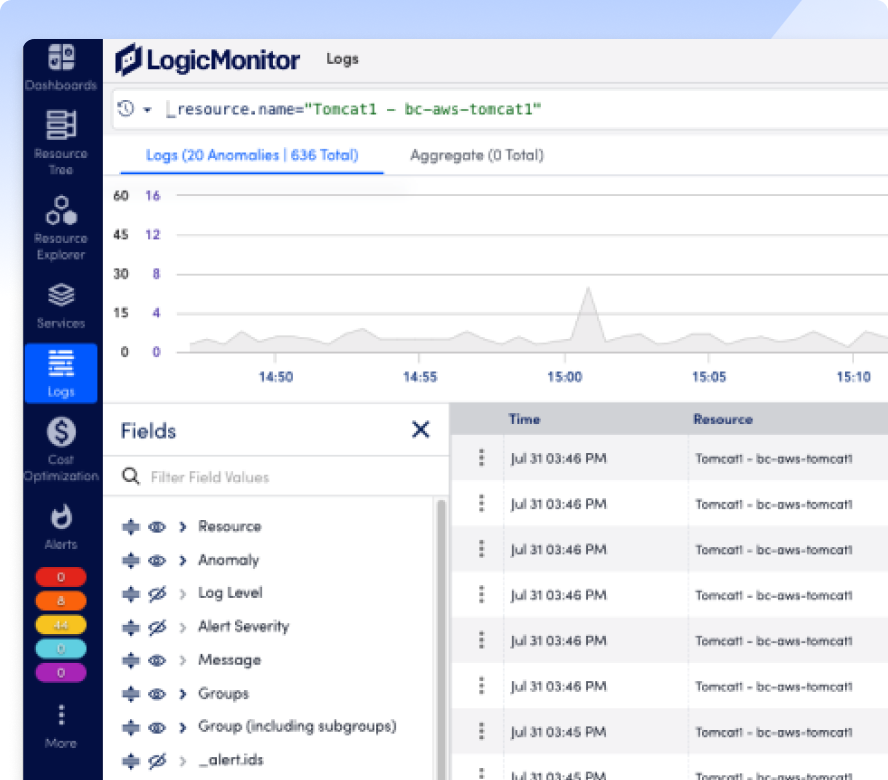
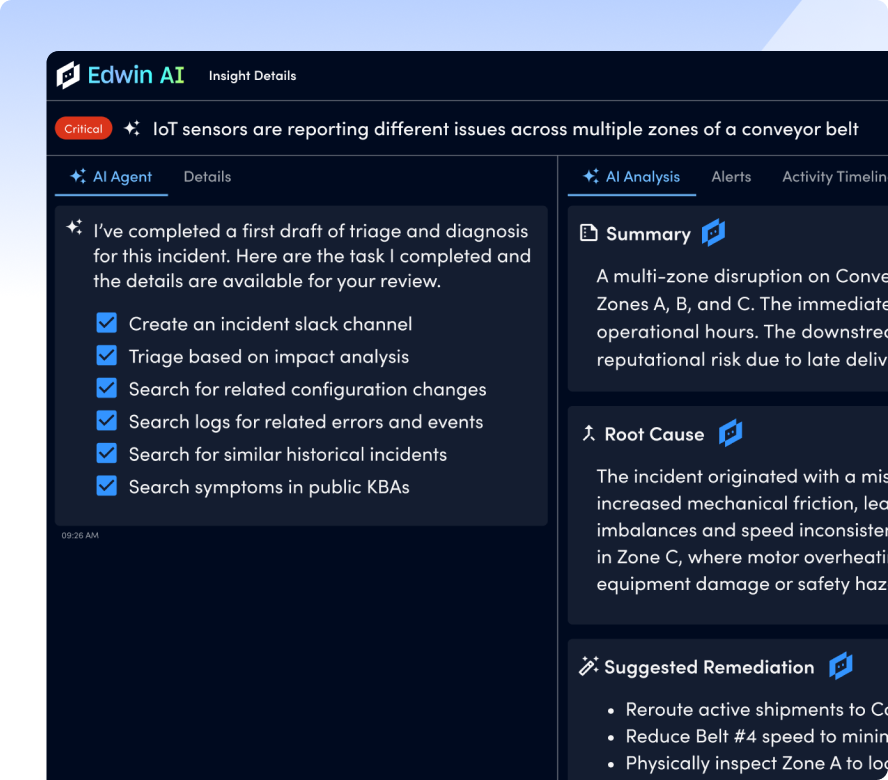
Troubleshooting website issues doesn’t have to mean hunting through logs, dashboards, Internet telemetry, and alert streams. Ask Edwin about any anomaly and get instant, human-readable answers that help teams separate internal issues from external dependencies and fix problems faster.
67%
ITSM incident reduction
88%
noise reduction
BY THE NUMBERS
GET ANSWERS
Get the answers to your top website monitoring questions.
LogicMonitor helps teams catch downtime, slow pages, failed transactions, API issues, DNS or CDN problems, regional disruptions, and third-party dependency failures. By combining synthetic checks, real user signals, and infrastructure context, teams can find issues earlier and focus on the problems most likely to affect customers, revenue, or critical services.
LogicMonitor connects website, API, DNS, CDN, cloud, network, application, log, and infrastructure signals in one platform. When a slowdown or outage occurs, teams can correlate front-end symptoms with the services and dependencies behind them. Edwin AI can also help explain anomalies and guide teams toward likely causes so responders spend less time jumping between tools.
LogicMonitor supports continuous checks for websites, APIs, endpoints, and key user journeys from global locations and internal networks. Teams can monitor public-facing digital experiences as well as private apps and services behind the firewall. Location-aware monitoring helps show whether an issue is isolated, regional, or widespread, with check frequency configured based on the importance of each service or journey.
