
Disclaimer: This content applies to LM APM Synthetics, and will be removed at a future time. At the time of removal, you will automatically be redirected to the up-to-date content. LogicMonitor is transitioning synthetic monitoring capabilities to Synthetics and Internet Performance Monitoring, our more robust long-term solution solution with enhanced capabilities. For up-to-date content, see the Synthetics and Internet Performance Monitoring documentation.
LM Synthetics Overview
Last updated - 17 July, 2026
Synthetic monitoring uses emulation or scripted recordings of user interaction or transactions to create automated tests. These tests simulate a critical end user pathway or interaction on a website or web application. The results of these tests give early insight into the quality of the end user experience by reporting metrics on availability and latency, and identifying potential issues. For example, you may receive an alert that a critical user pathway, such as checkout or login, is encountering an error. This allows you to investigate the problem and potentially fix the issue before your users are impacted.
You can further analyze possible reasons for an issue using application metrics, traces, and logs in your LogicMonitor platform using LM APM and LM Logs. For more information, see LM APM Overview and LM Logs Overview.
Synthetics monitoring leverages Selenium—an open access, open source browser automation and scripting tool—to send Synthetics data to LogicMonitor. LogicMonitor uses the following Selenium tools for the Synthetics monitoring solution:
- Selenium GRID—Proxy server that allows tests to be executed on a device
- Selenium IDE Chrome Extension—Browser recording tool that allows you to create and run the synthetics checks
For more information about the Selenium tools used by LogicMonitor, see the following website:
https://www.selenium.dev/projects/
The following diagram illustrates how LogicMonitor leverages Selenium to collect Synthetics data:
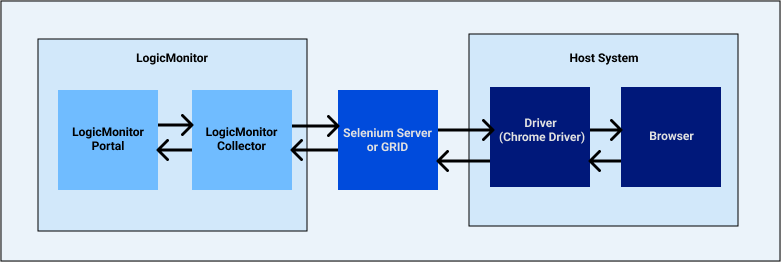
To begin collecting Synthetics data, you must set up your environment. This involves installing the Selenium GRID and enabling a LogicMonitor Collector to access the GRID. This enables you to add a Selenium Synthetics Selenium Webcheck in your LogicMonitor portal for ingesting Synthetics data to LogicMonitor.
For more information, see Selenium Synthetics Setup.
