
Getting Alert Details
Last updated - 25 July, 2025
You can use LogicMonitor REST API v3 to get alert details. You must authenticate yourself before making the API request.
Getting Alerts for Your Account
URI: GET /alert/alerts/{id}
| Parameter | Type | Description |
id | String | (Mandatory) The ID of the alert that you want to get. |
needMessage | Boolean | Indicates whether or not detailed alert message should be included in the response. Example – /alert/alerts/id?needMessage=true |
customColumns | String | Property or token values that should be displayed with alert details. customColumns=value1,value2,value3If you are referring to tokens, then URL encode the # symbol. Example – /alert/alerts/id?customColumns=%2523%2523system.collectorid%2523%2523,%2523%2523system.groups%2523%2523 |
fields | String | The response is filtered to include only the specified fields for each object. You can provide a list of properties separated by a comma. Example – /alert/alerts/id?fields=type,id,acked,severity |
Getting List of Alerts
You can use the following query parameters to manage the kind of data to include in the response and how it is formatted.
Note:
- The query parameters are not part of the resource path and should not be included while calculating LMv1 authentication signature.
- To request alerts for a specific device, device group, or service, you can consider using the alerts sub-resources for those resources.
URI: GET /alert/alerts
| Parameter | Type | Description |
customColumns | String | The property or token values that should be displayed with alert details. customColumns=value1,value2,value3If you are referring to tokens, then URL encode the # symbol. Example – /alert/alerts?customColumns=%2523%2523system.collectorid%2523%2523,%2523%2523system.groups%2523%2523 |
fields | String | The response is filtered to include only the specified fields for each object. You can provide a list of properties separated by a comma. Example – /alert/alerts?fields=type,id,acked,severity |
size | Integer | The number of results to display. A maximum of 1000 results can be requested in a GET call. By default, a list of 50 alert is returned if a value is not provided for this parameter. Example – /alert/alerts?size=40 |
offset | Integer | The number of result to offset the displayed result. Example – /alert/alerts?offset=25 |
filter | String | The response is filtered to include only the result that includes the specified value. You can substitute _all with a field name to filter only a specific field. Note that filtering is only available for id, type, acked, rule, chain, severity, cleared, sdted, startEpoch, monitorObjectName, monitorObjectGroups, resourceTemplateName, instanceName, and dataPointName. Operators include: Greater than or equals: >: Less than or equals: <: Greater than: > Less than: < Equals: : Does not equal: !: Includes: ~ Does not include: !~ Example – /alert/alerts?filter=_all~severity |
Note:
- The response ‘total’ will be a negative number if there are additional alerts that satisfy the request criteria that was not included in the request, and at least that number of alerts exist. For example, if you request for the first 500 alerts and you have 3000 alerts in your account, the response may include total=-1000 (that is, you have at least 1000 alerts, but you didn’t ask for them all).
- In the response, you can get two types of alerts, cleared alerts and active alerts.
Cleared alert – When cleared: “true” cleared alerts are displayed.
Active alert – When cleared: “false” active alerts are displayed. When there is no cleared filter or if value is not specified in the cleared filter, then by default, only active alerts are displayed.
To get both the cleared and active alerts in the response, add the filter cleared: “*”.
The following Python script requests for a list of alerts and value of ##externalticketid## for each alert.
#!/bin/env python

import requests
import json
import hashlib
import base64
import time
import hmac
import getpass

#Account Info: LogicMonitor recommends to NEVER hardcode the credentials. Instead, retrieve the values from a secure storage.
#Note: The below is provided for illustration purposes only.
AccessId = getpass.getpass("Enter your AccessId: ")
AccessKey = getpass.getpass("Enter your AccessKey: ")
Company = 'apiAccount'

#Request Info
#Request Info
httpVerb ='GET'
resourcePath = '/alert/alerts'
data=''
queryParams ='?customColumns=%2523%2523externalticketid%2523%2523'

#Construct URL
url = 'https://'+ Company +'.logicmonitor.com/santaba/rest' + resourcePath + queryParams

#Get current time in milliseconds
epoch = str(int(time.time() * 1000))

#Concatenate Request details
requestVars = httpVerb + epoch + data + resourcePath

#Construct signature
digest = hmac.new(
        AccessKey.encode('utf-8'),
        msg=requestVars.encode('utf-8'),
        digestmod=hashlib.sha256).hexdigest()
signature = base64.b64encode(digest.encode('utf-8')).decode('utf-8')

#Construct headers
auth = 'LMv1 ' + AccessId + ':' + str(signature) + ':' + epoch
headers = {'Content-Type':'application/json','Authorization':auth,'X-Version':3}

# Make request
response = requests.get(url, data=data, headers=headers)

# Print status and body of response
print('Response Status:',response.status_code)
print('Response Body:',response.content)Positive and Negative Total Value
When working with the alert/alerts v3 API endpoints, it is important to note the positive and negative total.
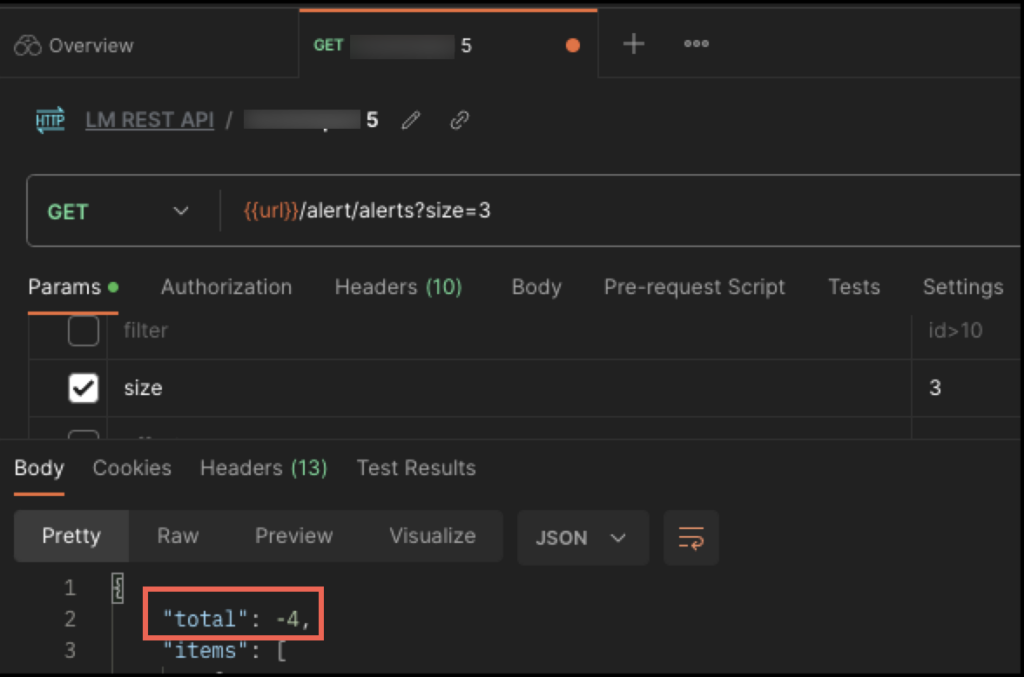
A negative total indicates that more results are yet to be displayed. Because the exact number of alerts is not known, based on the offset and size that you have specified, the total is calculated as Total + 1. As you continue to look for the next result, at one point in time (when the result is close to the total), the total number of alerts is known. At this time, the negative total turns positive. For example,
The total number of alerts is 155
| Page | Offset | Size | Total |
| 1 | 0 | 50 | -51 |
| 2 | 50 | 50 | -101 |
| 3 | 100 | 50 | -151 |
| 4 | 150 | 50 | 155 |
Observe that until the total number is not known, the total is negative. Once the total number is known, it becomes positive.
