Infrastructure Monitoring & Observability In One View
When every environment and team shares the same view, you can monitor, troubleshoot, and optimize with clarity, resilience, and speed no matter how complex your infrastructure.
Forrester Total Economic Impact™ study finds Edwin AI delivered a 313% ROI for composite organization.
Proactively manage modern hybrid environments with predictive insights, intelligent automation, and full-stack observability.
Explore solutionsExplore our resource library for IT pros. Get expert guides, observability strategies, and real-world insights to power smarter, AI-driven operations.
Explore resources
Our observability platform proactively delivers the insights and automation CIOs need to accelerate innovation.
About LogicMonitor
When every environment and team shares the same view, you can monitor, troubleshoot, and optimize with clarity, resilience, and speed no matter how complex your infrastructure.


LogicMonitor Envision unifies metrics, logs, events, and traces in one intelligent platform, so your teams can detect issues faster, resolve them smarter, and operate with clarity at scale.
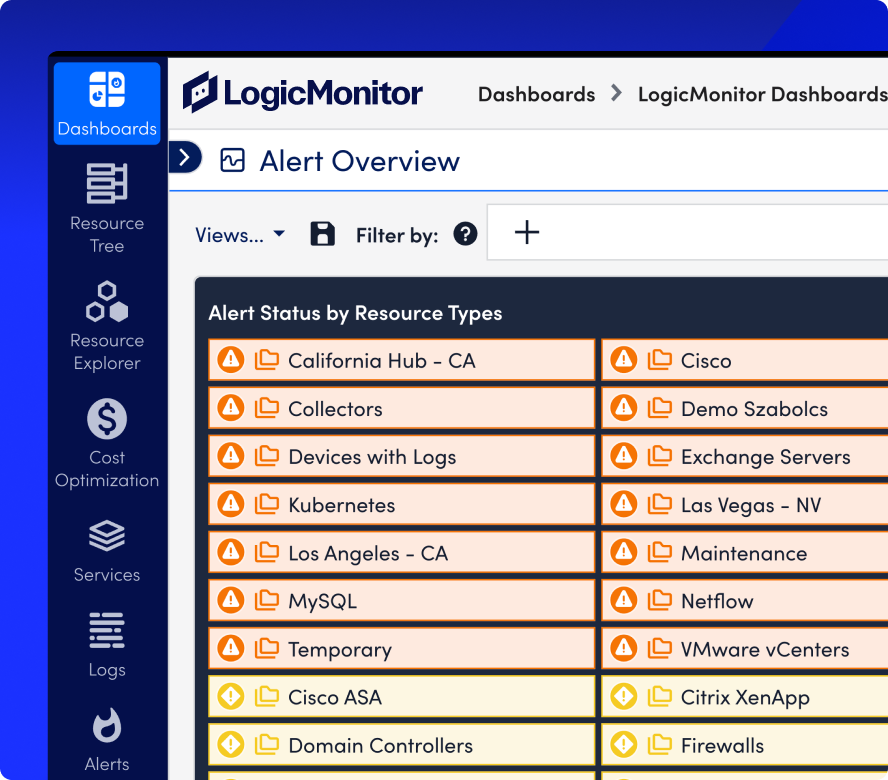
From data centers to distributed clouds, explore LM Envision’s purpose-built solutions designed to deliver real-time visibility, intelligent alerting, and scale-ready observability for every part of your infrastructure.
Eliminate blind spots across routers, switches, and cloud networks with real-time visibility into traffic, interfaces, and device health.
Monitor the health and performance of physical and virtual servers across your data centers and cloud environments.
Gain visibility into the tools, tunnels, and apps that power hybrid and remote work—no matter where users connect from.
Get full-stack observability across virtual machines and hypervisors—from vSphere and Hyper-V to Nutanix and more.
Monitor SD-WAN tunnels, edge devices, and link health across multi-vendor networks with performance context built in.
Track database health, query speed, and capacity trends to keep applications responsive and scalable.
Monitor IOPS, latency, and storage capacity across cloud and on-prem arrays to prevent bottlenecks and scale efficiently.
Stay ahead of risk with real-time alerts, full config history, and performance correlation across your infrastructure.
LM Envision is built for hybrid complexity—agentless, automated, and designed to deliver full-stack insights without the noise.
Onboard infrastructure in minutes with lightweight, agentless collectors and automated discovery—no scripting or manual config required.
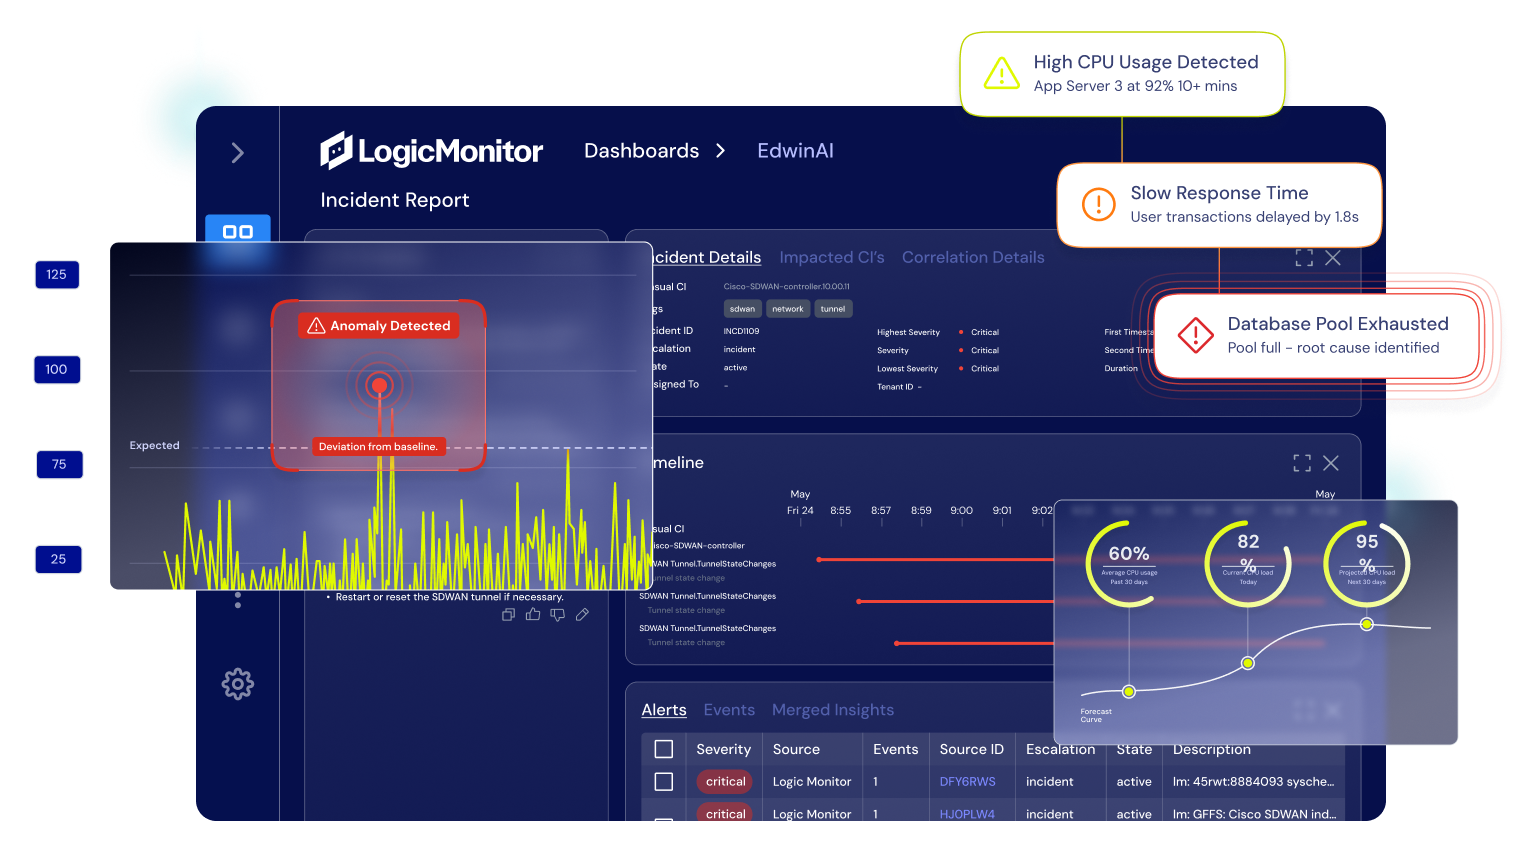
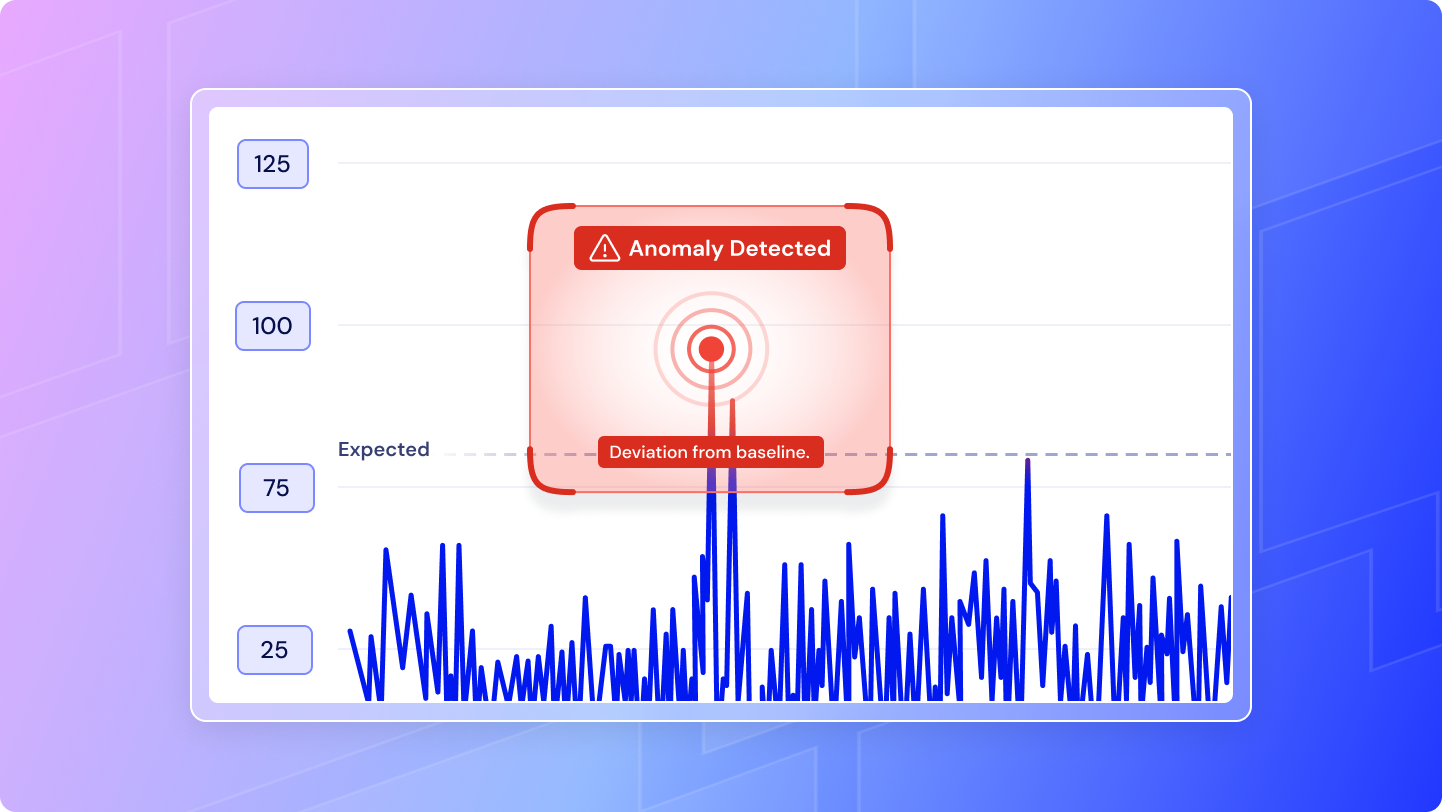
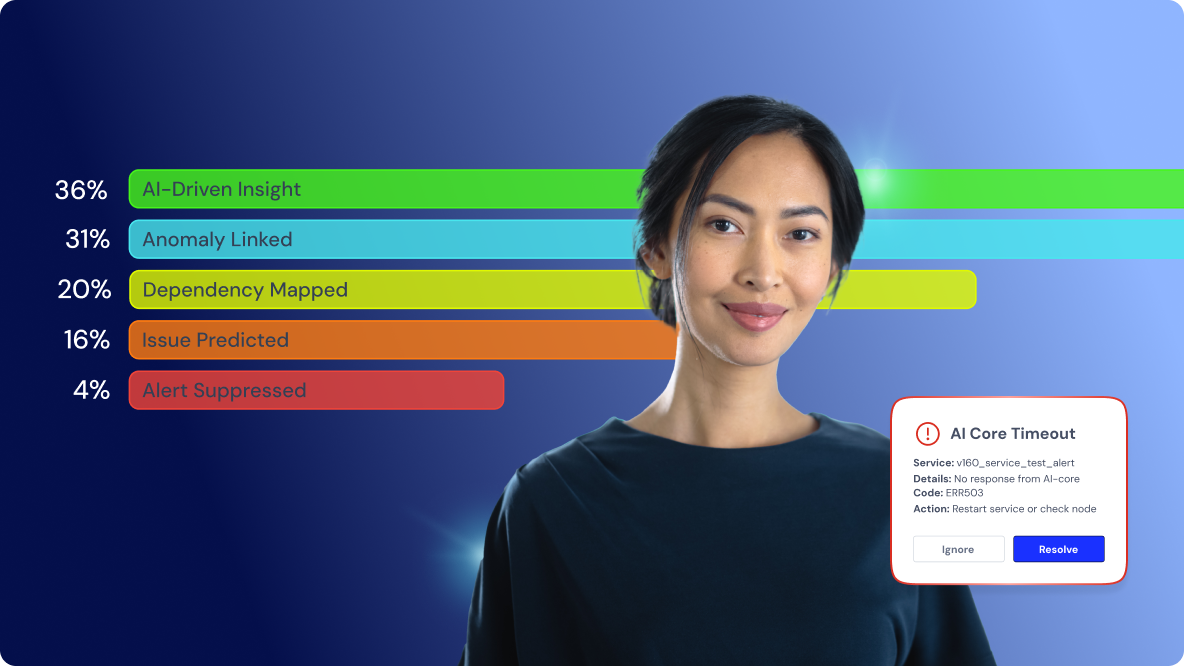
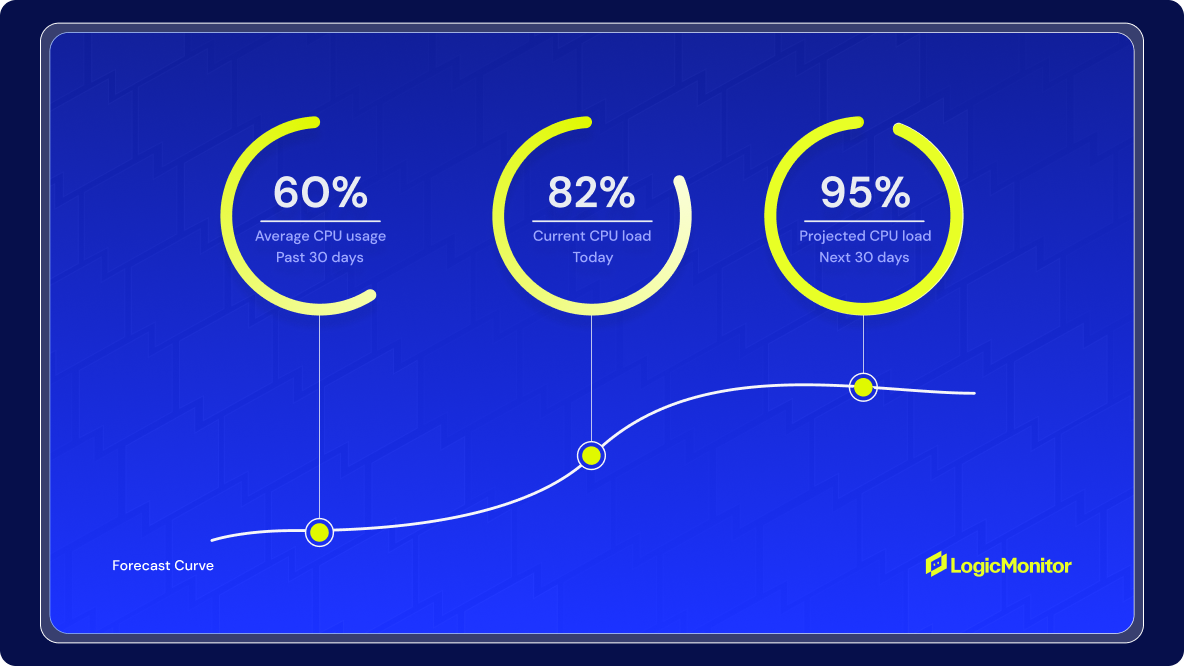
Identify risks with AI-powered anomaly detection, dynamic thresholds, and usage forecasting, so you can act before performance degrades.
Consolidate visibility across cloud, on-prem, and hybrid environments with 3,000+ integrations and protocol support.
Reduce noise with intelligent alerting that understands your environment only surfacing what’s urgent and actionable.
Map relationships between infrastructure components to accelerate root cause analysis and identify trends over time.
Free up teams to focus on modernization with automated monitoring, intelligent workflows, and enterprise extensibility.

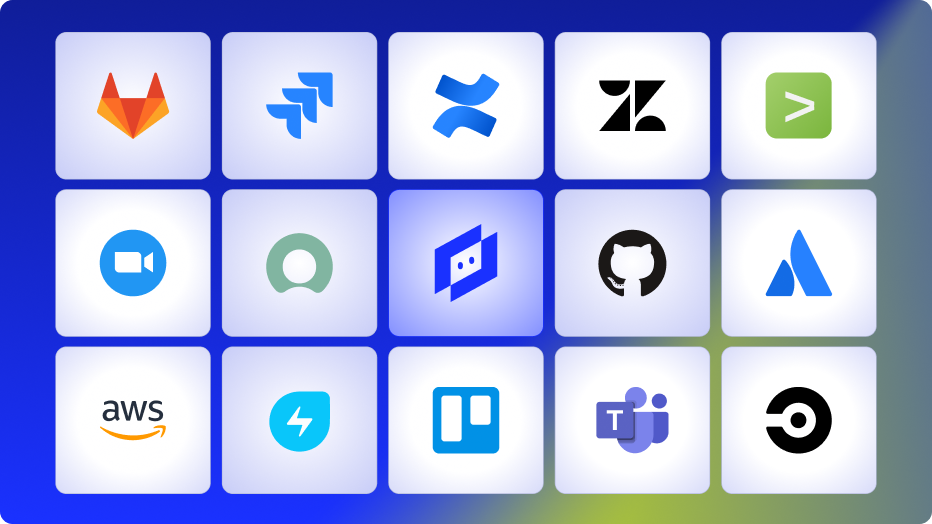
Easily connect LM Envision with 3,000+ technologies out of the box, spanning infrastructure, cloud, networking, and applications. From ITSM to CI/CD, you can monitor, automate, and escalate using the systems your teams already rely on.
100%
collector-based and API-friendly
3,000+
integrations and counting
AI Agent for ITOps
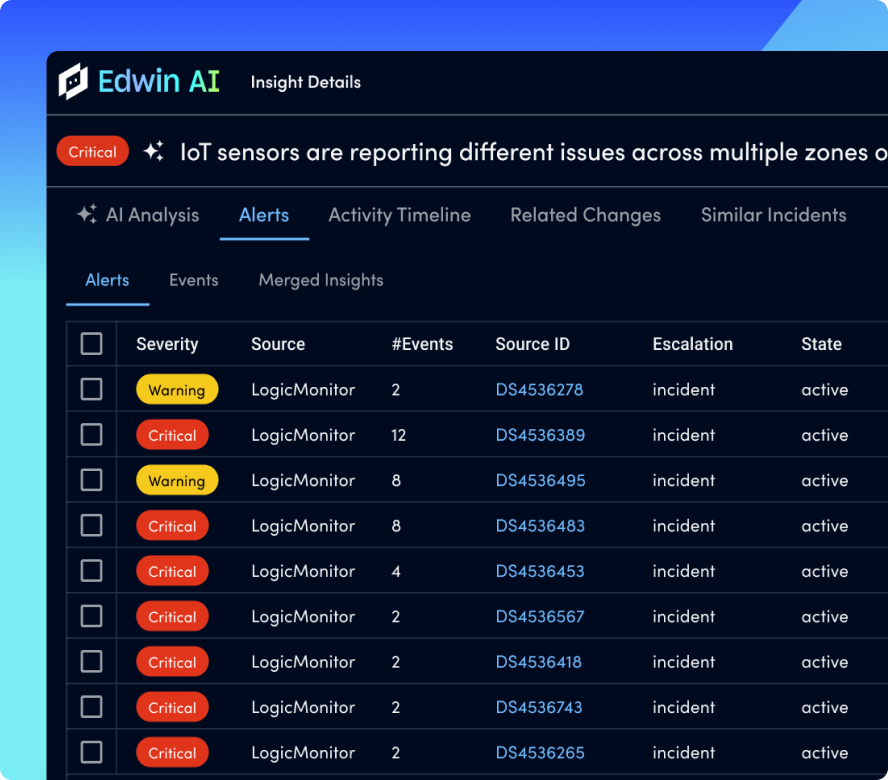
Edwin AI enhances every integration—correlating alerts across tools, filtering out noise, and highlighting what actually needs your attention in plain language.
67%
ITSM incident reduction
88%
noise reduction
BY THE NUMBERS
Try LM Envision free and get unified observability across every environment, so your teams can resolve issues faster, reduce noise, and scale with confidence.
