


Storage Monitoring for Fast, Scalable, Always-on Infrastructure
Keep systems fast, data available, and storage performance predictable with full-stack observability across SAN, NAS, and cloud. Catch slowdowns early, avoid storage-related outages, and optimize capacity before it becomes a problem.
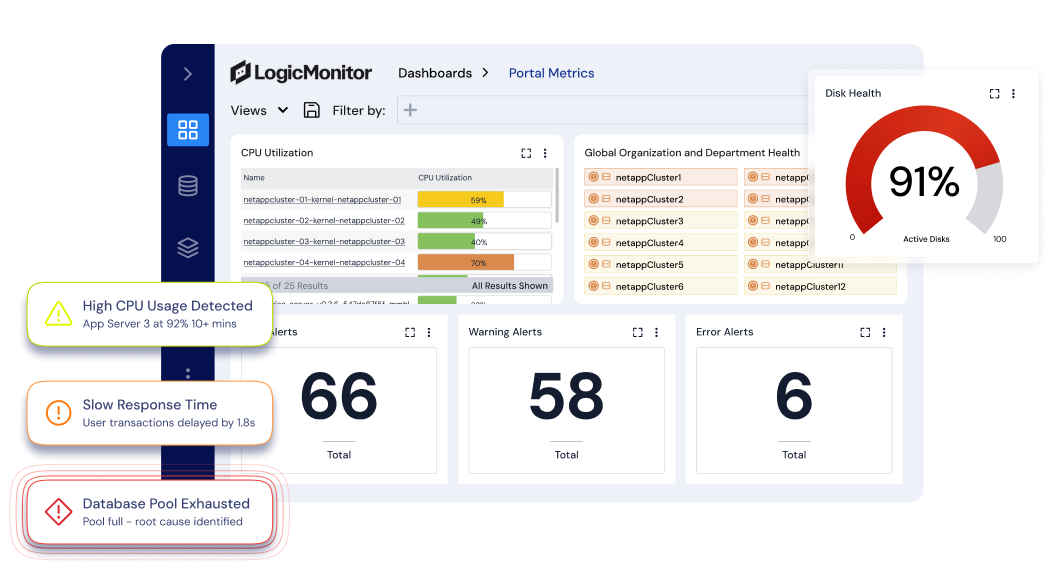
When your team can see storage performance in real time, they prevent outages, plan smarter, and keep systems running fast even as data demands grow.
Catch performance issues and capacity risks early, so you avoid disruptions, not just react to them.
Understand usage trends and storage growth so you can right-size investments and avoid surprise upgrades.
Prevent slowdowns and bottlenecks by ensuring storage stays responsive even during peak demand.
Automate visibility and reduce manual effort so your team can focus on strategy, not triaging siloed tools.
Get a single view across cloud, hyperconverged, and legacy arrays, so nothing slips through the cracks.
Give stakeholders one clear view of storage health and impact, so issues are resolved faster and decisions are made with full context.
Observability powered by LM Envision and Edwin AI
Visibility, performance, and planning all in one platform
From automated discovery to intelligent forecasting, LM Envision delivers the capabilities teams need to ensure uptime, right-size capacity, and maintain performance across hybrid storage systems.
Monitor storage systems with zero manual effort
Start monitoring enterprise storage platforms in minutes—no agents, scripts, or vendor-specific tooling required.
-
Auto-discover arrays, clusters, and drives Detect devices from NetApp, Dell, Pure Storage, HPE, Cisco, and more with minimal configuration.
-
Onboard cloud storage with ease Gain visibility into AWS, Azure, and GCP storage services alongside on-prem systems.
Surface Risks Before They Impact Uptime
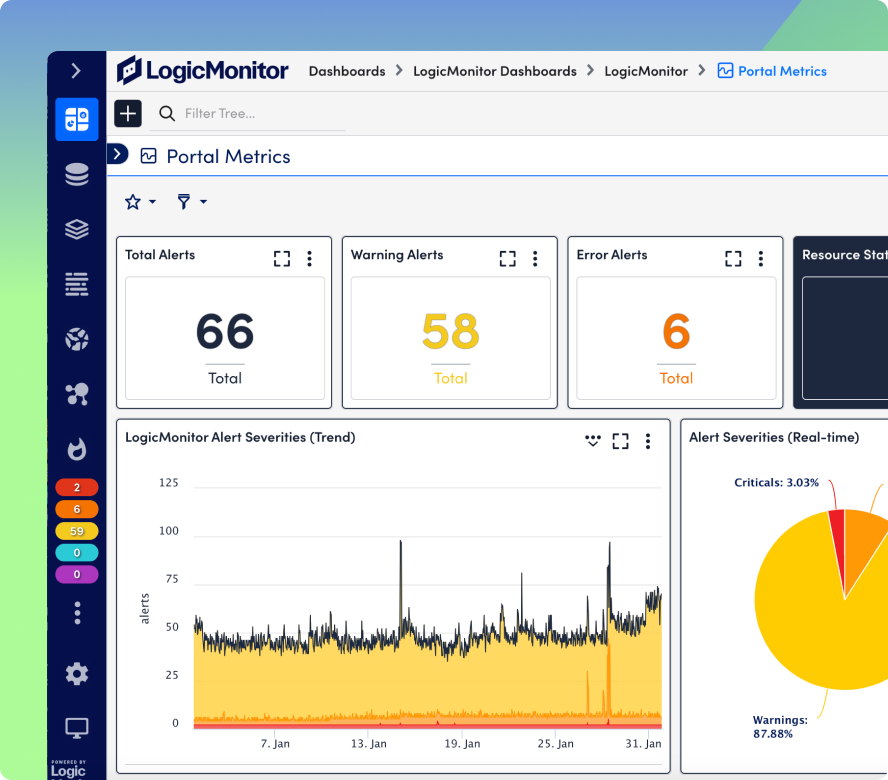
Prevent service disruptions by identifying anomalies and saturation risks across your storage infrastructure.
-
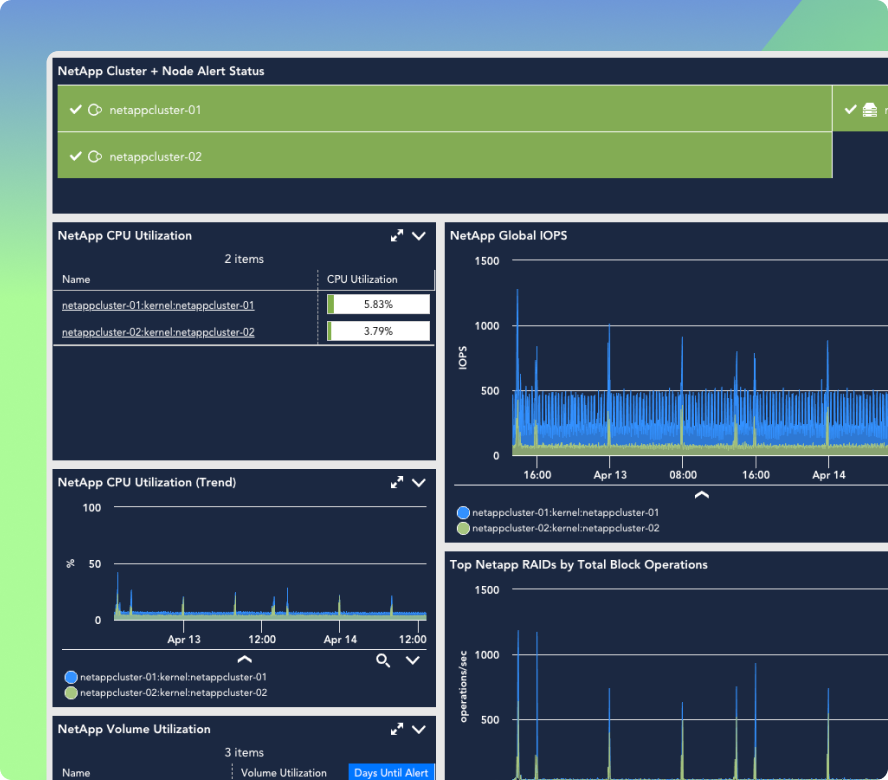
Track usage, IOPS, and latency in real time Stay ahead of bottlenecks with proactive performance visibility across volumes, LUNs, and RAID groups.
-
Detect early warning signs automatically Let LM Envision alert you to performance drift and capacity anomalies before SLAs are breached.
Plan ahead with confidence
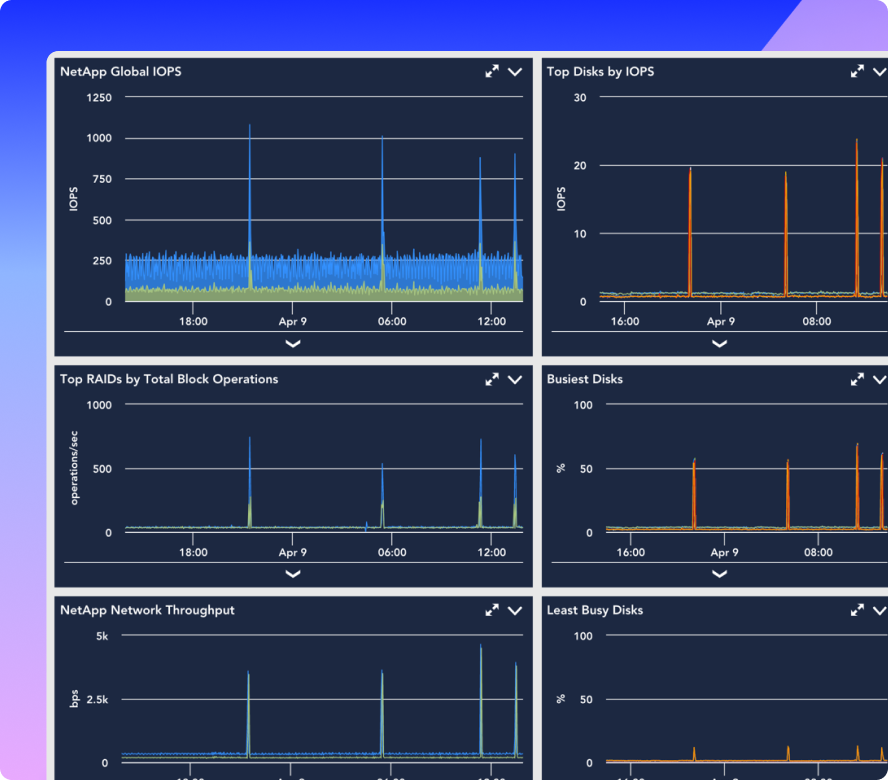
Use historical trends and predictive analytics to guide infrastructure investments and avoid surprise costs.
-
Forecast future storage needs Plan upgrades and scaling based on actual growth curves, not gut feel.
-
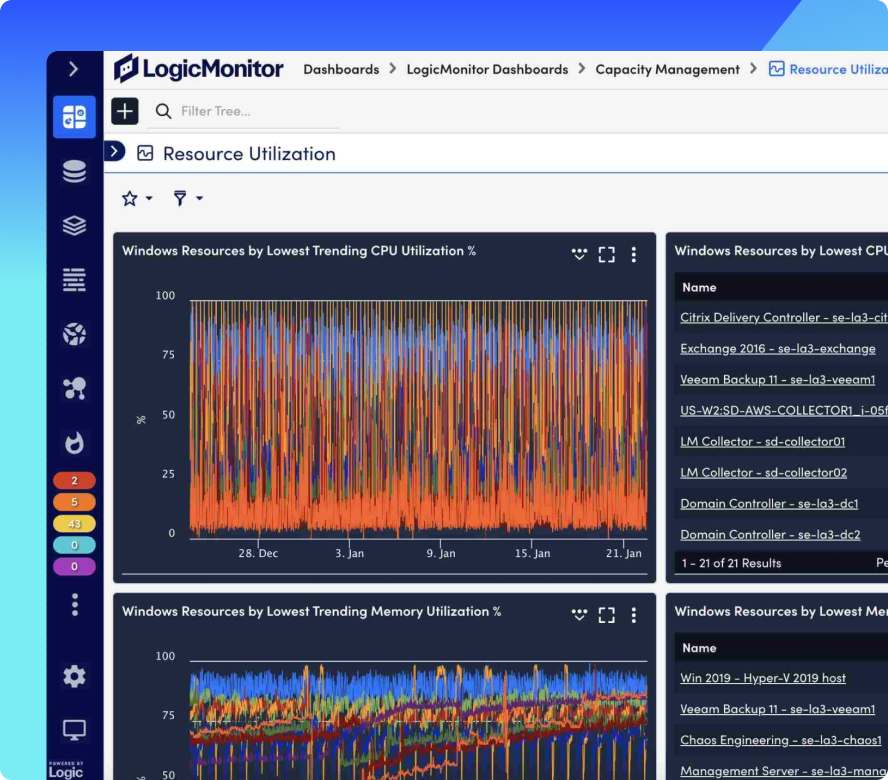
isualize long-term capacity trends Spot abnormal consumption spikes and align usage with budget and strategy.
Connect storage to application health
Understand how storage impacts service delivery by correlating infrastructure metrics with app and network performance.
-
See the full-stack impact of storage slowdowns Identify whether performance issues originate at the array, controller, or elsewhere in the stack.
-
Unify storage and app monitoring Investigate storage health in the context of business-critical applications and end-user experience.
Share the Right Data With the Right Teams
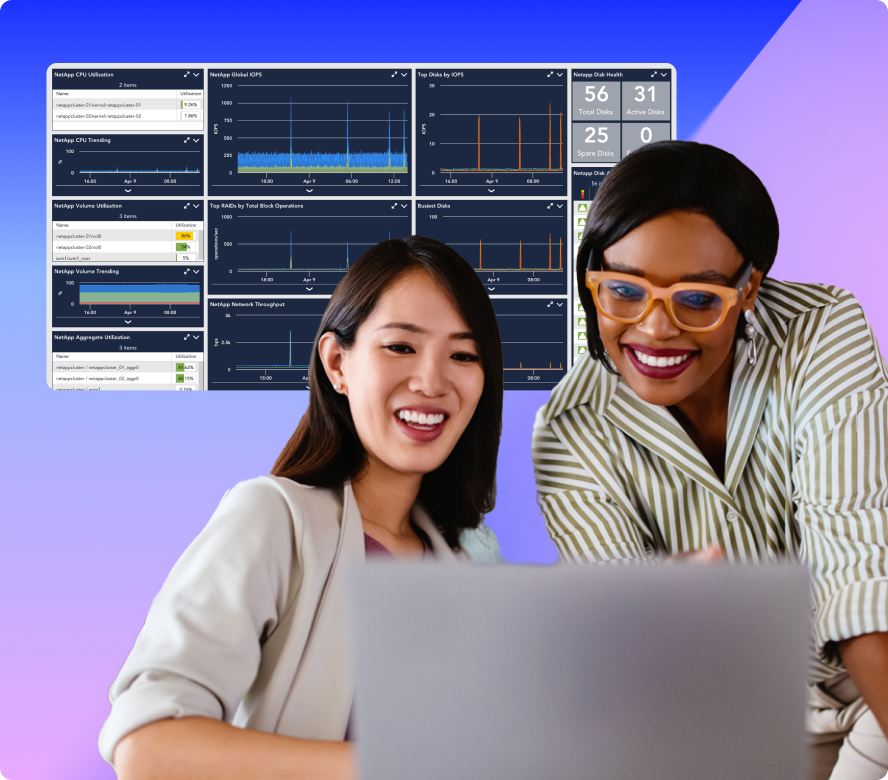
Equip IT, engineering, and ops teams with tailored dashboards and alerts that surface only what they need.
-
Role-specific dashboards and reports Provide stakeholders with actionable, relevant metrics in formats they can use.
-
Route alerts based on scope and severity Reduce noise and ensure the right teams are looped in at the right time.
Integrations
Built for NetApp, Dell, Pure Storage, and more
LM Envision supports out-of-the-box integrations with top enterprise storage platforms, including NetApp, Dell Technologies, HPE, Pure Storage, Cisco, and more. Monitor cloud storage from AWS, Azure, and GCP in the same platform without additional tools, agents, or complexity.
100%
collector-based and API-friendly
3,000+
integrations and counting
AI AGENT FOR ITOPS
Edwin AI: AI that turns storage signals into clear action
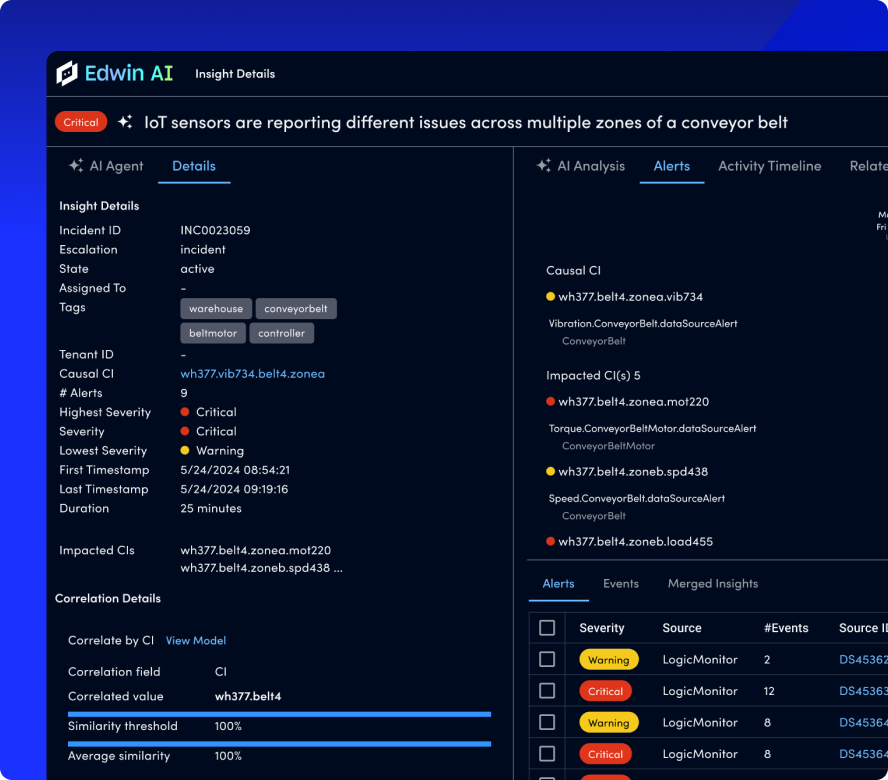
Edwin AI helps you detect anomalies, predict saturation, and summarize incidents in plain language, so your teams can troubleshoot faster and plan smarter. From tracking disk latency to uncovering usage trends across arrays, Edwin brings context and clarity to every alert.
67%
ITSM incident reduction
88%
noise reduction
“Edwin AI cut noise by 90% & ITSM incidents by 76%, enabling better customer service.”
“The single pane of glass across all of our regions enables us to act more proactively.”
“Edwin AI delivered value within an hour of implementation.”
“Capital Group has 1,000+ alerts/ day. LogicMonitor will eliminate that noise.”
“LogicMonitor is a valuable partner, constantly innovating and adapting to our business needs.”
BY THE NUMBERS
Storage monitoring that keeps performance sharp and surprises rare
GET ANSWERS
FAQs
Get the answers to the top storage monitoring questions.
Which storage vendors does LogicMonitor support out of the box?
LM Envision offers built-in support for leading storage platforms, including NetApp, Dell EMC, HPE, Pure Storage, Cisco HyperFlex, Nutanix, and VMware vSAN—plus cloud providers like AWS, Azure, and GCP. No custom development or scripting is required to start monitoring.
Do I need to install agents or manually configure devices to monitor storage?
No. LM Envision uses agentless collection and auto-discovery to detect and begin monitoring storage systems quickly. In most cases, all you need is a hostname or IP address—no manual configuration, scripts, or local software required.
Can I monitor both traditional and cloud-based storage in one platform?
Yes. LM Envision provides a unified view of on-premises, hyper-converged, and cloud-based storage environments. You can monitor usage, performance, capacity, and health across your entire storage infrastructure in a single dashboard.
How does LogicMonitor help with capacity planning?
LM Envision tracks usage over time and applies forecasting to help you predict when you’ll hit capacity limits. This enables smarter budgeting, avoids surprise outages, and supports long-term storage optimization strategies.
Will I get alerted if performance starts to degrade or capacity trends change?
Absolutely. LM Envision includes dynamic thresholds, anomaly detection, and intelligent alerting that can warn you of performance drift, capacity surges, or critical degradation before it becomes a service-impacting issue.
Can LogicMonitor correlate storage issues with application or network performance?
Yes. LM Envision gives you full-stack visibility across infrastructure, including storage, servers, networks, and applications. This lets you trace performance issues to their root cause even when they originate outside the storage layer.
