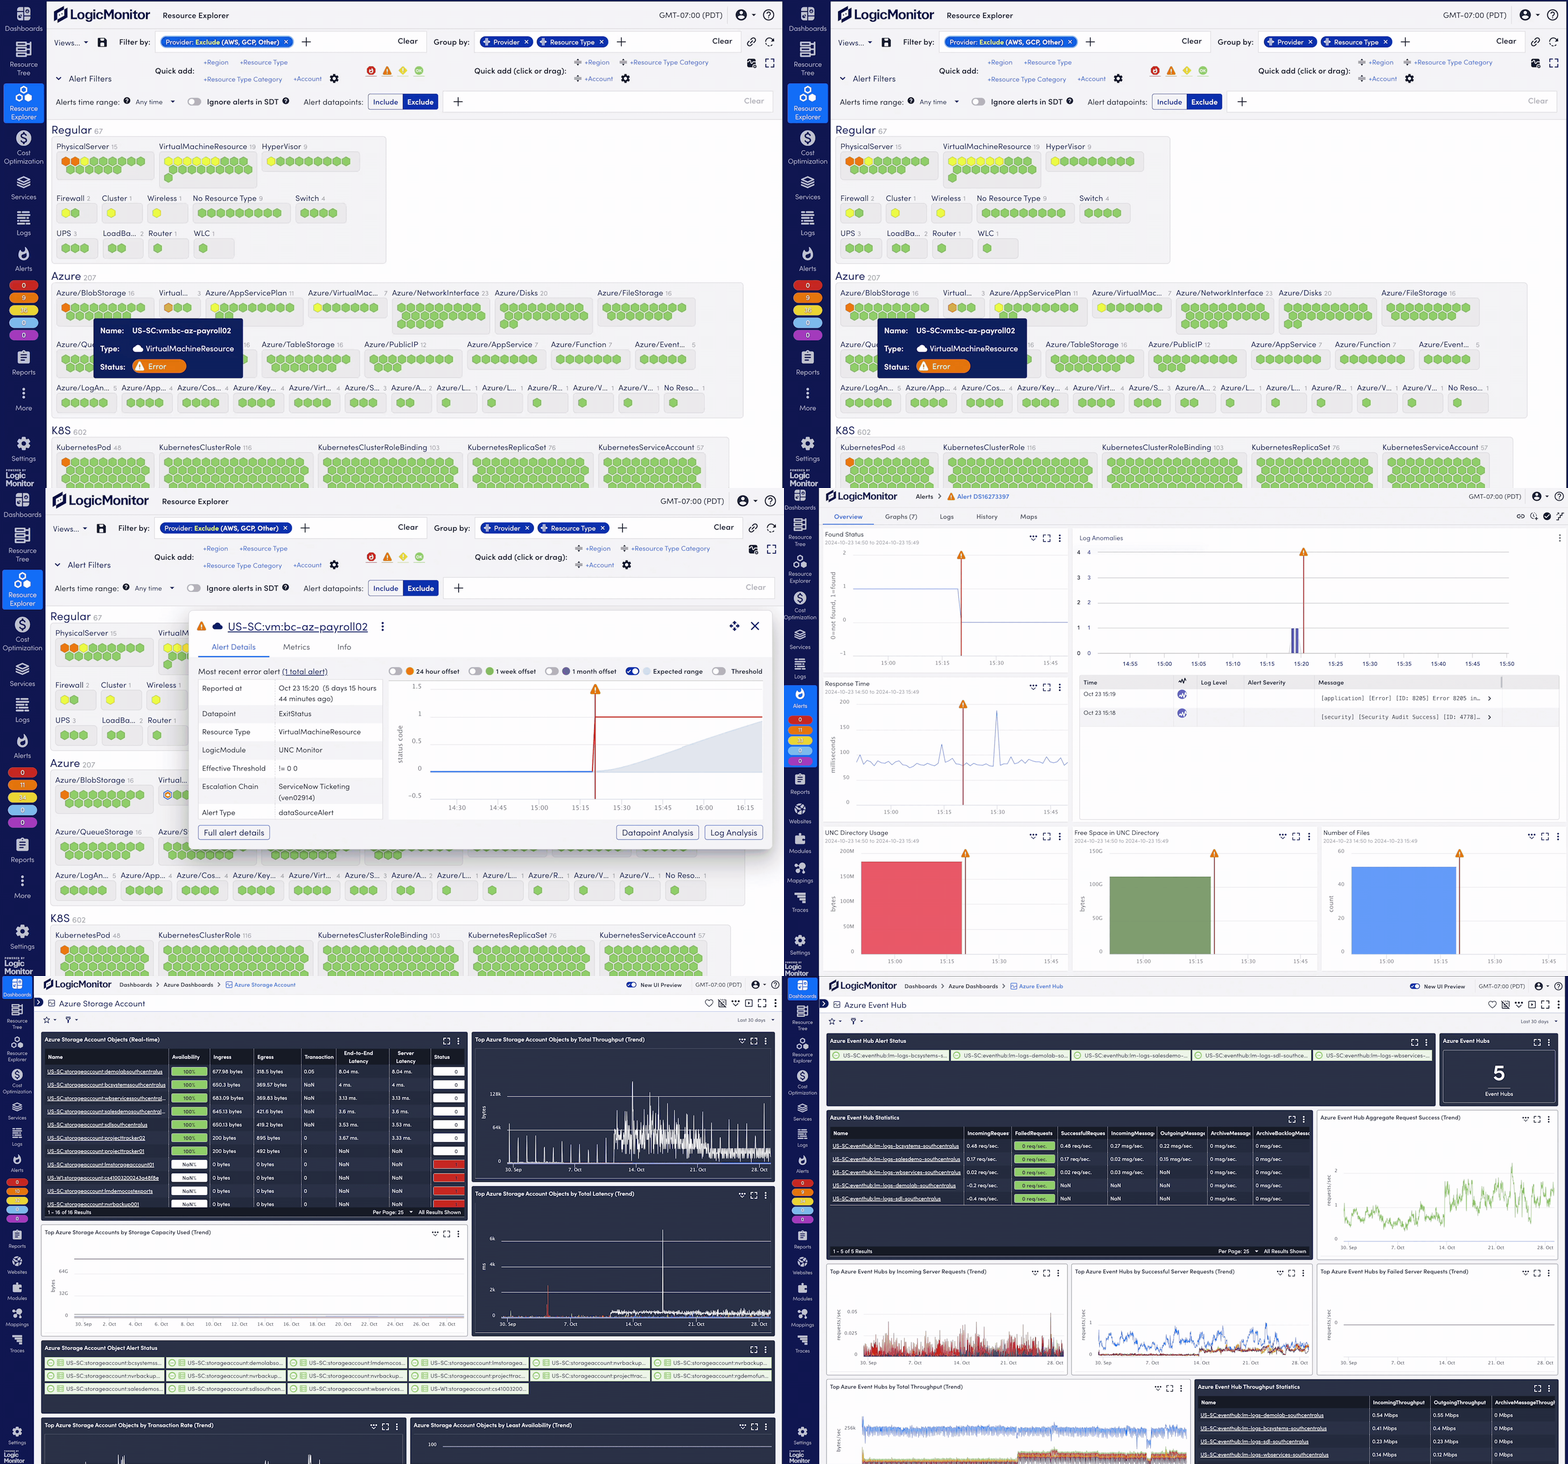
Clarity for Azure Monitoring in Hybrid Environments
Automatically discover all your Azure resources, align metrics across on-prem and multi-cloud, and get smart, AI-driven alerts to quickly solve problems and keep your business running.
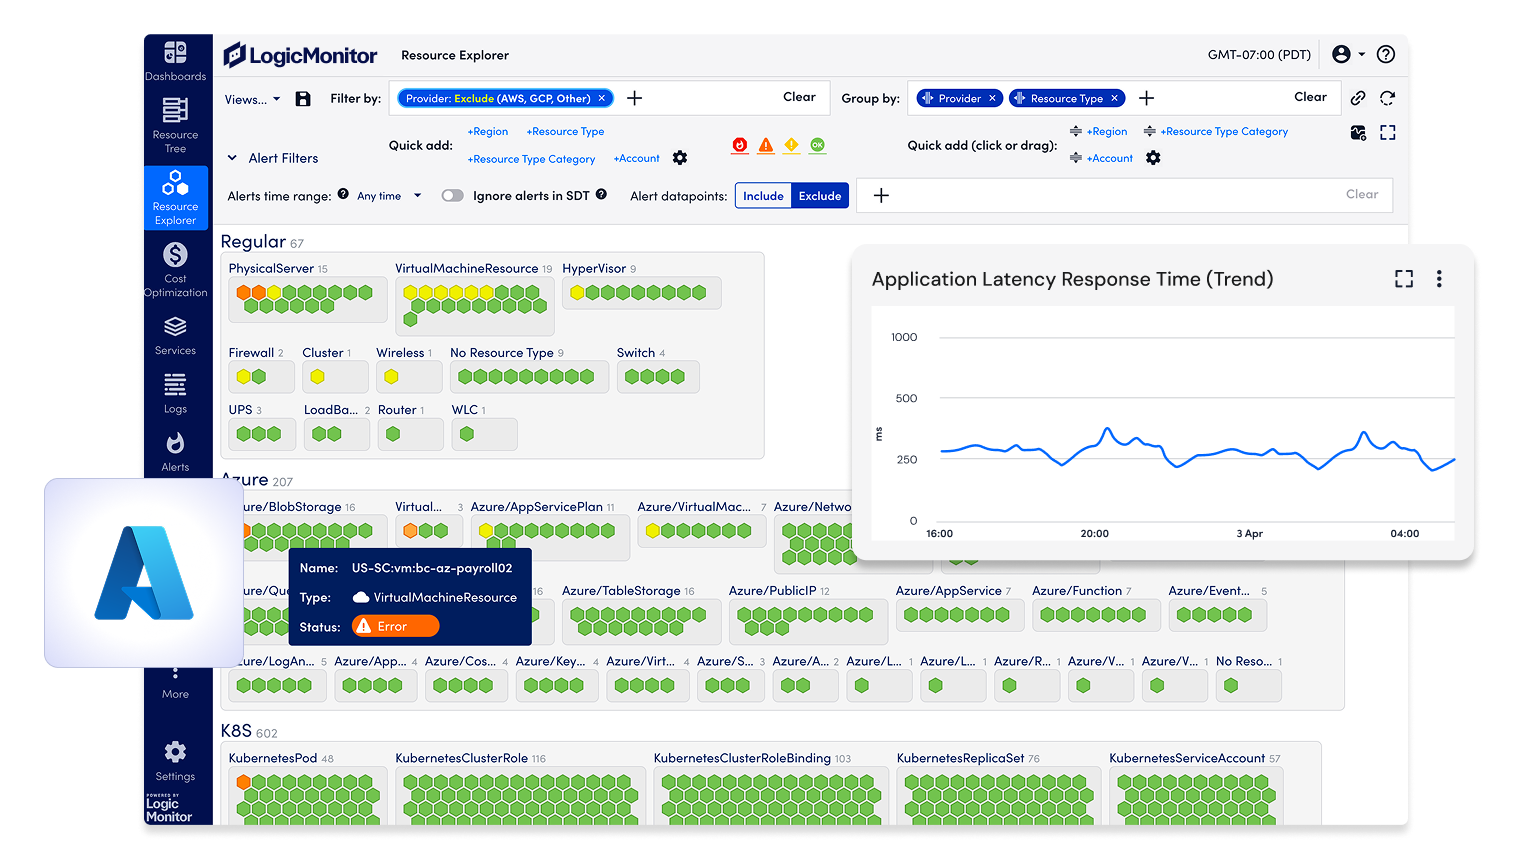
Automatically discover all your Azure resources, align metrics across on-prem and multi-cloud, and get smart, AI-driven alerts to quickly solve problems and keep your business running.

View Azure investments alongside on-prem and multi-cloud resources in a single view and say goodbye to context switching.
Migrate and refactor with confidence as you watch performance metrics in real-time and avoid the headaches of unexpected service disruptions.
Stop wasting time on false positives with intelligent alerting that filters out the noise so your team can act faster and stay productive.
Spot anomalies early, keeping downtime at bay and giving you confidence in your SLA commitments.
Real-time resource usage data and tailored recommendations help you find and fix waste without affecting performance.
Map alerts, metrics, and services to the right teams automatically, so ownership is clear, handoffs are faster, and resolution never stalls.
From Azure VMs to AKS, LM Envision connects to Azure Monitor and auto-discovers resources to monitor performance, detect anomalies, and surface meaningful alerts across every service, region, and hybrid environment.
Map every VM, function, database, and more without deep technical expertise.
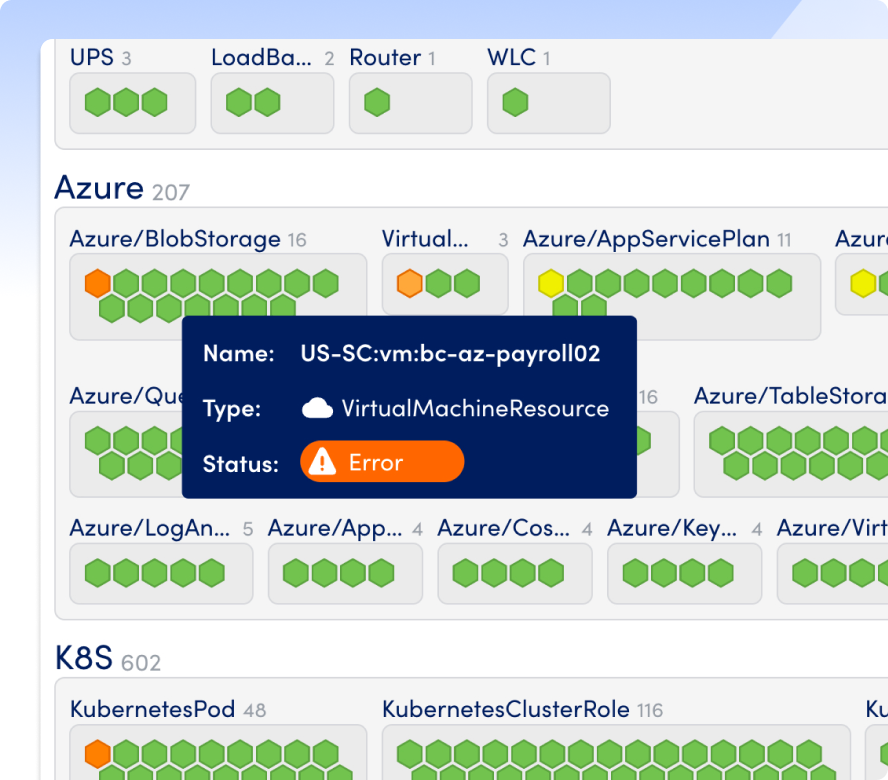
See Azure alongside on-prem and other clouds with clear interactive visuals.
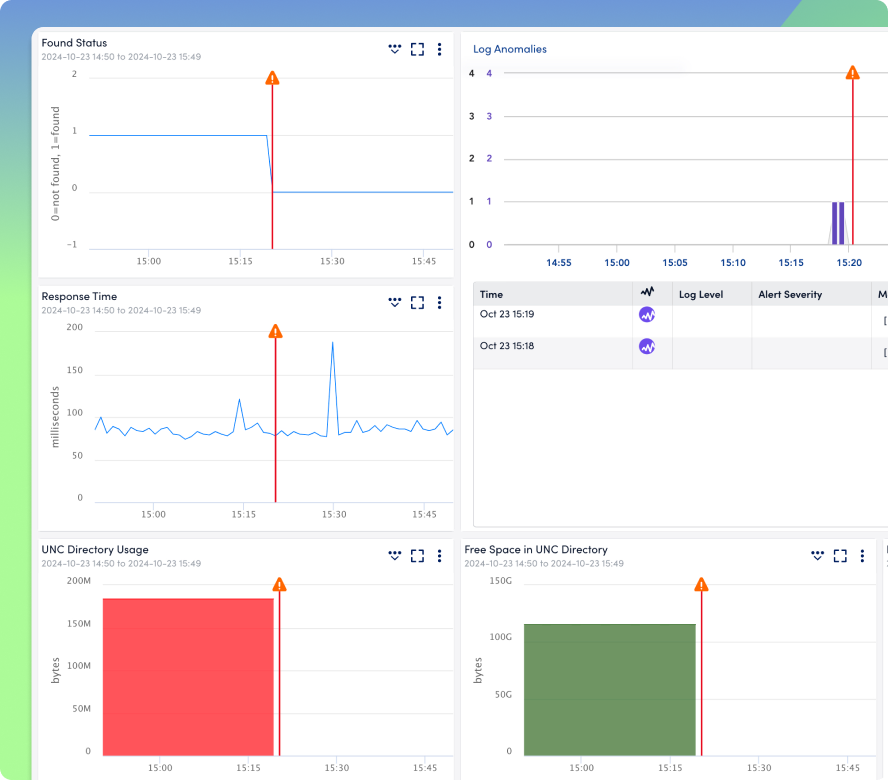
Noise-reduction that actually works—our alert reduction technology learns your environment so you only get pings that matter.
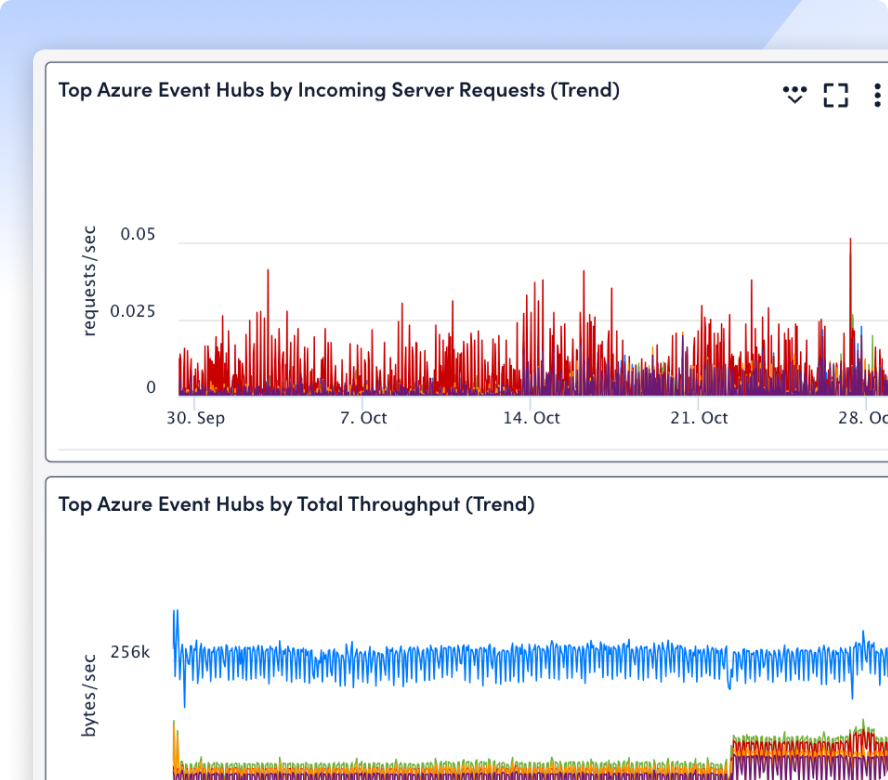
Jump straight from an alert to the root cause—no hunting through metrics, events, and logs.
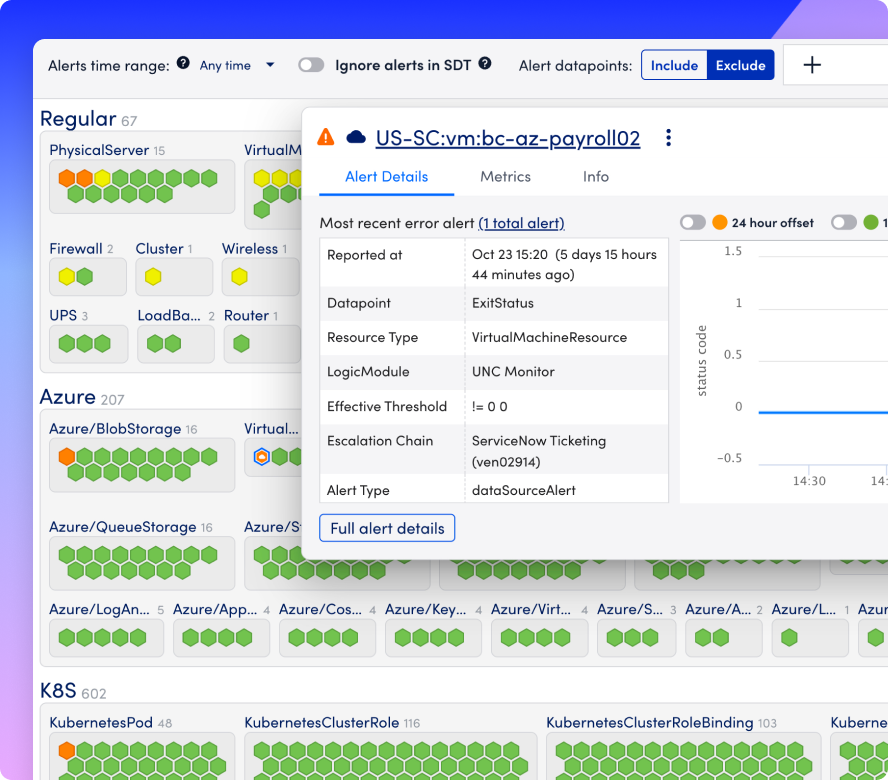
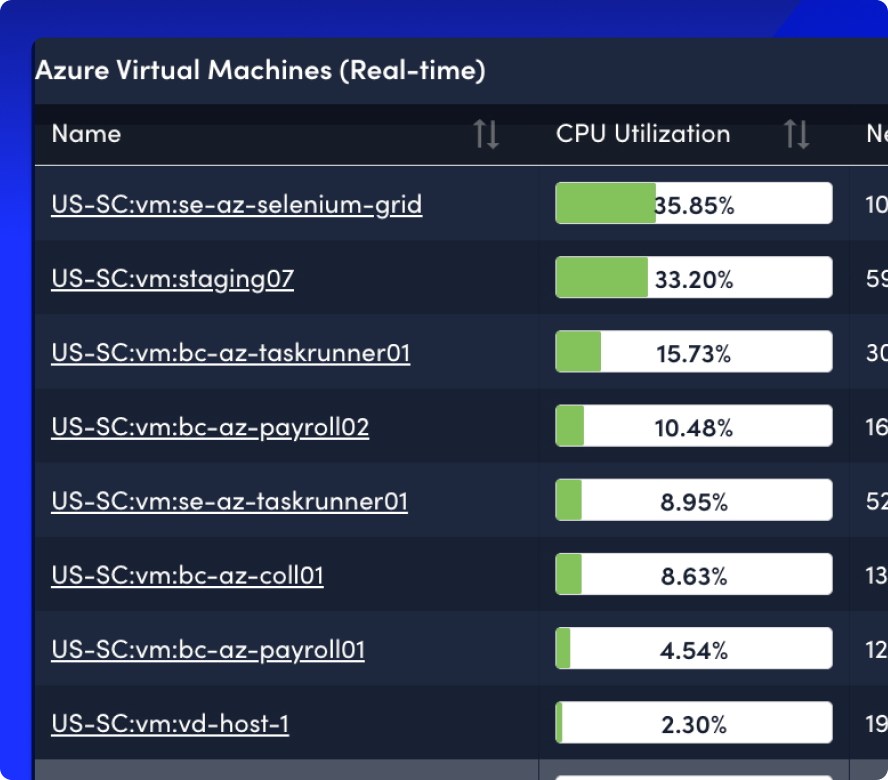
Keep cloud spend in check with real-time usage data and customized recommendations.
Integrations
Jump straight into monitoring with ready-made connectors for everything from Azure VMs and Storage Accounts, to Azure Cognitive Services and Kubernetes Services. Zero scripting needed.
60+
Azure services covered
<5 mins
average setup time
AI AGENT FOR ITOPS
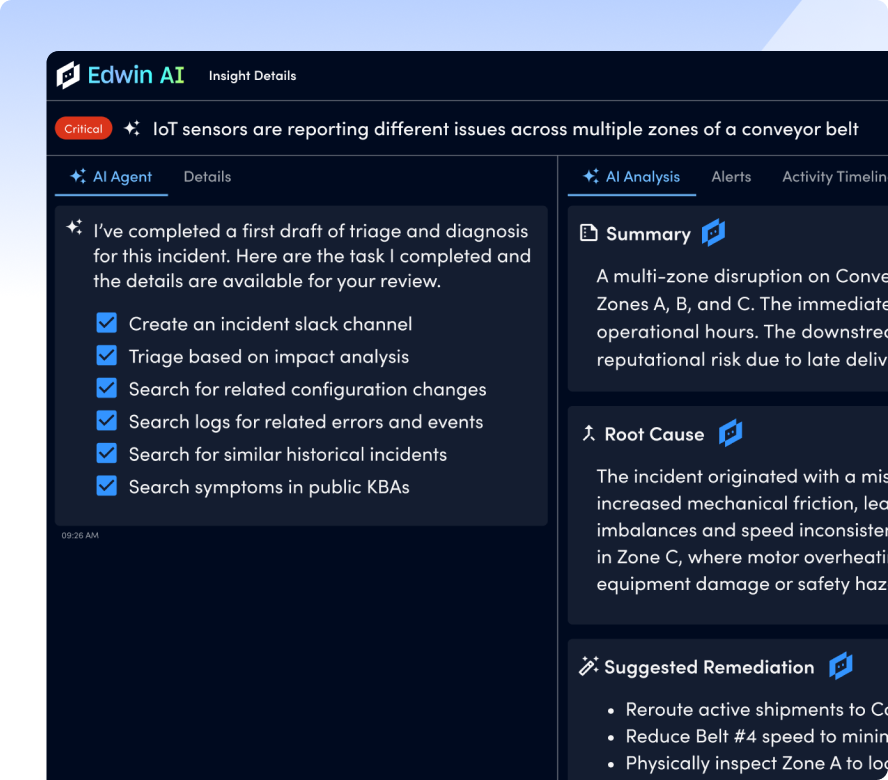
Ask Edwin about any Azure metric, anomaly, or log and get instant, human-readable answers. No more digging through dashboards or tickets.
67%
ITSM incident reduction
88%
noise reduction
BY THE NUMBERS
GET ANSWERS
Get the answers to the top Azure monitoring questions.
Most customers see their first VM and database pop into LM Envision within minutes of connecting their subscription. No scripts, no tagging.
Over 60 services, including VMs, App Services, Functions, Cosmos DB, Event Hubs, Kubernetes, SQL Databases, and more.
Our AI learns your baseline usage patterns and surfaces deviations that matter, cutting false positives by up to 80%.
Learn moreAbsolutely. Dashboards and alerts span Azure, AWS, GCP, network devices, and your data center, so you can troubleshoot end-to-end without jumping portals.
We encrypt data in transit and at rest, follow industry best practices (SOC 2, GDPR), and let you choose regional data residency.
