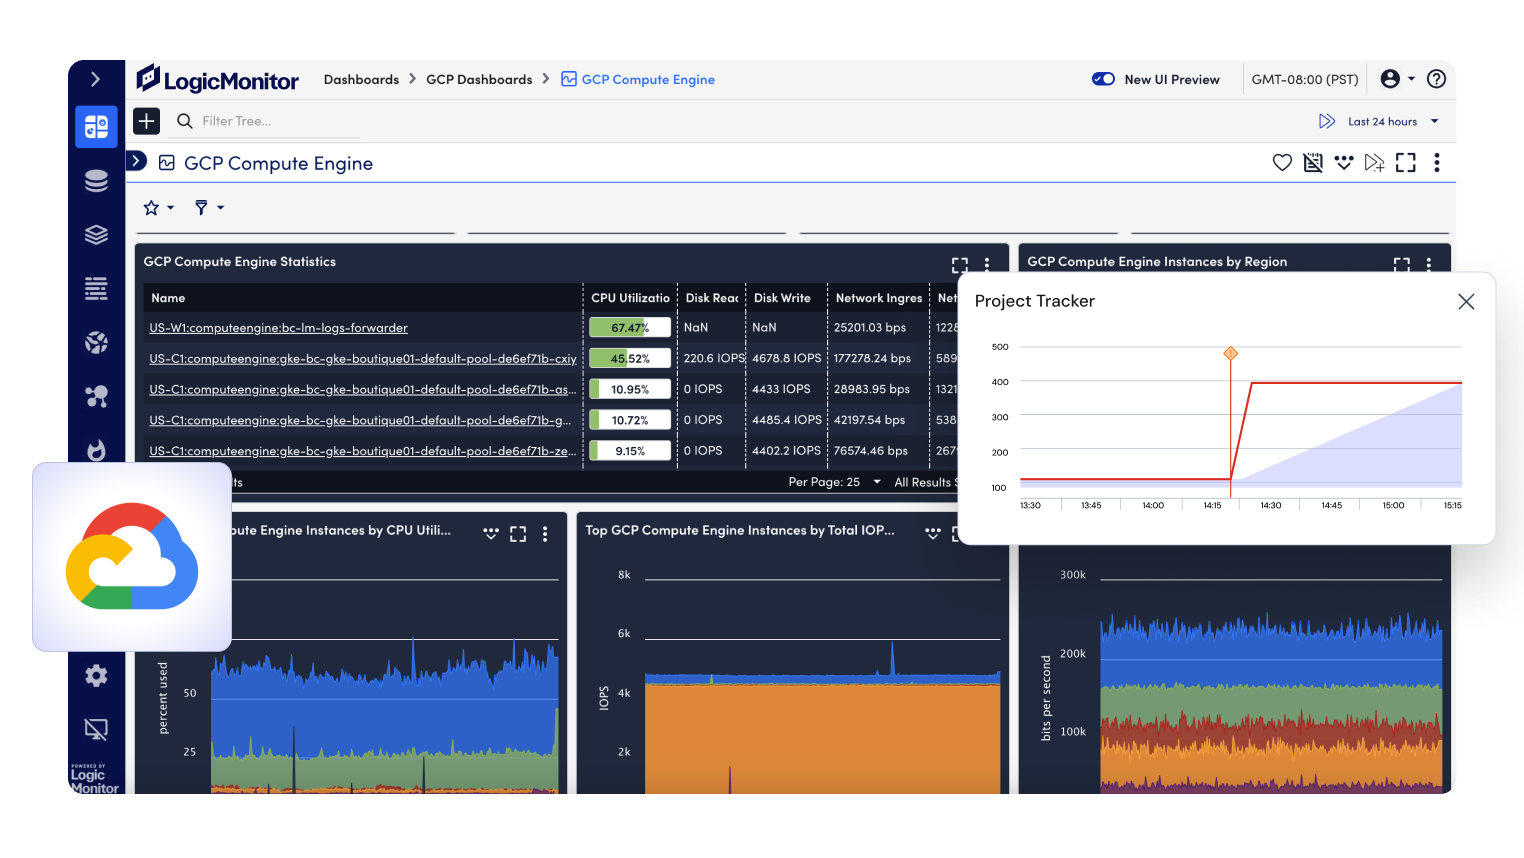
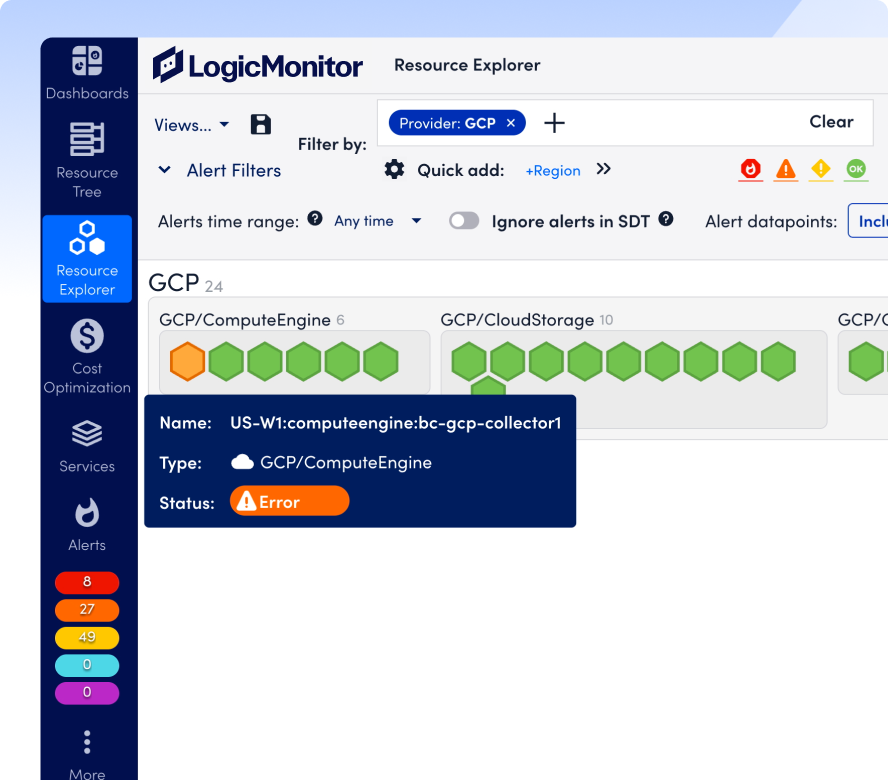
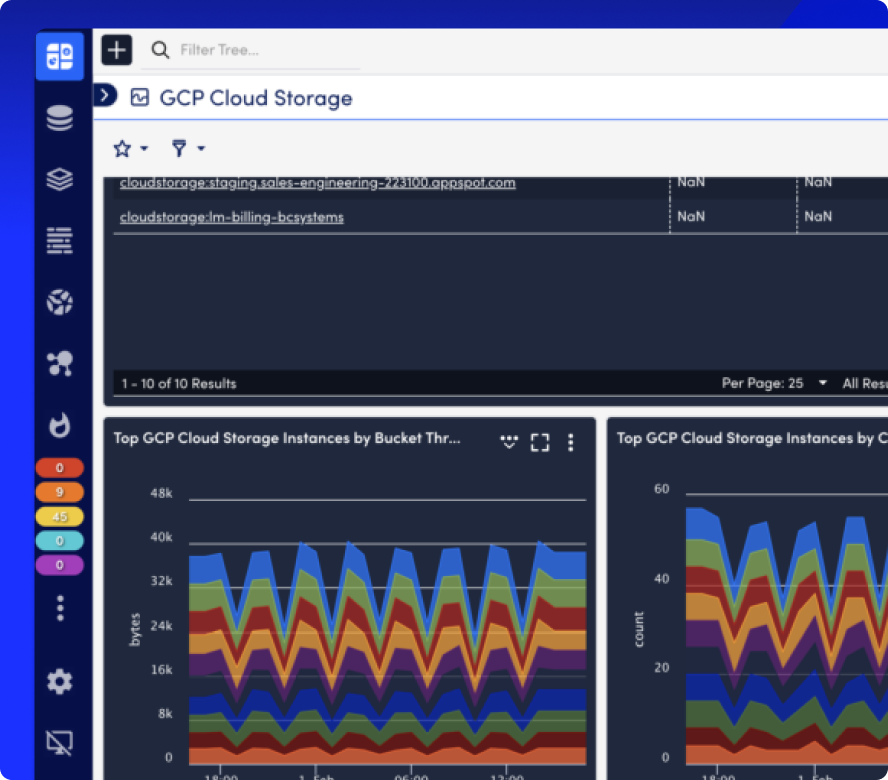
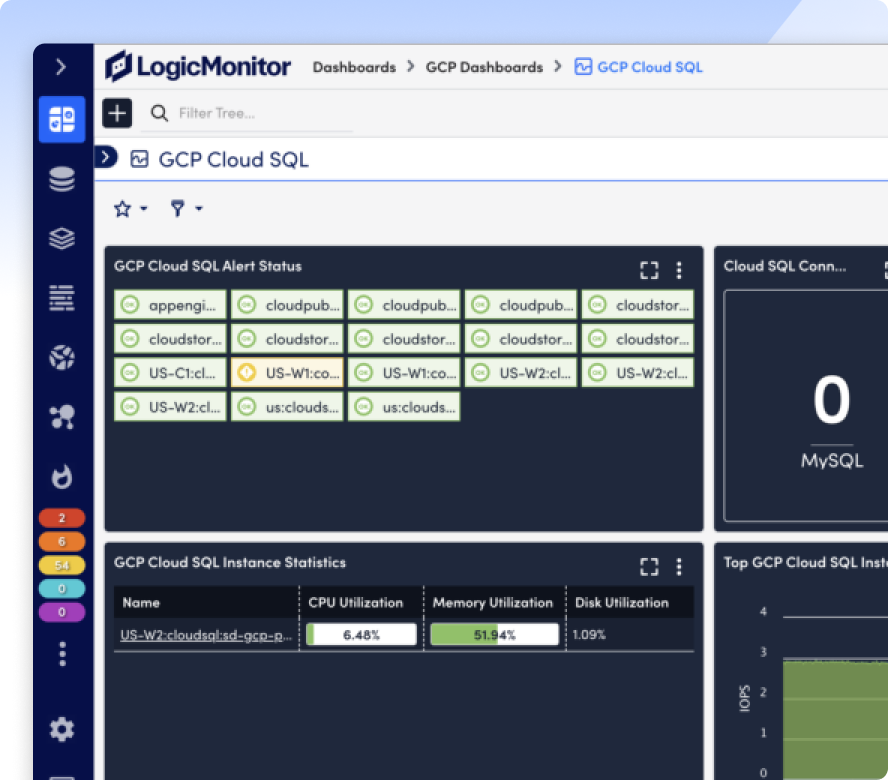
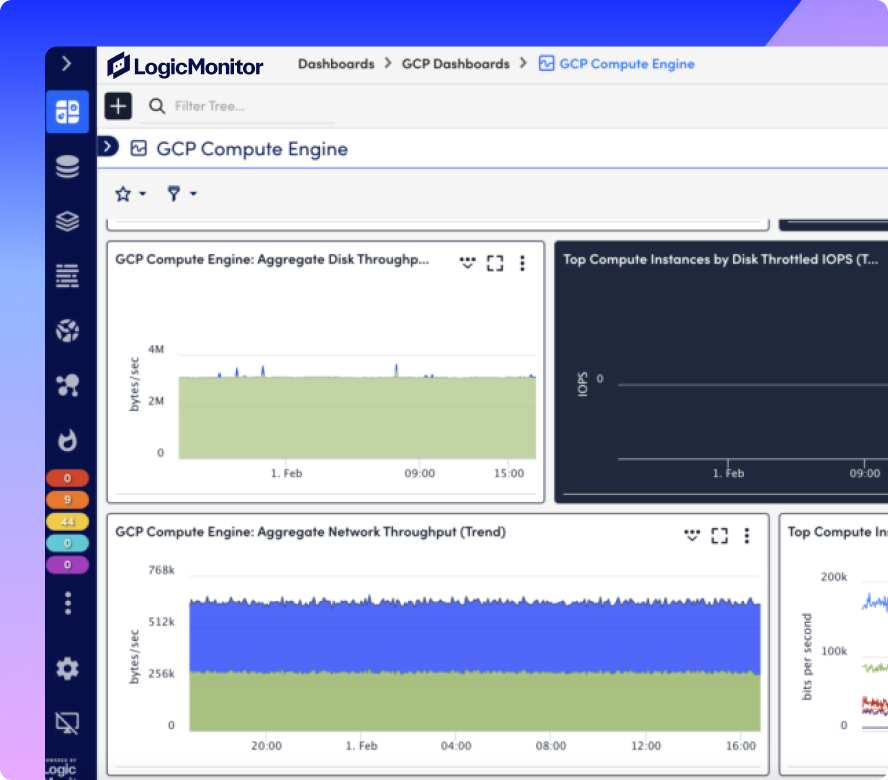
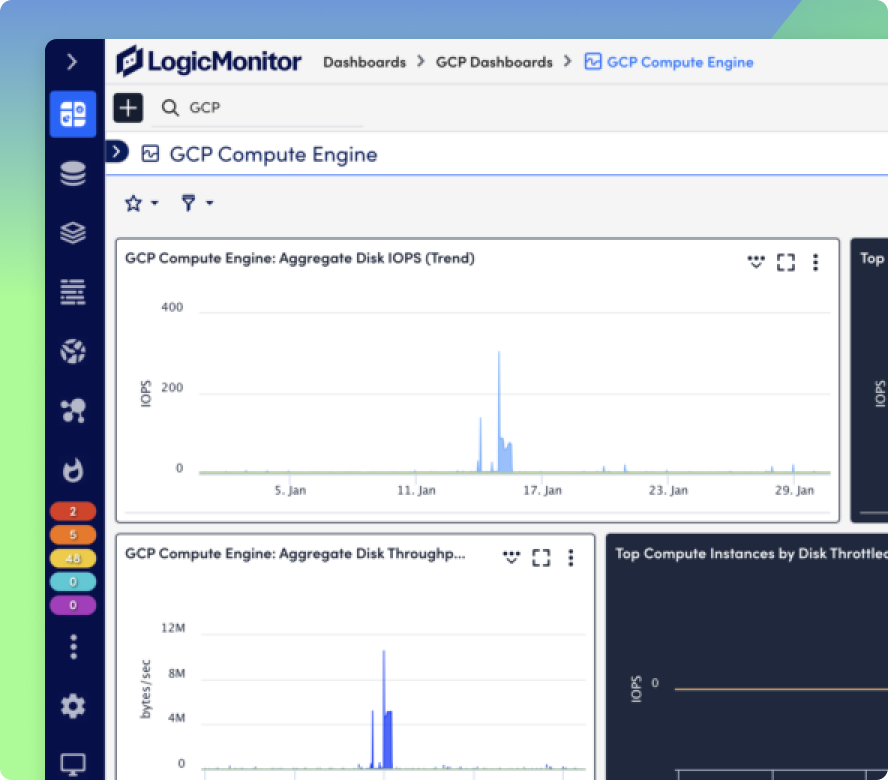
GCP Monitoring That Scales With Your Stack
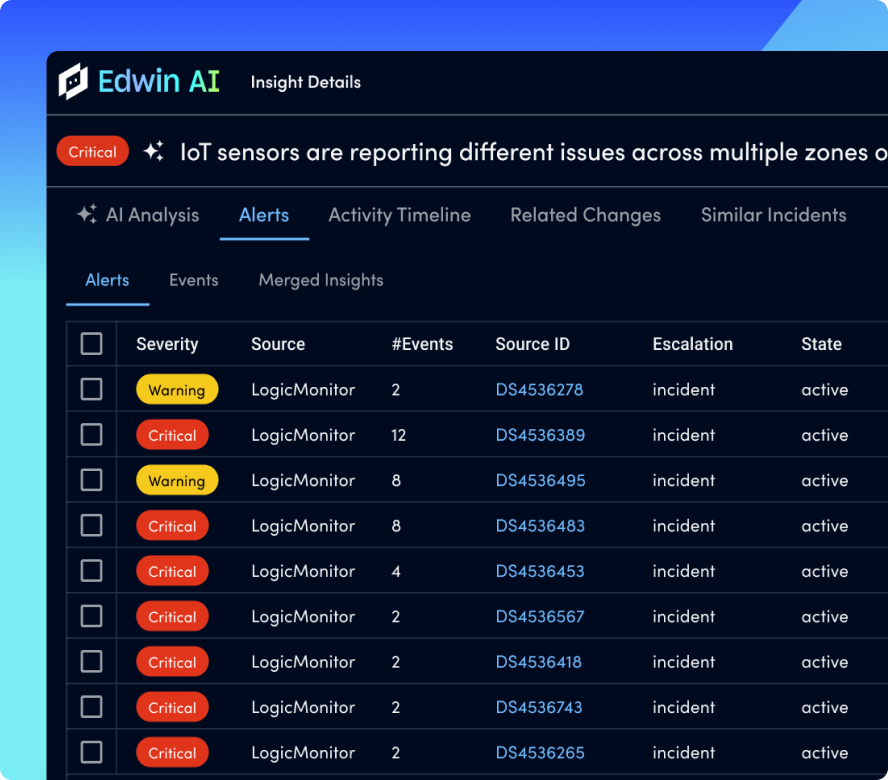
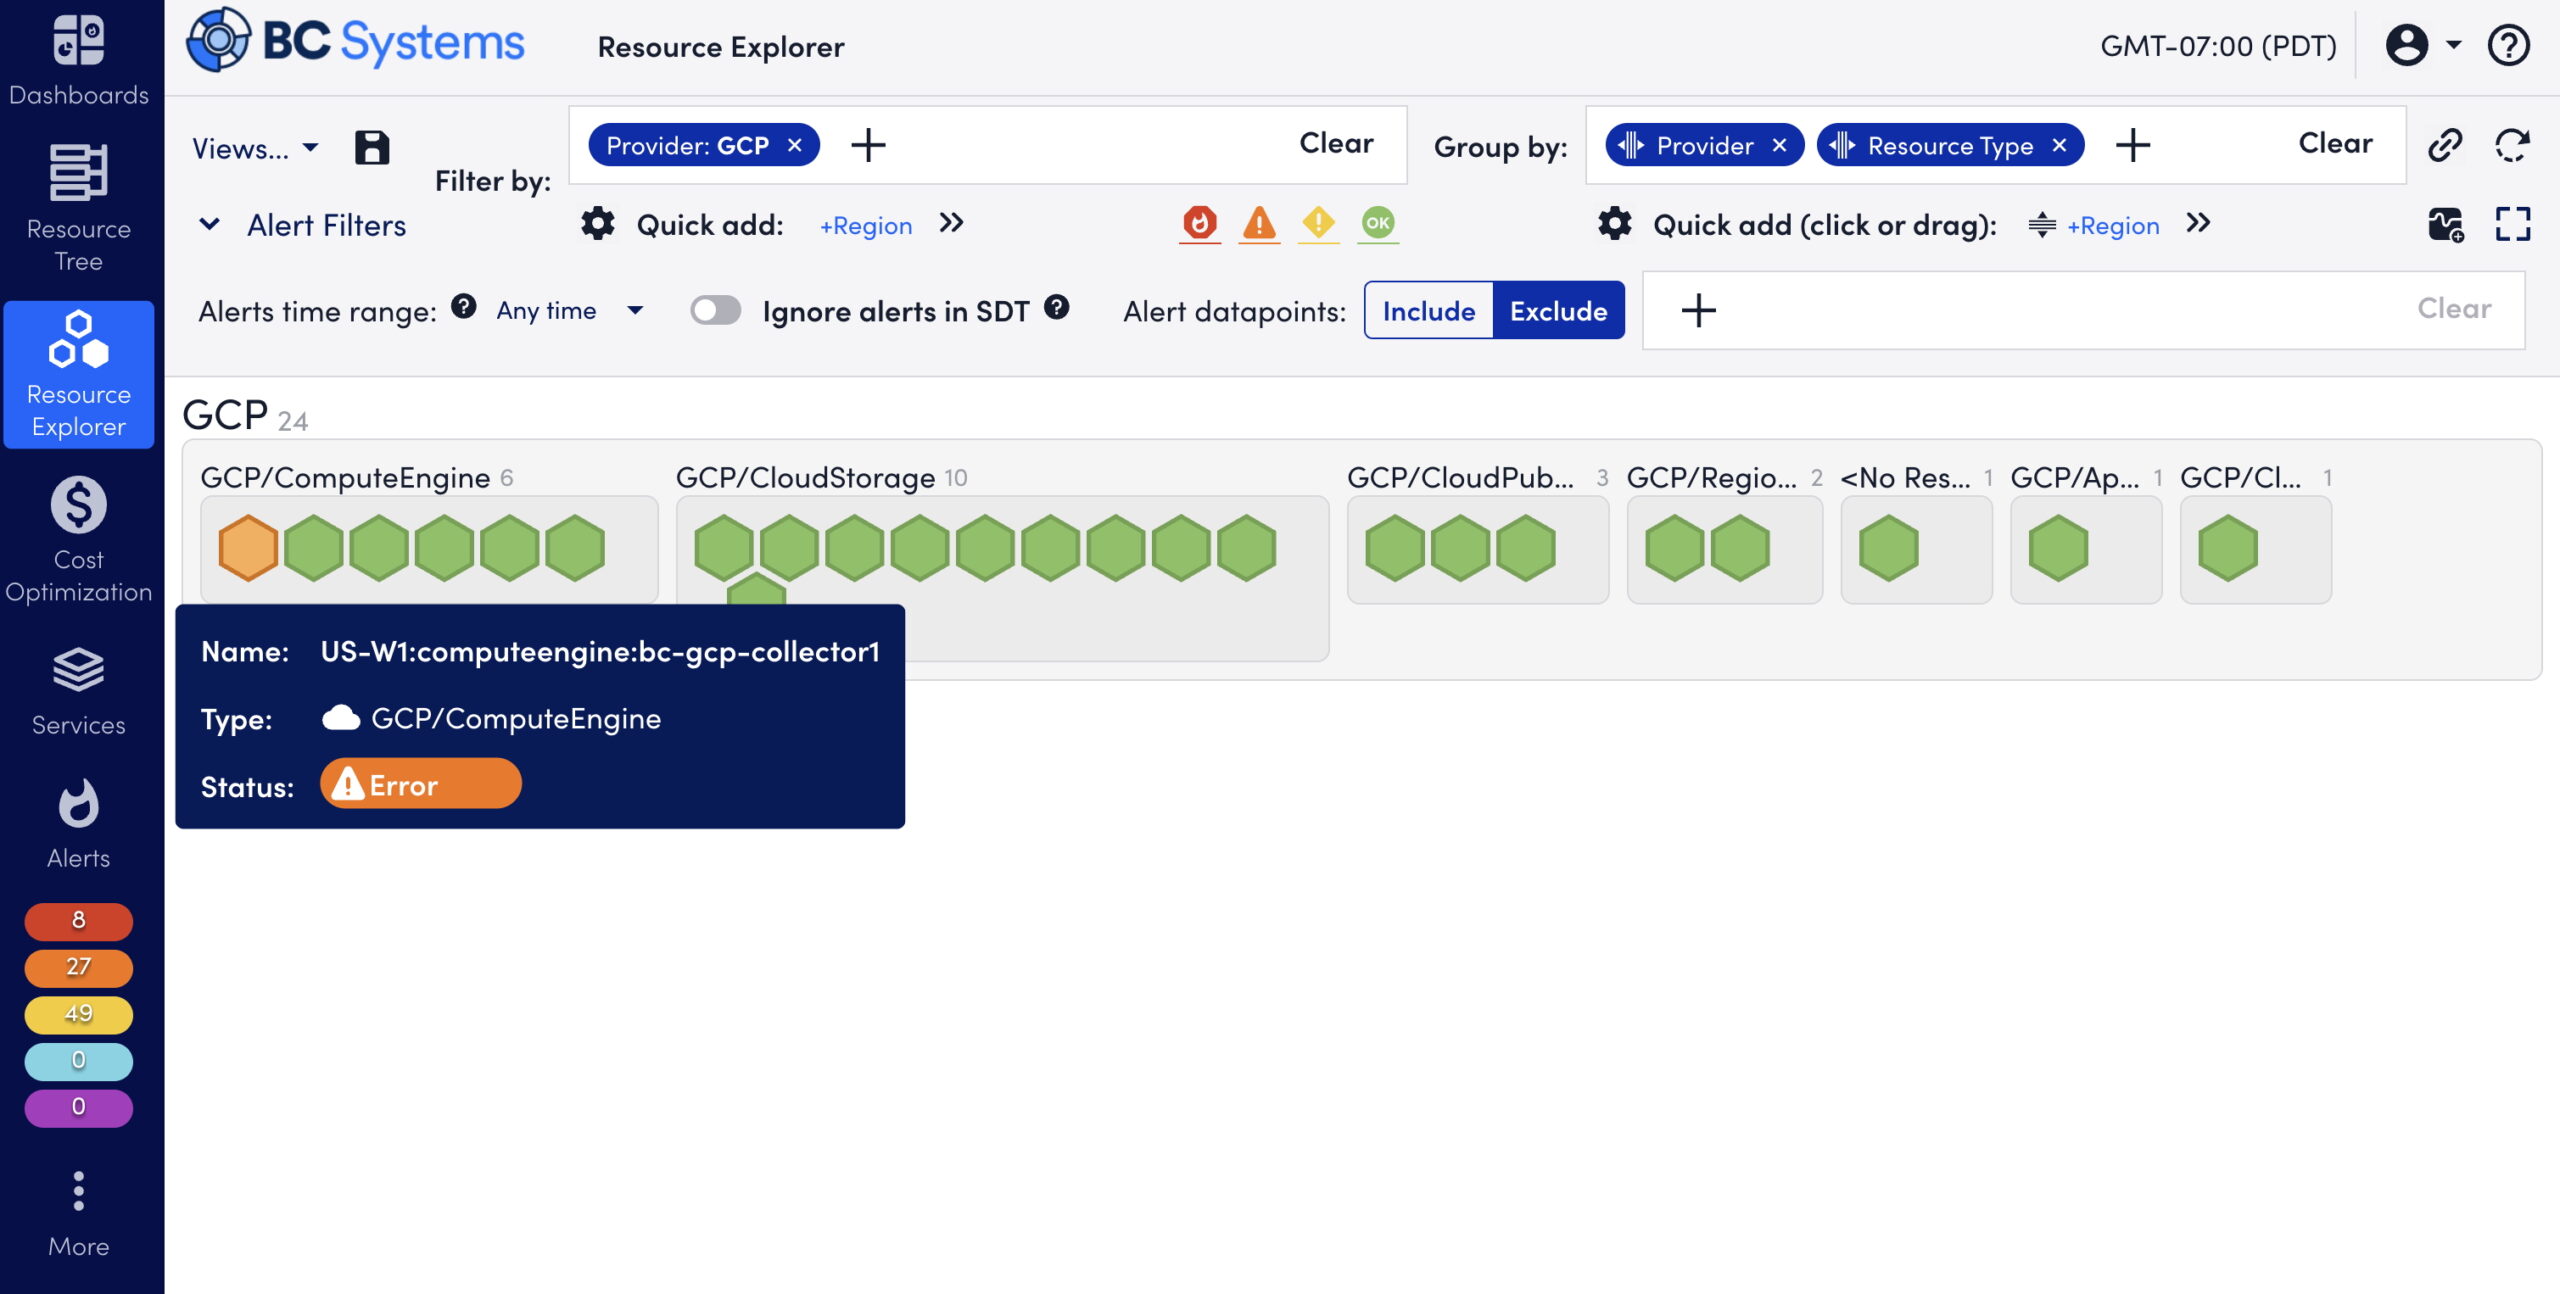
Get unified observability across your Google Cloud services and data center infrastructure, so you can troubleshoot faster, reduce alert noise, and drive performance without juggling multiple monitoring tools.