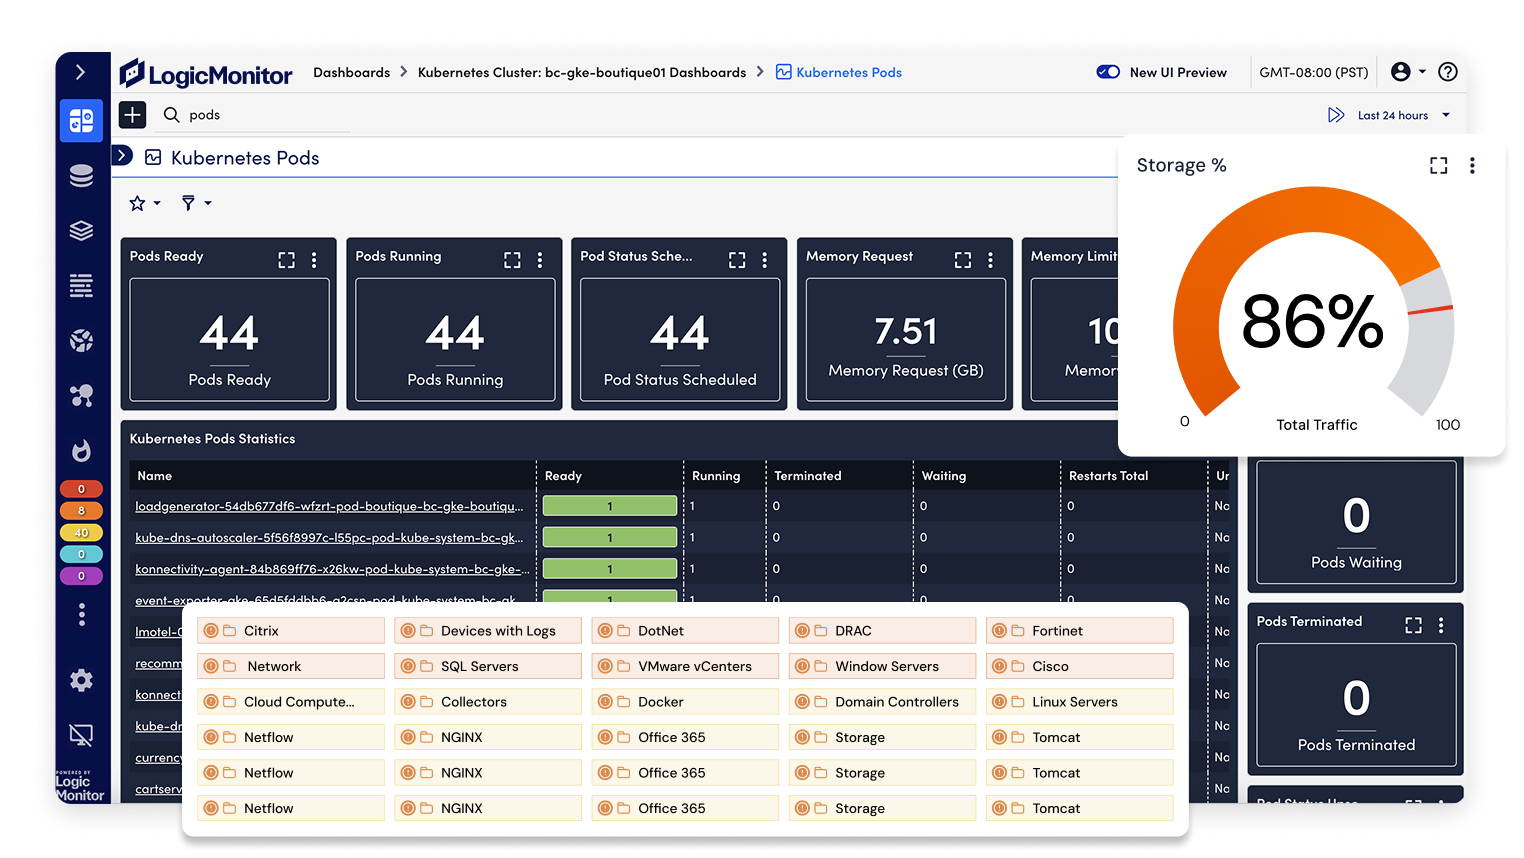
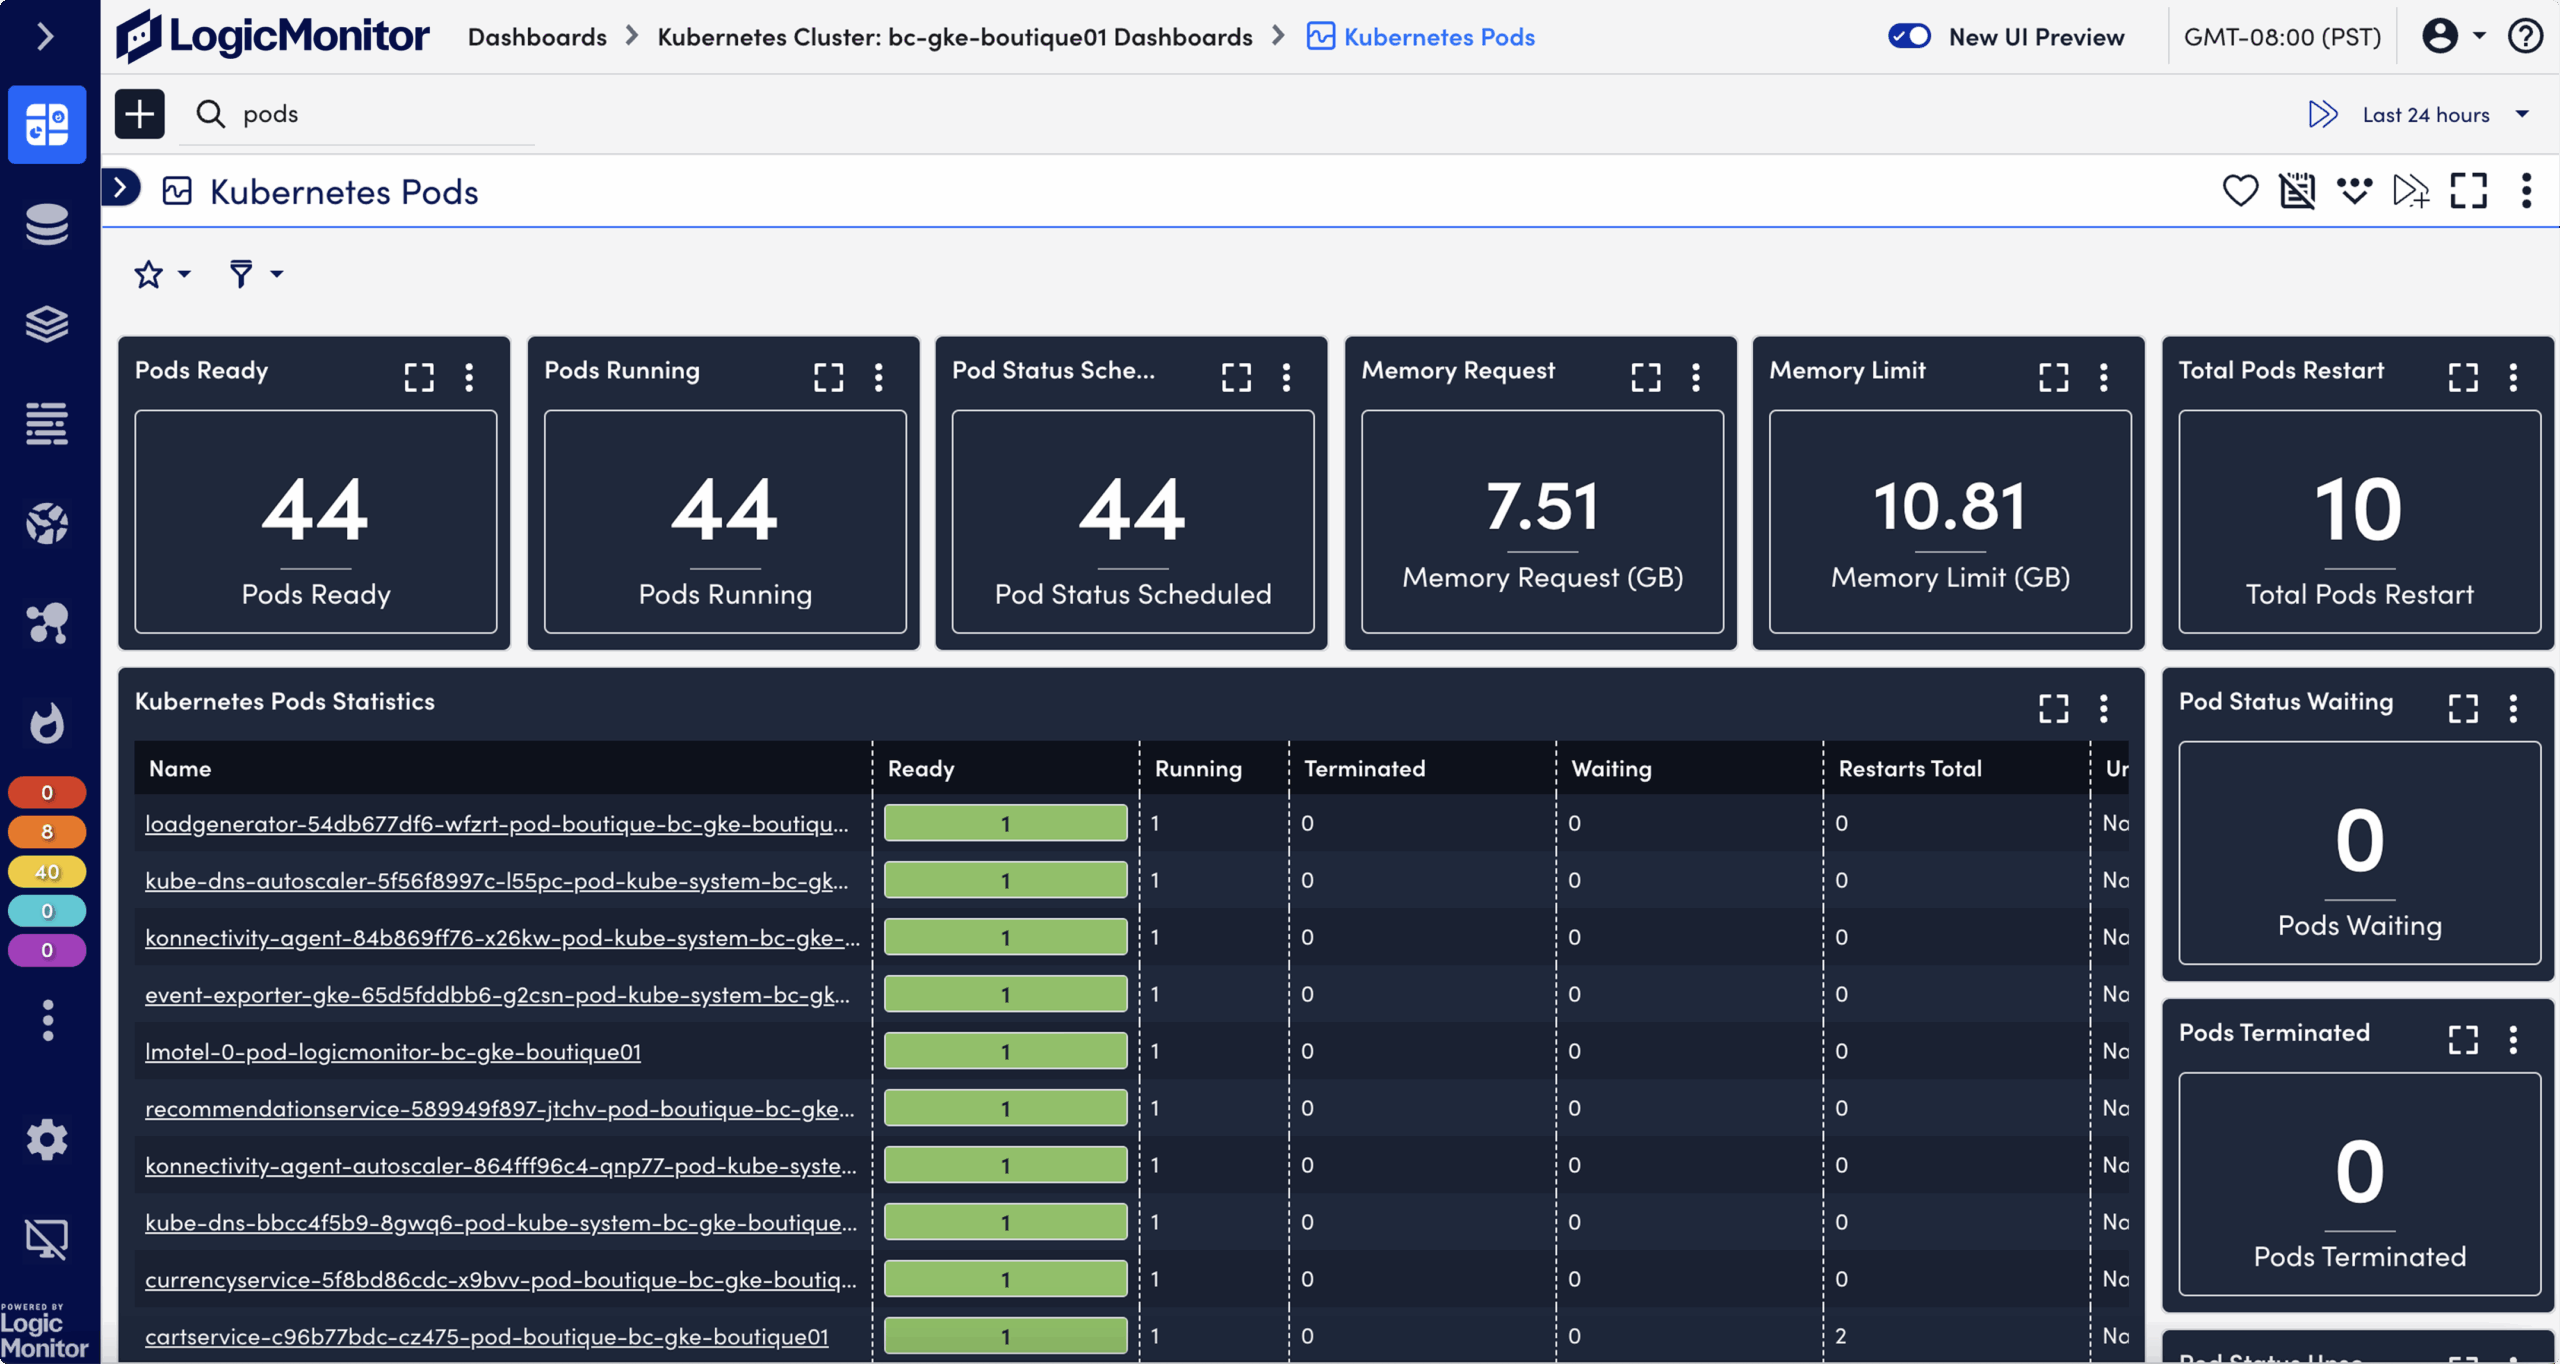
Container Monitoring

Lightning-fast monitoring for even the most ephemeral resources. Get visibility into your containerized applications that live alongside your hybrid IT infrastructure in a single monitoring platform. LogicMonitor automatically detects and monitors containers while they exist, understands when they disappear, and retains performance data about the nature of the container.

Rapidly deploy dynamic container monitoring

Save time without worrying if your monitoring system can keep up. LogicMonitor automatically discovers containers, microservices, and underlying resources. Identify and solve issues quickly and with precision. LogicMonitor’s container monitoring provides insight into performance and health of your applications, the containers they’re running in, and the underlying resources that support them.

A LogicMonitor dashboard of Kubernetes pods

Total container monitoring

Kubernetes

Comprehensively monitor Kubernetes from clusters to Kubelets. LogicMonitor automatically adds and removes cluster resources from monitoring – including nodes, pods,services and more.

Docker

Monitoring at the speed of containers. Built-in Docker integrations and automated discovery ensures visibility of all ephemeral resources.

Amazon ECS

Save time and reduce alert noise with pre-configured alert thresholds for AWS container services, such as EKS and ECS.

Hybrid monitoring to correlate containers with on-premise infrastructure

As businesses modernize and shift workloads to the cloud (or multiple clouds), container use increases. LogicMonitor offers a single platform that meets you where you are on your modernization journey and grows with you. Get insight into the performance of the applications running in containers, as well as the health of the underlying container resources and orchestrating components. LogicMonitor presents these insights alongside your organization’s existing monitored hybrid infrastructure in a single, unified monitoring platform.

This dashboard provides various metrics that are monitored for Kubernetes Containers using the Kubernetes cluster API.

Monitor and track dynamic services and ephemeral resources

Containers and pods are ephemeral resources. It’s difficult to monitor components that may appear (and disappear) quickly and unpredictably. To accurately track ephemeral resources, LogicMonitor employs event-based discovery, where cluster resources are automatically added and removed from monitoring based on Kubernetes events or changes in microservices.

Focus on the health and performance of the overall service, regardless of changes in underlying resources, by dynamically grouping together containers and other ephemeral resources supporting common microservices.

AWS EKS Cluster Performance dashboard

Event-based Kubernetes monitoring: a new level of clarity

Event-based Kubernetes monitoring eliminates the most common challenges of monitoring ephemeral resources by:

  • Automatically adding and removing cluster resources including nodes, pods, and services Eliminating the need to deploy an agent on every node Offering comprehensive performance and health metrics at both the cluster and application levels
  • Providing insight on underutilized resources to optimize CPU,memory, and more
  • Storing data for up to two years
This dashboard provides various metrics that are monitored for Kubernetes Services using the Kubernetes cluster API.

Identify performance trends

Maintaining data continuity with the complexity of modern applications is challenging LogicMonitor uses data across resources supporting a common application to provide long-term views into how that application performs over time. Key performance indicators are aggregated across these grouped resources to provide monitoring for the health and performance of the service as a whole.

Constantly changing containers can trigger needless alert storms that distract and diffuse your teams from seeing what matters. LogicMonitor offers intelligent contextual alerting with LM Service Insight so you can solve problems quickly.LogicMonitor can proactively alert you when a container isn’t performing optimally, through pre-built or dynamic thresholds.

Keep your containerized applications healthy

With containers, organizations need insight into the performance of their applications that are running in containers, as well as the health of the underlying container resources and orchestrating components. To get the most out of their deployment, LogicMonitor presents these insights alongside your organization’s existing monitored hybrid infrastructure in a single, unified monitoring platform.

This dashboard provides various metrics that are monitored for Kubernetes Nodes using the Kubernetes cluster API.

See our reviews

Simple Effective Event Log and Resource Monitoring/Alerting tool

LogicMonitor is used by our organization to actively monitor servers and cloud infrastructure for both events and resource utilization. Our main objective is to use the tool to detect and alert IT staff of anomalies or other potential downtime that could impact our customers and employees. LogicMonitor is currently deployed to key infrastructures such as VM hosts, domain controllers, critical servers, and Azure resources such as VMs, Frontdoor, Kubernetes, etc.

Nov 21, 2022

Aaron Nielson

Security Systems Architect

NSP

Health, Wellness and Fitness | 501-1000 employees

LogicMonitor has been a homerun!

LogicMonitor is great for organizations needing to get better visibility into their IT Operations and those needing to reduce workloads so that their IT teams can focus on more strategic projects.

Jul 01, 2022

Zachary Brand

Senior Director of Connected Solutions Delivery

Virteva

Information Technology & Services | 501-1000 employees

LogicMonitor: Highly Recommended

LogicMonitor replaced the others because it provides better value for us: it is more effective, reliable and efficient at delivering functionality.

Jun 28, 2022

Michael Dieter

Senior Systems Engineer

Loyola University Maryland

Higher Education | 501-1000 employees

Using LogicMonitor as a Non-MSP

LogicMonitor’s licensing is per device instead of SolarWinds per interface. This means a switch only needs one license compared to SolarWinds licensing per port on the switch. SolarWind’s GUI is old and not very intuitive to new users. Setting up users in LogicMonitor is super easy and the use of roles makes managing permissions simple.

May 17, 2021

Martin Sims

Infrastructure Engineer

McWane, Inc.

Building Materials | 5001-10,000 employees

LogicMonitor is one of the best monitoring tool I have ever deployed.

LogicMonitor support is very good. Their response time is fast and we didn’t have any issues.

Sep 10, 2020

Idan Lerer

Senior Director, US Operations

OptimalPlus

Semiconductors | 201-500 employees

The Lowdown on LM

[LogicMonitor is] great for keeping an eye on infrastructure at a small scale (office-wide) or large scale (planet-wide).

Dec 18, 2020

Joe Carey

Support Engineer I

Synoptek

Information Technology & Services | 201-500 employees

LogicMonitor will become your Ops Team process improvement tool

We are a managed services IT staff and use LogicMonitor to support our clients and our own infrastructure. We sell monitoring as a service and Logic Monitor serves a critical role in that service.

Dec 14, 2020

Joe Jacir

System Engineer

Kovarus

Information Technology & Services | 51-200 employees

LogicMonitor is Time Saving Magic!

Hands down the best support we have received from any vendor. Same top tier experience at any time of the day whether it is a simple question or a complex issue. They listen to feedback and do their best to implement feedback on problems that are discovered. Support is always providing references and material to learn more about what you are asking in a non-condescending manner which is appreciative.

Dec 13, 2020

Collin Thoman

Systems Administrator

Seed IP Law Group, LLP

Legal Services | 51-200 employees

Second time LogicMonitor customer

LogicMonitor’s onboarding process is smooth. Typically you would have an engagement with professional services to walk through the tool and have assistance onboarding select devices. The support portal has excellent documentation on adding third party environments like AWS and Azure into the platform. Additionally, the ability to setup NetScans to automatically enroll devices is welcome.

Dec 11, 2020

Zack Dietz

Infrastructure Engineering Manager

Rehrig Pacific Company

Plastics | 1001-5000 employees

LogicMonitor is how monitoring should be.

There are few scenarios where LogicMonitor is not the right choice as a monitoring platform; in fact I cannot think of any where LogicMonitor was the issue.

Dec 10, 2020

Alex Boyle

Enterprise Operation Center Engineer Level II

Synoptek

Information Technology & Services | 1001-5000 employees

LogicMonitor makes container monitoring easy

Benefits of monitoring your containers with LogicMonitor include:

This dashboard provides an inventory of Kubernetes using the Kubernetes cluster API.

Automated discovery

Frequent and recurring discovery attempts ensure that your monitoring is always up to date. Metadata is automatically populated during discovery, so you have the contextual information you need when viewing and managing monitored resources.

kubernetes pods performance monitoring dashboard

Application Performance Health

Get long-term views into how a group of resources supporting a common application are performing and correlate performance trends with events.

Here we set up dynamic alerting which is determined based on anomaly detection.

Downtime prevention

Pre-configured alert thresholds ensure that you receive meaningful alerts right from the start, and help you to proactively prevent downtime.

Dynamic grouping

Dynamic grouping for resources supporting a common service makes it simpler to manage and schedule downtime for just those resources.

Service health

Out of the box dashboards provide deeper insight and will help you identify how you can optimize your cluster.

Logs Page

Data retention

Identify trends and forecast utilization over time. LogicMonitor tracks, monitors, and alerts on containers and microservices, and retains data for up to two years.

Related solutions

AIOps

Using LogicMonitor’s AIOps Early Warning System and preconfigured container integrations, alert thresholds will keep your inbox from being over-alerted on container notifications. Easily distinguish service-impacting alerts from non-service impacting alerts, and reduce how often you get woken up in the middle of the night. Streamline troubleshooting and proactively prevent issues with these AI-based features:

-Automatically surface anomalies and get precise root cause analysis for business-impacting issues.
-Ensure your teams only receive alerts for the issues that matter with dynamic thresholds tuned to your environment.
-Predict future trends and plan utilization with advanced forecasting and longer data retention.
-Visualize dependencies with dynamic topology mapping

Explore AIOps
AIOps 3D icon

Application performance monitoring

Monitor all of your applications running in containers, all from one unified o11y platform, allowing you to see see the health of both applications and containers. Troubleshoot and deploy faster than ever!

Explore APM

Infrastructure monitoring

Containers are one part of the larger tech stack of an entire infrastructure. Instead of having to switch between services, LogicMonitor not only monitors containers and applications all in one place, but also monitors your entire infrastructure. From network to configuration to cloud and everything in between, LogicMonitor is the unified monitoring platform.

Explore infrastructure monitoring
infrastructure monitoring 3D icon

Logs

LM Logs uses sophisticated algorithms and AIOps capabilities to automate log analysis for K8 environments in the same pane of glass as performance monitoring. Automatically analyze log data and surface anomalies for faster troubleshooting of complex environments. Reduce MTTR by correlating monitoring alerts to relevant log data. Save time by eliminating the need to context switch between monitoring and log management platforms.

Explore logs
Logs 3D Icon

We have integrated LM into our everyday work. The app is the first thing we look at in the morning, all our team members keep at least one of the customizable dashboards on their desktops at all times.

Sean F., Infrastructure Manager CDK Global

Microservice and Container Monitoring FAQs

What are microservices

Microservices are an architectural approach to development that is composed of small, individual services that can be built and work on their own, but can be added together for faster development. Microservices are autonomous, allowing each service to work functionally on it’s own.

What are containers

Containers are bundled packages of software that contain all of the necessary elements to function. A container can house one microservice and the libraries and tools needed for it to function, as well as house multiple microservices together for an entire application to run.

What are ephemeral containers?

Ephemeral containers a kind of Kubernetes container that temporarily runs in a pod, and can spin up as necessary, which are used primarily for troubleshooting workloads.

It’s almost like magic. Let’s chat.