
Cost Optimization – Billing
Last updated - 28 May, 2026
The Cost Optimization Billing dashboard provides a detailed view of costs generated by resources in your cloud environments. Use Billing to get an overview of cloud spending, break down costs by specific criteria like location or resource type, and observe trends in resource costs.
To receive billing data from cloud providers, you must configure each provider to export cost information to LogicMonitor. For more information on configuring billing, see Cost Optimization Billing Configuration.
Billing provides the following tabs to organize how you observe your cloud spending:
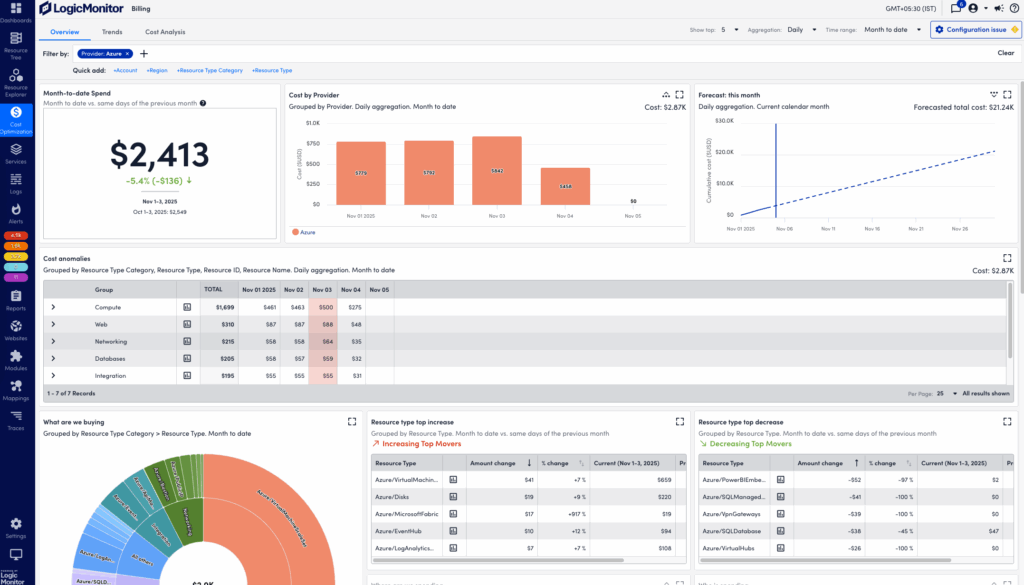
- Overview—Displays a wide range of billing data for your environment. Visualizations in this tab provide an overview of the billing details such as month-to-date spending, monthly and yearly forecasts, saving opportunities, and more. These features enable you to view overall cloud costs, and focus on key aspects of those costs to optimize spending in your cloud environments.
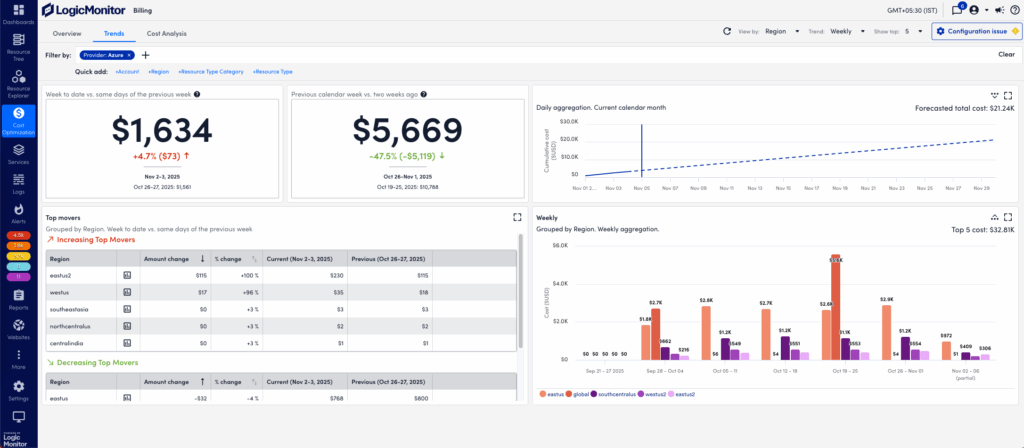
- Trends—Tracks spending history to provide insight about historical increases or decreases in costs for your cloud environments. Visualizations in this tab display changes in cost, forecasts, and top movers for increases and decreases in cost. There are also visualizations that display cost trends for compute, storage, database, and networking resources.
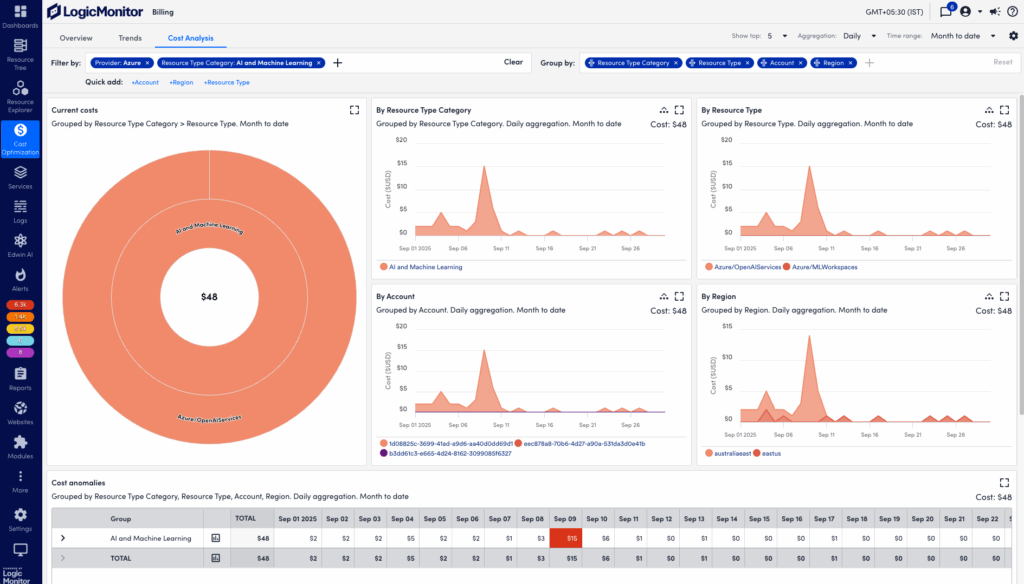
- Cost Analysis—Enables detailed observation of spending across your cloud environments. Visualizations in this tab display current total cost breakdowns, costs by category, and cost anomalies. Each visualization provides drill down options to focus on more specific dimensions within the filters you set. You can also navigate directly to Resource Explorer to review resources that match selected dimensions.
- Budgets—Tracks monthly spending within cloud environments. Create and manage budgets for specific cloud accounts and other billing properties, and receive alerts when spending meets specific thresholds. For more information on creating new budgets, see Cost Optimization Budgets.
Use the filter and group features on each tab to filter and group billing data by specific properties. The Quick add feature to easily add filter properties for provider, account, region, resource type category, and resource type. Visualizations within each tab update automatically to reflect the selected filter and group settings. Select Help me choose to browse filter properties and resource values using the dimension browser.
You can also create Billing and Forecast widgets in LogicMonitor Dashboards to further customize your Billing visualizations. For more information, see Billing Widget and Billing Forecast Widget.
Requirements for Using Cost Optimization Billing
To use Cost Optimization Billing, you need the following:
- A user with the “Cost Optimization” permission set. For more info, see Cost Optimization Role Permissions.
- Billing configurations for each cloud environment you monitor with Cost Optimization. For more information, see Cost Optimization Billing Configuration.
Filtering Billing Overview Data
- In LogicMonitor, navigate to Cost Optimization > Billing.
- Select the Overview tab.
- In the Filter by field, select
 Add to choose a filter property, and enter any details to refine the selected filter.
You can also select a property in the Quick add list to add filter properties for provider, account, region, resource type category, and resource type. - (Optional) Select Help me choose to launch the dimension browser.
- For more information, see Filtering with Dimension Browser in this document.
- (Optional)Select Clear to remove any filter properties and view the default overview for all widgets.
- In the Show top dropdown menu, select a value to adjust how many resource properties to include in billing data results.
For example, selecting “10″ adjusts billing data for the 10 resources with the highest associated cost. - In the Aggregation dropdown menu, select an aggregation rate and time range to adjust the aggregation breakdown of billing data.
For example, selecting “Daily” and “Year to Date” displays costs generated each day from the beginning of the current year.
Overview visualizations automatically update to reflect the selected filter configurations.
Filtering Cost Optimization Trends Data
- In LogicMonitor, navigate to Cost Optimization > Billing.
- Select the Trends tab.
- In the Filter by field, select Add to choose a filter property, and enter any details to refine the selected filter.
You can also select a property in the Quick add list to add filter properties for provider, account, region, resource type category, and resource type. - (Optional) Select Help me choose to launch the dimension browser.
- For more information, see Filtering with Dimension Browser in this document.
- (Optional)Select Clear to remove any filter properties and view the default overview for all widgets.
- In the View by dropdown menu, select a category by which to further filter trend results.
- In the Trend dropdown menu, select “Weekly” or “Monthly” to customize the time range of billing trends.
- In the Show top dropdown, select a value up to “25” to adjust how many resource properties to include in billing data results.
For example, selecting “Region”, “Weekly”, and “5” displays the largest change in billing per week for the top five regions in your cloud environments.
Trends visualizations automatically update to reflect the selected filter configurations.
Filtering Cost Optimization Cost Analysis Data
- In LogicMonitor, navigate to Cost Optimization > Billing.
- Select the Cost Analysis tab.
- In the Filter by field, select Add to choose a filter property, and enter any details to refine the selected filter.
You can also select a property in the Quick add list to add filter properties for provider, account, region, resource type category, and resource type. - (Optional) Select Help me choose to launch the dimension browser.
- For more information, see Filtering with Dimension Browser in this document.
- (Optional)Select Clear to remove any filter properties and view the default overview for all widgets.
- In the Show top dropdown, select a value to adjust how many resource properties to include in billing data results.
For example, selecting Show top “10″ adjusts billing data for the 10 resources with the highest associated cost. - In the Aggregation dropdown menu, select an aggregation rate and time range to adjust the aggregation breakdown of billing data.
For example, selecting “Daily” and “Year to Date” displays costs generated each day from the beginning of the current year.
Cost Analysis visualizations automatically update to reflect the selected filter configurations.
Budgets Tab in Cost Optimization
The Budgets tab displays a table of available budgets, with details in the following fields:
| Name | Description |
| Current Status | The status of a budget, calculated against its Overage Threshold field. Displays one of the following status icons: |
| Budget | The name of a budget. |
| View Graph Info | Select  View Graph Info to display a breakout graph of forecasted costs for the selected budget. View Graph Info to display a breakout graph of forecasted costs for the selected budget. |
| Monthly Budget | The monthly budget amount assigned to a budget. |
| Current costs | The amount currently spent this month, plus the forecasted spend by end of day. |
| End of month forecast | The forecasted total amount spent at the end of the month, based on the current spending trend. |
| Forecasted overage | The forecasted total amount spent at the end of the month that exceeds the budget amount. |
| Overage Thresholds | The alert threshold percentage above the budgeted spend. Displays one of the following status icons: |
| FilterBy | A list of filter properties applied to a budget (for example: Account, Owner, or Provider.) |
| Created By | The ID of the user that created a budget. |
| Actions | The following actions are available for a budget: View Cost Analysis—Navigate to the Cost Analysis tab, focused on the selected budget’s accounts and filter properties. Manage Budget—Manage the selected budget. For more information see, Cost Optimization Budgets. Delete Budget—Delete the selected budget. |
In addition to specific budget functions, the Budgets tab also provides the following features:
- Search—Enter text to display results filtered by the Budget field.
- Filter by status—Select a status icon to display results filtered by the Current Status field.
Filtering with Dimension Browser
Selecting Help me choose in the Filter by menu opens a dimension browser in supported Billing tabs. This tool enables you to quickly build billing visualizations by drilling down into selected filters to add related dimensions with resource values.
Note: Dimension browser is not available on the Budgets tab.
To add filter properties using dimension browser, do the following:
- Select Help me choose in the Filter by window.
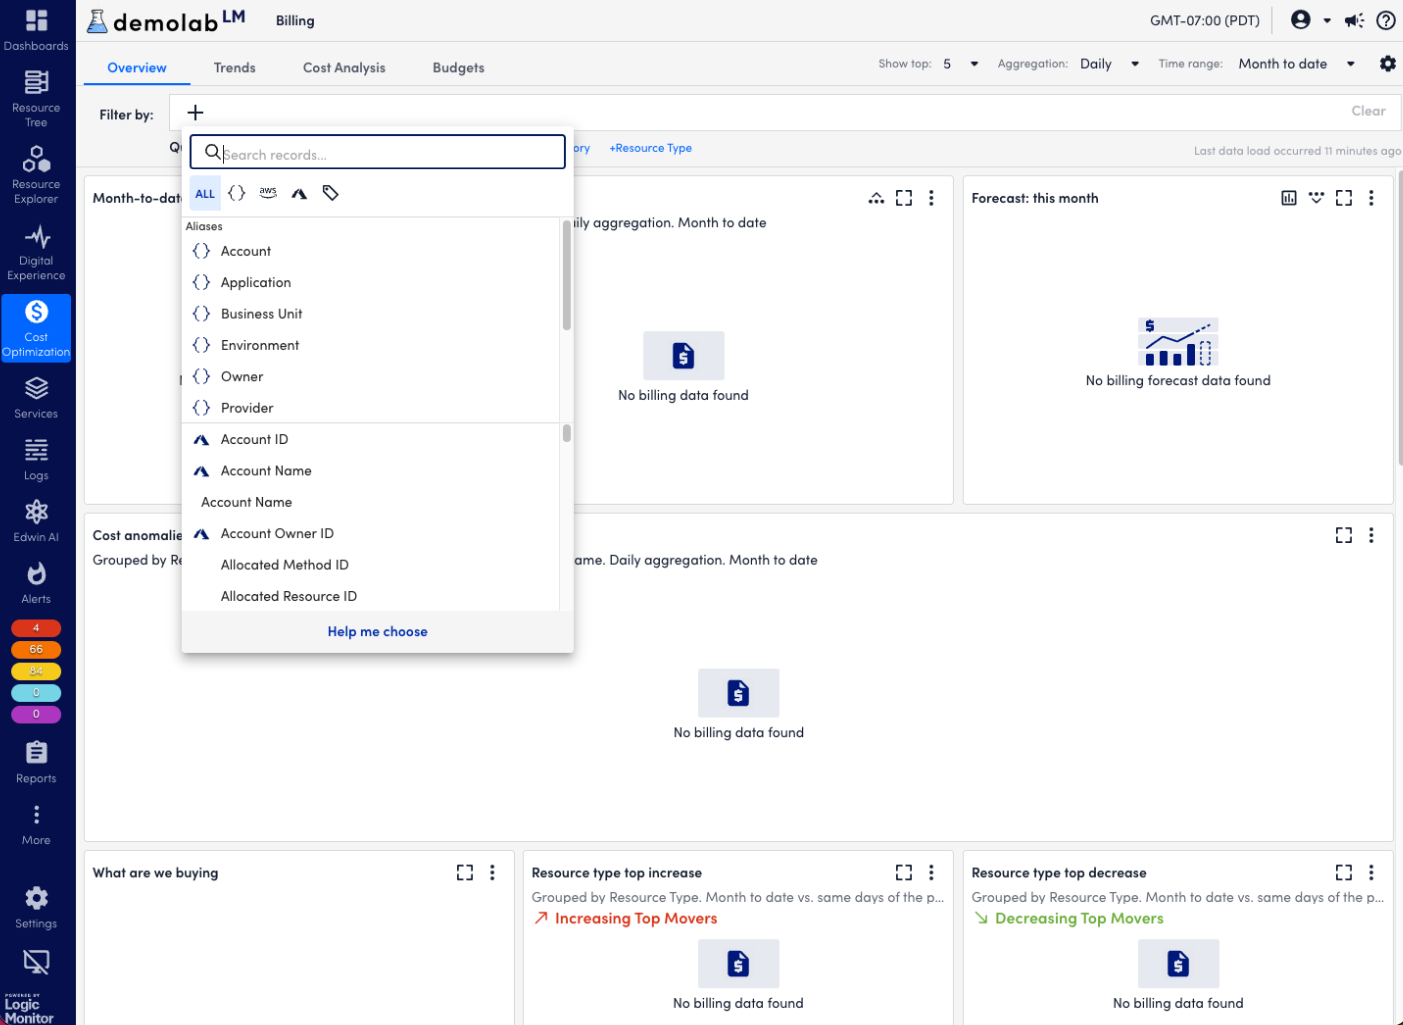
- Select a filter property from the list to view available dimensions in a table.
For example, selecting “Provider” in the Aliases list displays all cloud providers configured in your Billing dashboard.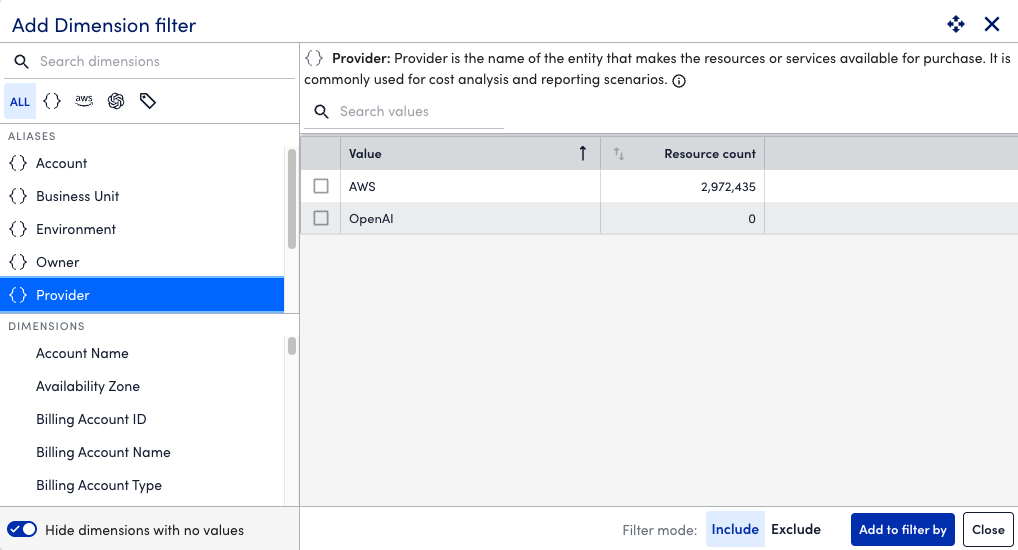
Note:Use the filter tabs and search bar above the properties list or dimensions table to refine which filter properties display.
Use * in the dimension search field to designate wildcard values when searching, and select Use * wildcard to see results. Wildcard values can be entered in the following ways:
- [text]*—display results that start with the text entered
- *[text]—display results that end with the text entered
- *[text]*—display results that include the text entered
- Toggle the checkbox for each dimension you want to filter.
The Resource count column displays how many resources exist within each dimension. - (Optional)Toggle Filter mode to include or exclude results by the selected dimensions.
- Select Add to filter by to apply the selected dimensions to the Filter by field.
Visualizations automatically update to reflect the selected filter configurations. - (Optional)Select additional filter properties from the Aliases and Dimensions list to view and select more filter properties. Keep the following in mind when selecting additional filters:
- Selecting a property from the Dimensions list after applying a filter property will display dimensions within that applied filter.
Use this to drill down and create more detailed billing visualizations. - Select
 Sort on the Resource count column to sort the table by how many resources apply to each dimension.
 - Toggle Hide dimensions with no values to change if dimensions or tags with no related resources appear on in the table.
- You must select Add to filter by to apply selected filter properties before navigating to another dimension.
- Selecting a property from the Dimensions list after applying a filter property will display dimensions within that applied filter.
- Select
 Close.
Note: Hover over any property in the Aliases or Dimensions list to view a tooltip description of the selected property.
