
Usage Reporting for PaaS Monitoring
Last updated - 17 March, 2026
You can leverage Usage Reporting to view the usage metrics for PaaS monitoring directly in your LogicMonitor portal. PaaS monitoring is part of LogicMonitor’s cloud monitoring solution, and the usage metrics for PaaS monitoring display the monthly average count of your monitored PaaS cloud resources, including monitored Kubernetes Pods.
For a comprehensive list of PaaS resources, see Cloud Services and Resource Units.
Billing and Calculation for PaaS Monitoring
The LM Cloud PaaS SKU includes monitoring for compute-based PaaS resources across AWS, Azure, GCP, OCI, Kubernetes, and supported managed services.
Usage for PaaS monitoring is measured at the monthly average count of all monitored PaaS resources. Each monitored resource (including Kubernetes Pods) is counted once per day and averaged over the month to determine billable usage.
Any monitored instance of the following services contributes to PaaS usage:
| Cloud Provider | Counted PaaS Service |
| AWS | ECS Cluster, Lambda, AppStream, CloudSearch, DocumentDB, ElastiCache, Glue, MSK (Brokers), MQ, OpenSearch, Redshift, RDS |
| GCP | App Engine, Cloud Composer, Cloud Dataflow, Cloud Dataproc, Cloud Functions, Cloud Redis, Cloud Run, Cloud SQL |
| Azure | App Service, Analysis Services, Data Factory, HDInsight, Functions, MariaDB Server, MySQL Server, MySQL Flexible Server, PostgreSQL Server, PostgreSQL Flexible Server, Redis Cache, SQL Managed Instance, Virtual Desktop |
| OCI | Autonomous Database |
| Other | Kubernetes Pods, MongoDB Atlas Databases |
| AI/ML | Q Business, Bedrock, AI Bot Service |
Requirements for Viewing Usage Data for PaaS Monitoring
To view usage data for PaaS Monitoring in Usage Reporting, you must subscribe to LM Cloud Enterprise.
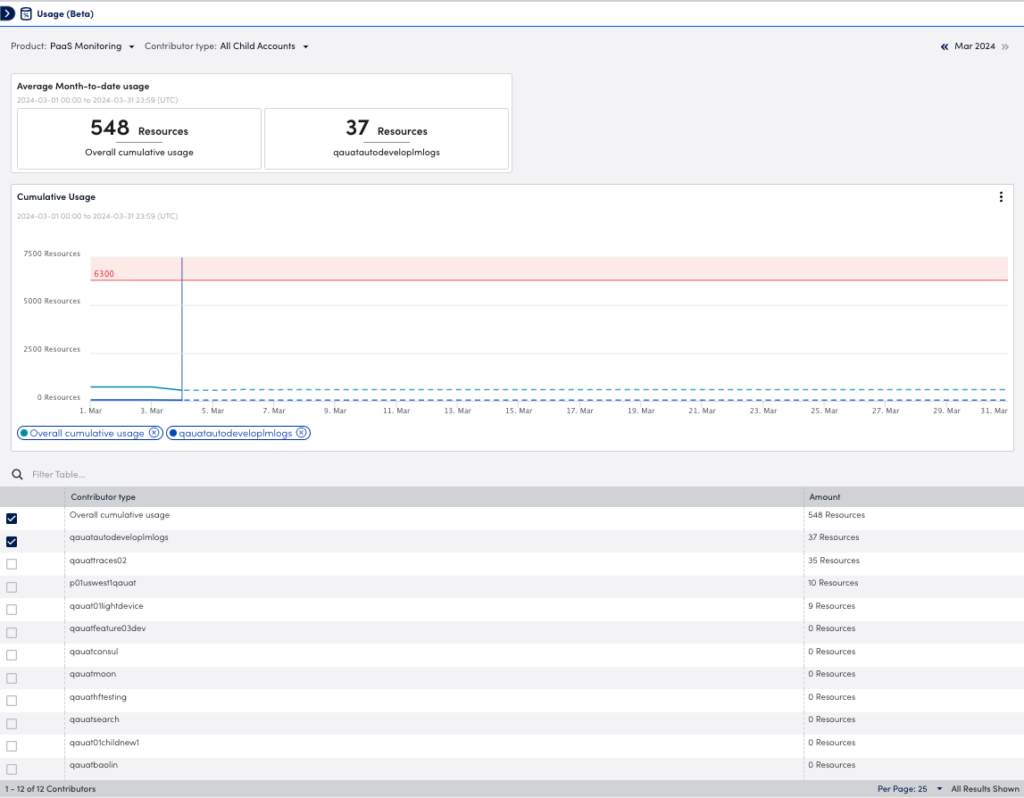
Viewing Usage Data for PaaS Monitoring
- In LogicMonitor, navigate to Settings > Usage.
- Select “PaaS Monitoring” from the Products dropdown menu.
- Select the contributor you want to view usage from the Contributor type dropdown menu.
For more information, see Usage by Contributor.
Note: This option is only available if your environment provides services to multiple portals.
- Select the month you want to view usage for.
- To view usage in a sparkline or bar graph format in the Cumulative Usage graph, select the type of graph from the Options menu of the Cumulative Usage graph.
Note: If a contributor is selected from Contributor type, you must select a contributor from the Usage Contributors table to display data in the Cumulative Usage graph.
