
Traffic Tab
Last updated – 28 April, 2026
NetFlow monitors the flow of traffic over the NetFlow device. NetFlow collects the traffic that enters and exits the interface. LogicMonitor monitors network traffic flow data for any resources that support standard flow protocols.
Traffic Tab at Group Level

Traffic Tab at Resource Level:
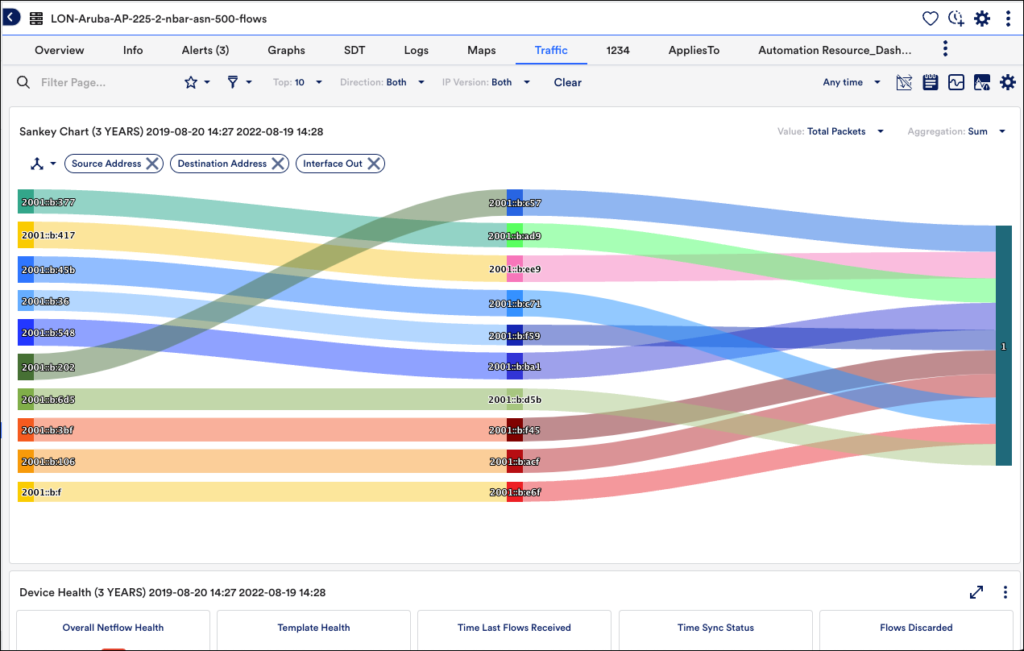
Note: You can view Sankey charts only at the resource level. For more information, see Sankey Charts.
The following features are available at the top right corner of the Filter bar:

| Feature | Description |
| Time Series | Allows you to view the network flow for the required period. |
| Sankey Charts | A Sankey chart is a flow diagram specially designed to visualize traffic flows and volume, represented by connections. For more information, see Sankey Charts. |
| Enable Ops Note | Allows you to add time-stamped annotations (i.e. markers) to your graphs. For more information, see Using Ops Notes. |
| Widget Settings | Allows you to enable or disable the widgets. For more information, see Widget Overview. |
| Traffic Alert Rules | Allows you to view, add, or edit traffic rules. For more information, see Traffic Alert Rules. |
| Settings | Allows you to configure the display names for IP-DNS Mapping, Port Mapping, and ASN Mapping. For more information, see Viewing, Filtering, and Reporting on NetFlow Data. |
| Filters Filter Page Saved Views | Allows you to save views. You can also set the required filters to view the network flow. For more information, see Traffic Alert Rules. |
