Kubernetes Scheduler Monitoring
Last updated - 01 June, 2023
The Kubernetes Scheduler is a core component of Kubernetes, which assigns pods to nodes through a scheduling process based on available resources and constraints. Monitoring the Kubernetes Scheduler service is crucial in determining its ability to efficiently use resources and handle requests at acceptable performance levels.
Important: We do not support Kubernetes Scheduler monitoring for managed services like OpenShift, Amazon Elastic Kubernetes Service (EKS), Google Kubernetes Engine (GKE) and Azure Kubernetes Service (AKS) because they don’t expose the Kubernetes Control Plane components.
The following are the benefits of using Kubernetes Scheduler:
- Performance tuning— The scheduler ranks each node based on constraints and resources and associates each pod to the best matching nodes.
- Flexible framework— The scheduler is a pluggable framework architecture that allows you to add new plugins to the framework.
Use Case for Monitoring Kubernetes Scheduler
Let’s say you have two nodes; Node 1 and Node 2, running on the same pod through a Kubernetes API server. The Kubernetes Scheduler communicates with the Kubernetes API server and decides that Node 1 is the best pair for the pod based on the affinity rules, or central processing unit, or memory parameters.
Requirements for Monitoring Kubernetes Scheduler
- Ensure you have LM Container enabled.
- Enable the Kubernetes_Schedulers datasource.
Note: This is a multi-instance datasource, with each instance indicating a scheduler. This datasource is available for download from LM Exchange. - Ensure you change the bind-address to the specific Kubernetes pod. The default value is 0.0.0.0. For more information, see the bind-address string in kube-scheduler from Kubernetes documentation.
Setting up Kubernetes Scheduler
Installation
You don’t need separate installation on your server to use the Kubernetes Scheduler. For more information on LM Container installation, see Installing the LM Container Helm Chart or Installing LM Container Chart using CLI.
Configuration
The Kubernetes Scheduler is pre-configured. If you don’t see any data for the Kubernetes Scheduler, do the following:
- In your Kubernetes pod, navigate to /etc/kubernetes/manifests.
- Open and edit the kube-scheduler.yaml file.
- Change the –bind-address at .spec.containers.command from 127.0.0.1 to .status.podIP present on kuber-scheduler pod.
- Save the kube-scheduler.yaml file.
Note: If –bind-address is missing, the scheduler continues to run with its default value 0.0.0.0.
For monitoring self-implemented scheduler, do as follows:
- In LogicMonitor, navigate to Settings > DataSources > select Kubernetes Scheduler DataSource.
- In the Kubernetes Scheduler DataSource page, expand Active Discovery.
- In the Parameters section, select Embedded Groovy Script option.
- In the Groovy Script field, enter the required component name for the scheduler_label array.
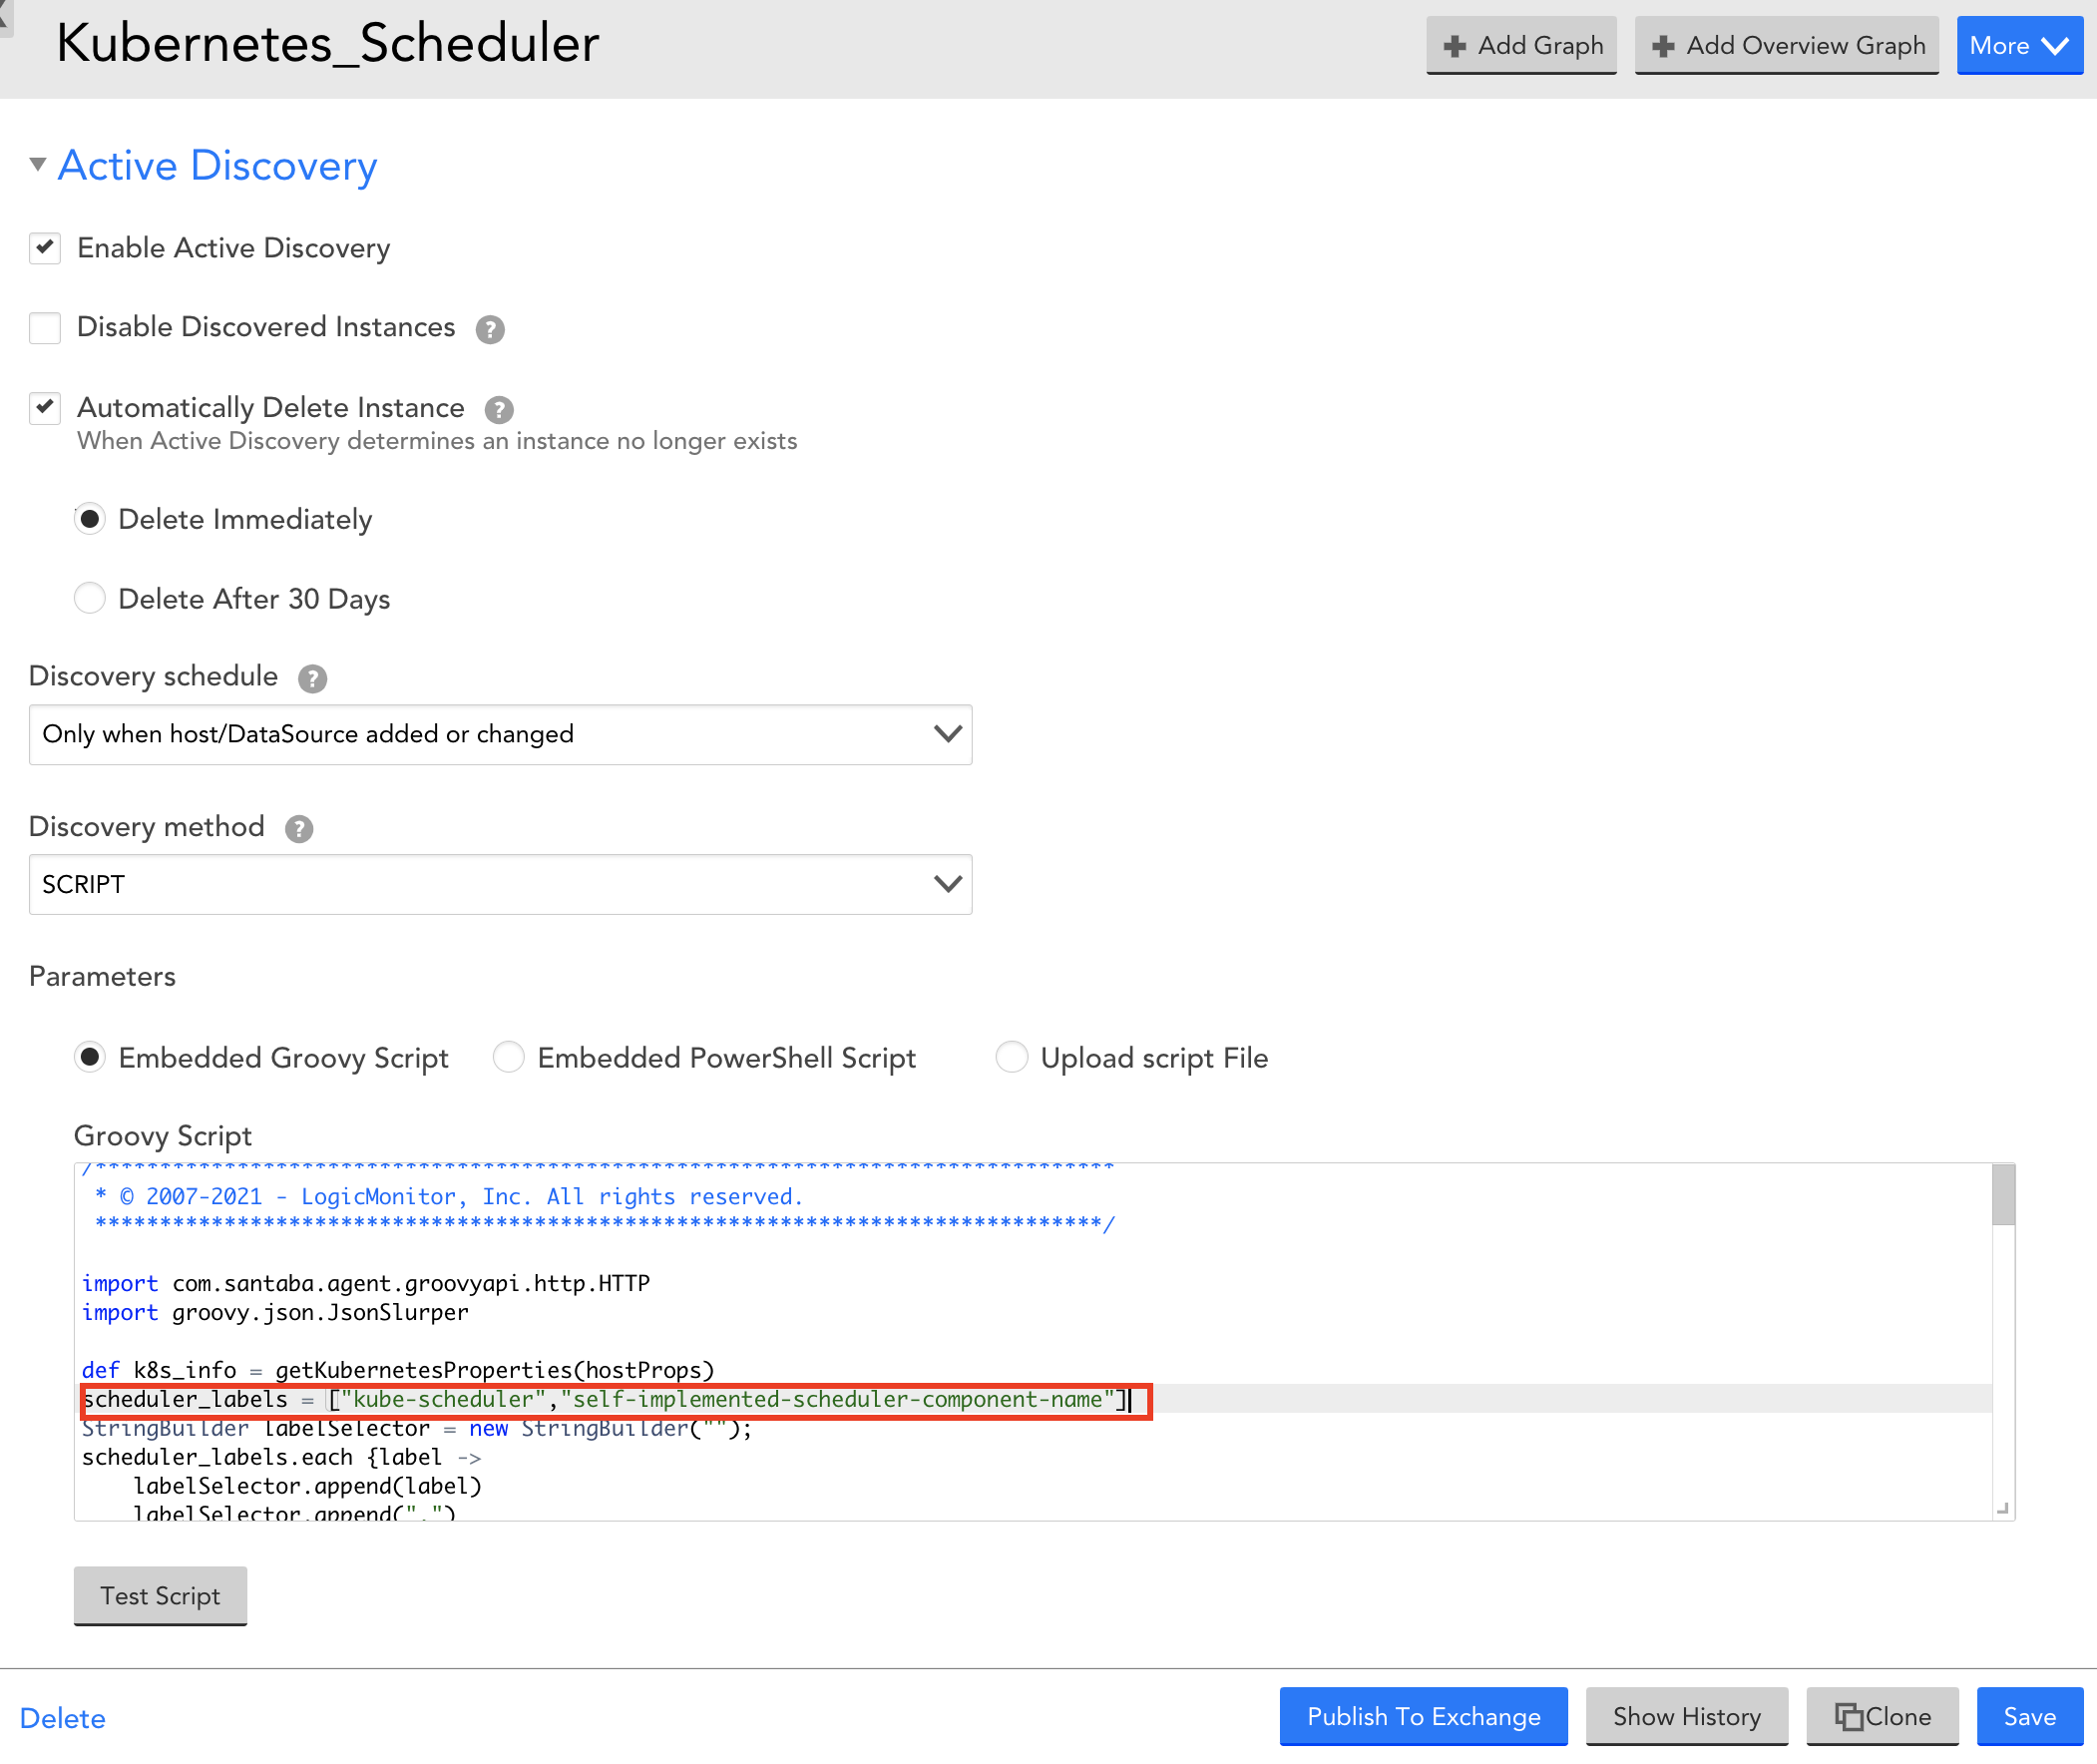
- Expand Collector Attributes and in the Groovy Script field, enter the required component name for the scheduler_label array.
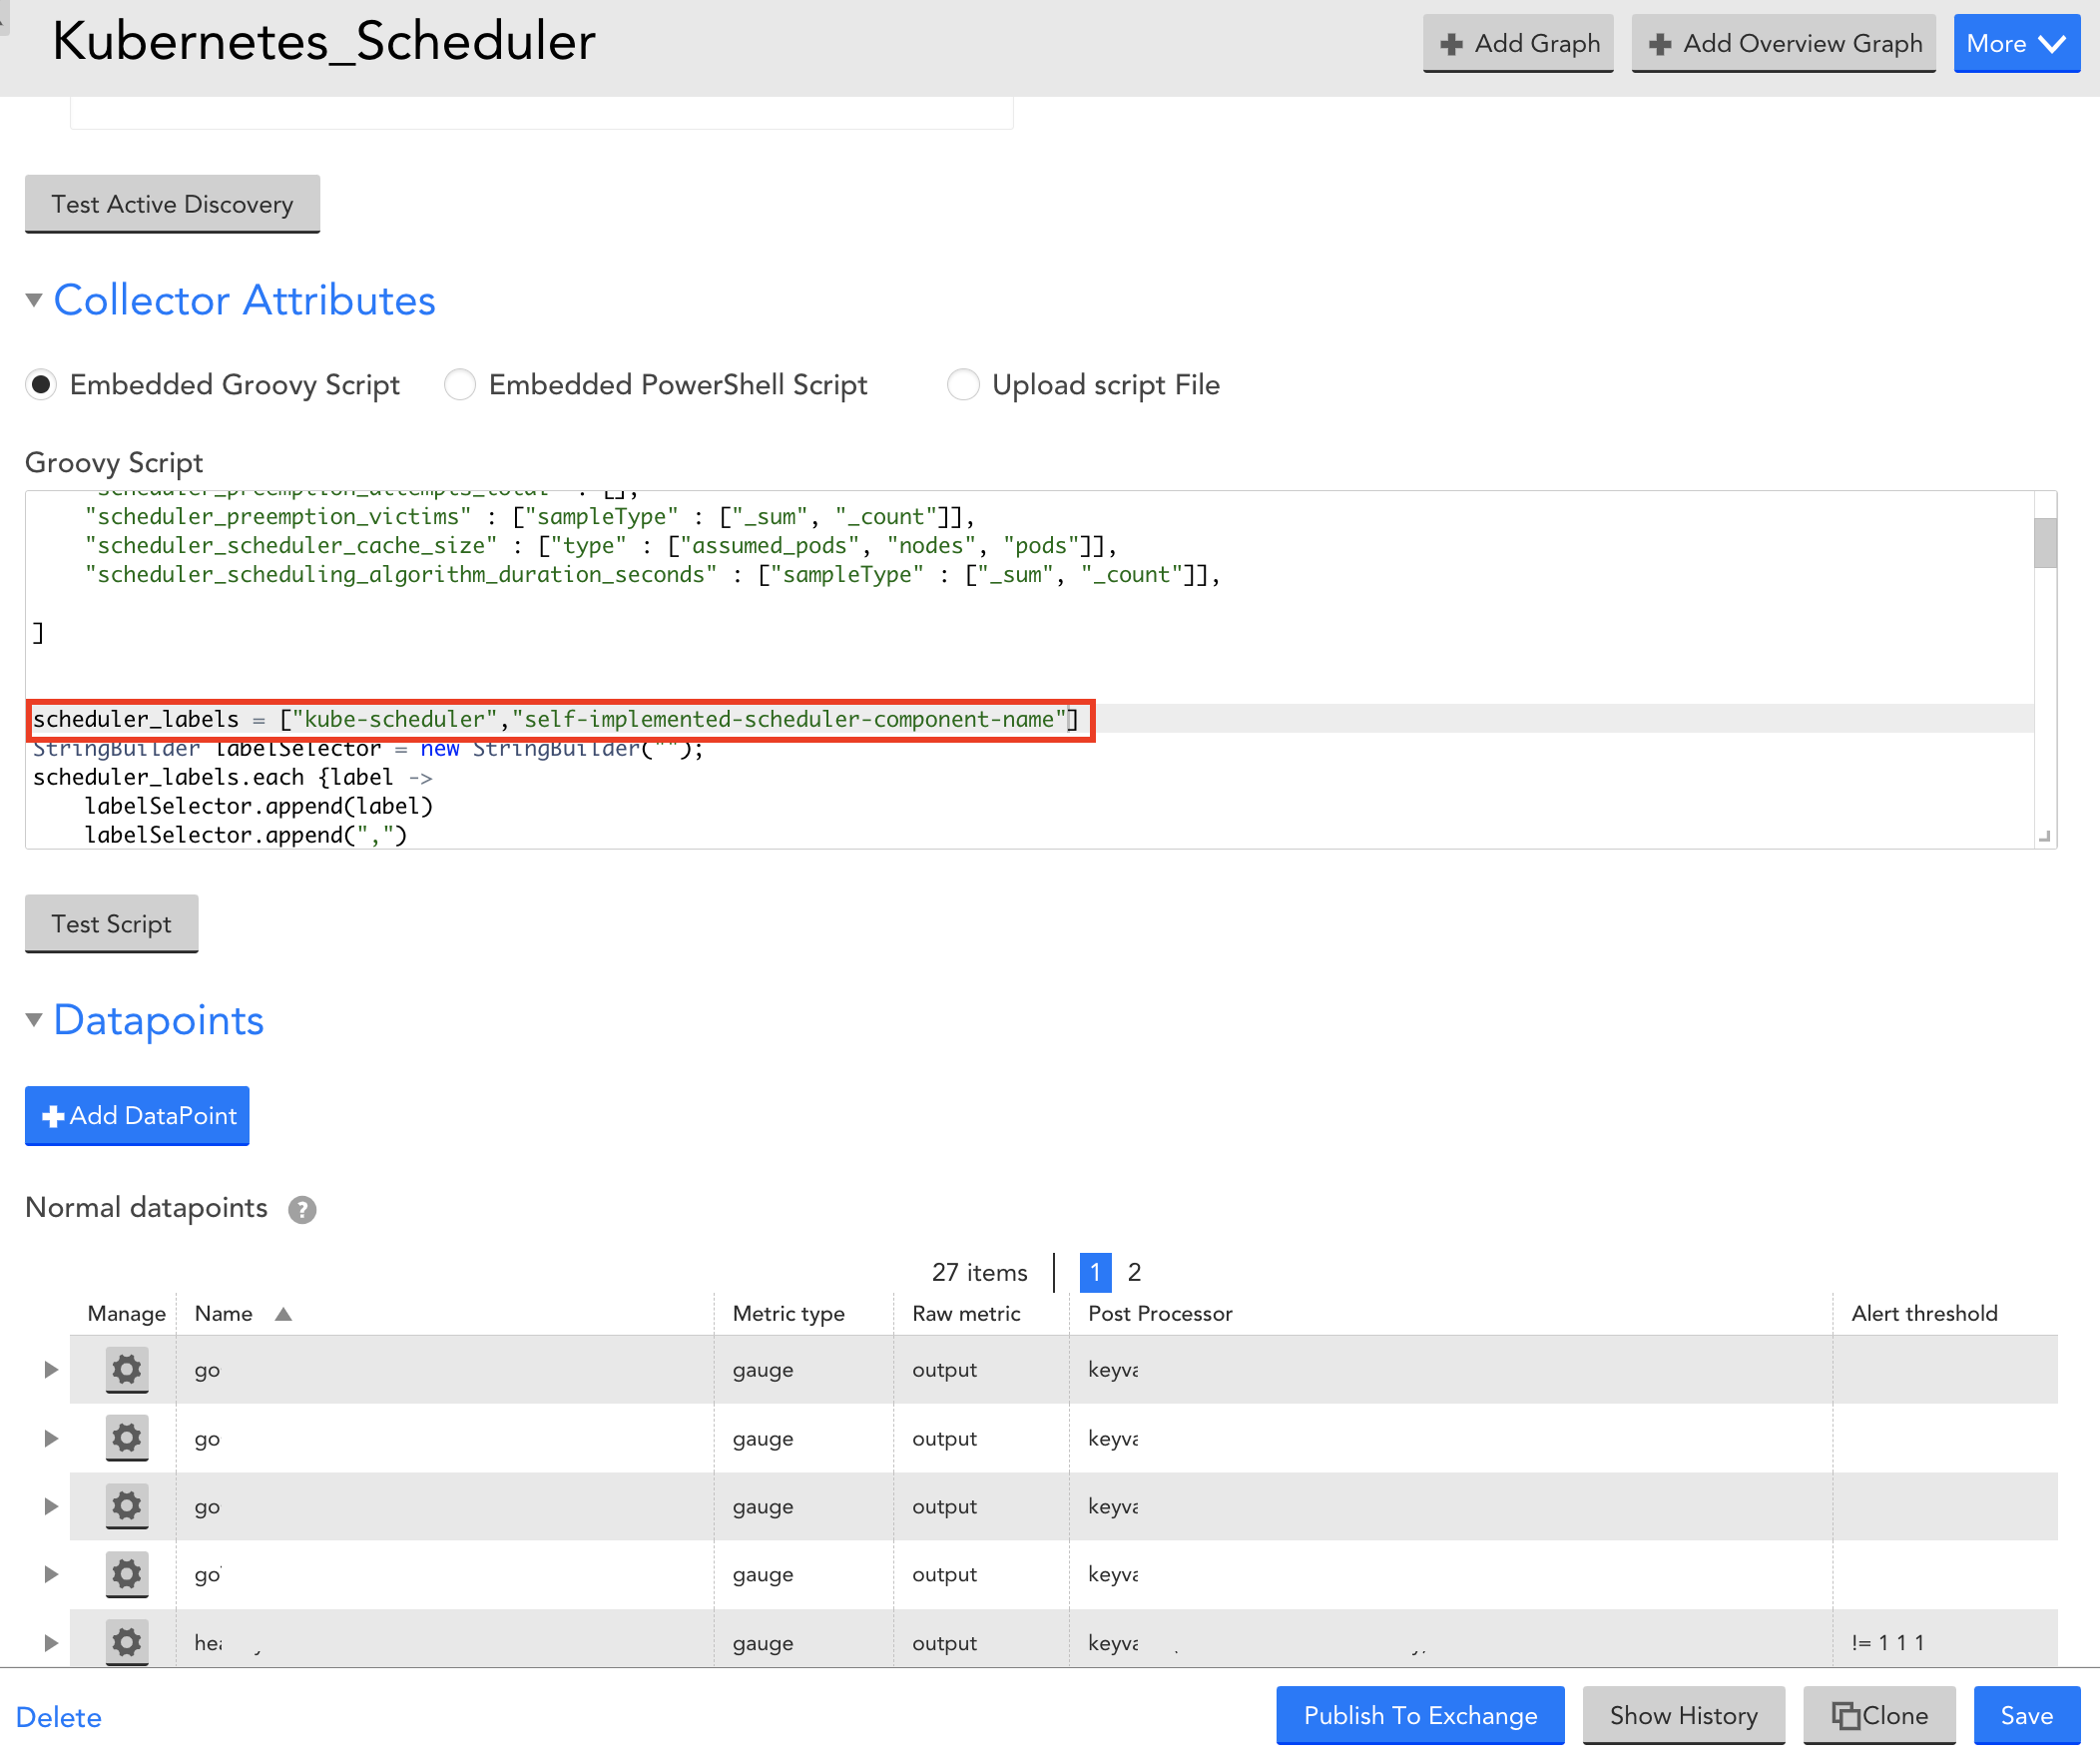
- Select Save to save the Kubernetes Scheduler DataSource.
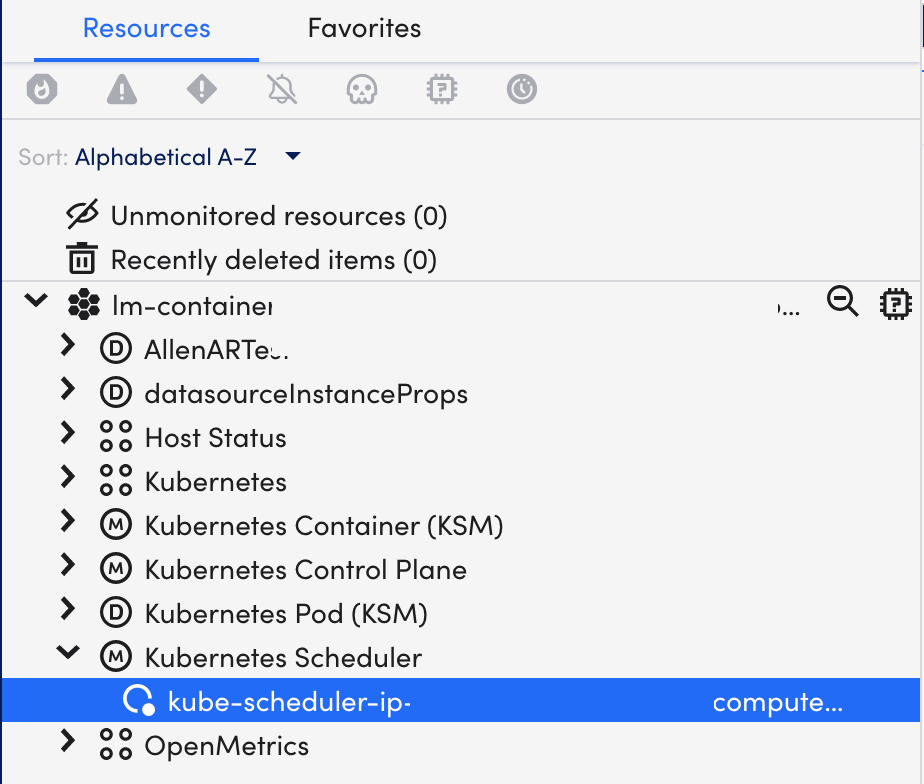
Viewing Kubernetes Scheduler Details
Once you have installed and configured the Kubernetes Scheduler on your server, you can view all the relevant data on the Resources page.
- In LogicMonitor, navigate to Resources > select the required DataSource resource.
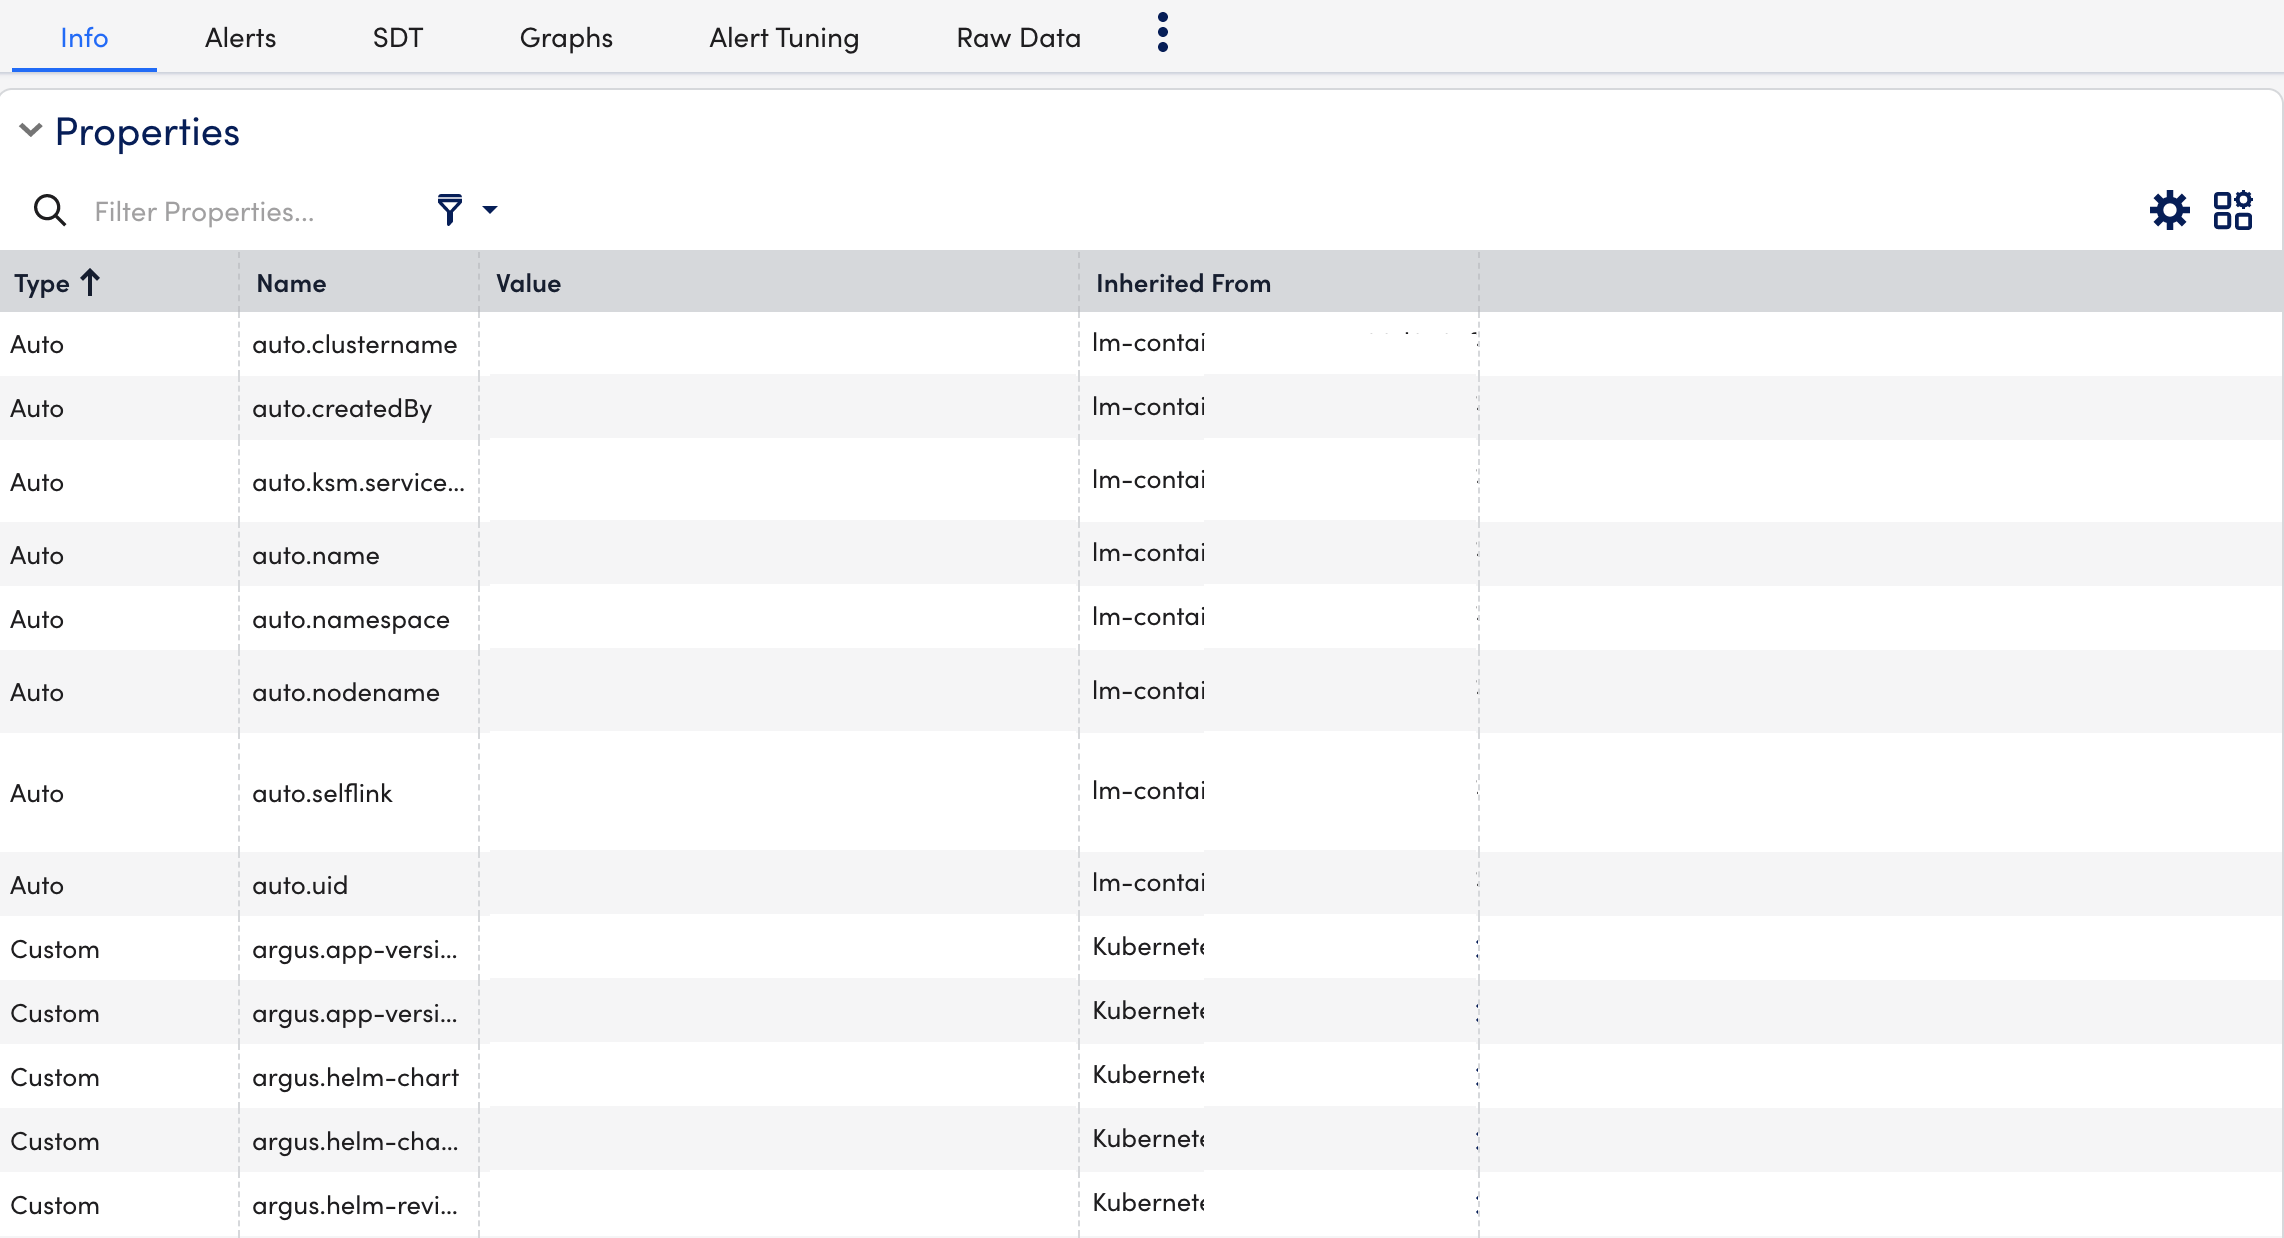
- Select Info tab to view the different properties of the Kubernetes Scheduler.
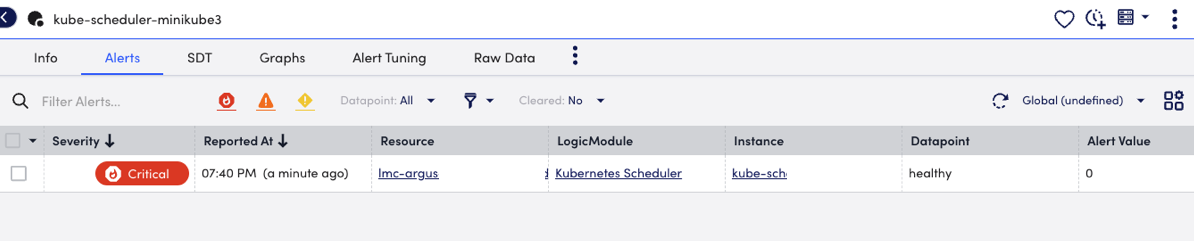
- Select Alerts tab to view the alerts generated while checking the status of the Kubernetes Scheduler resource.
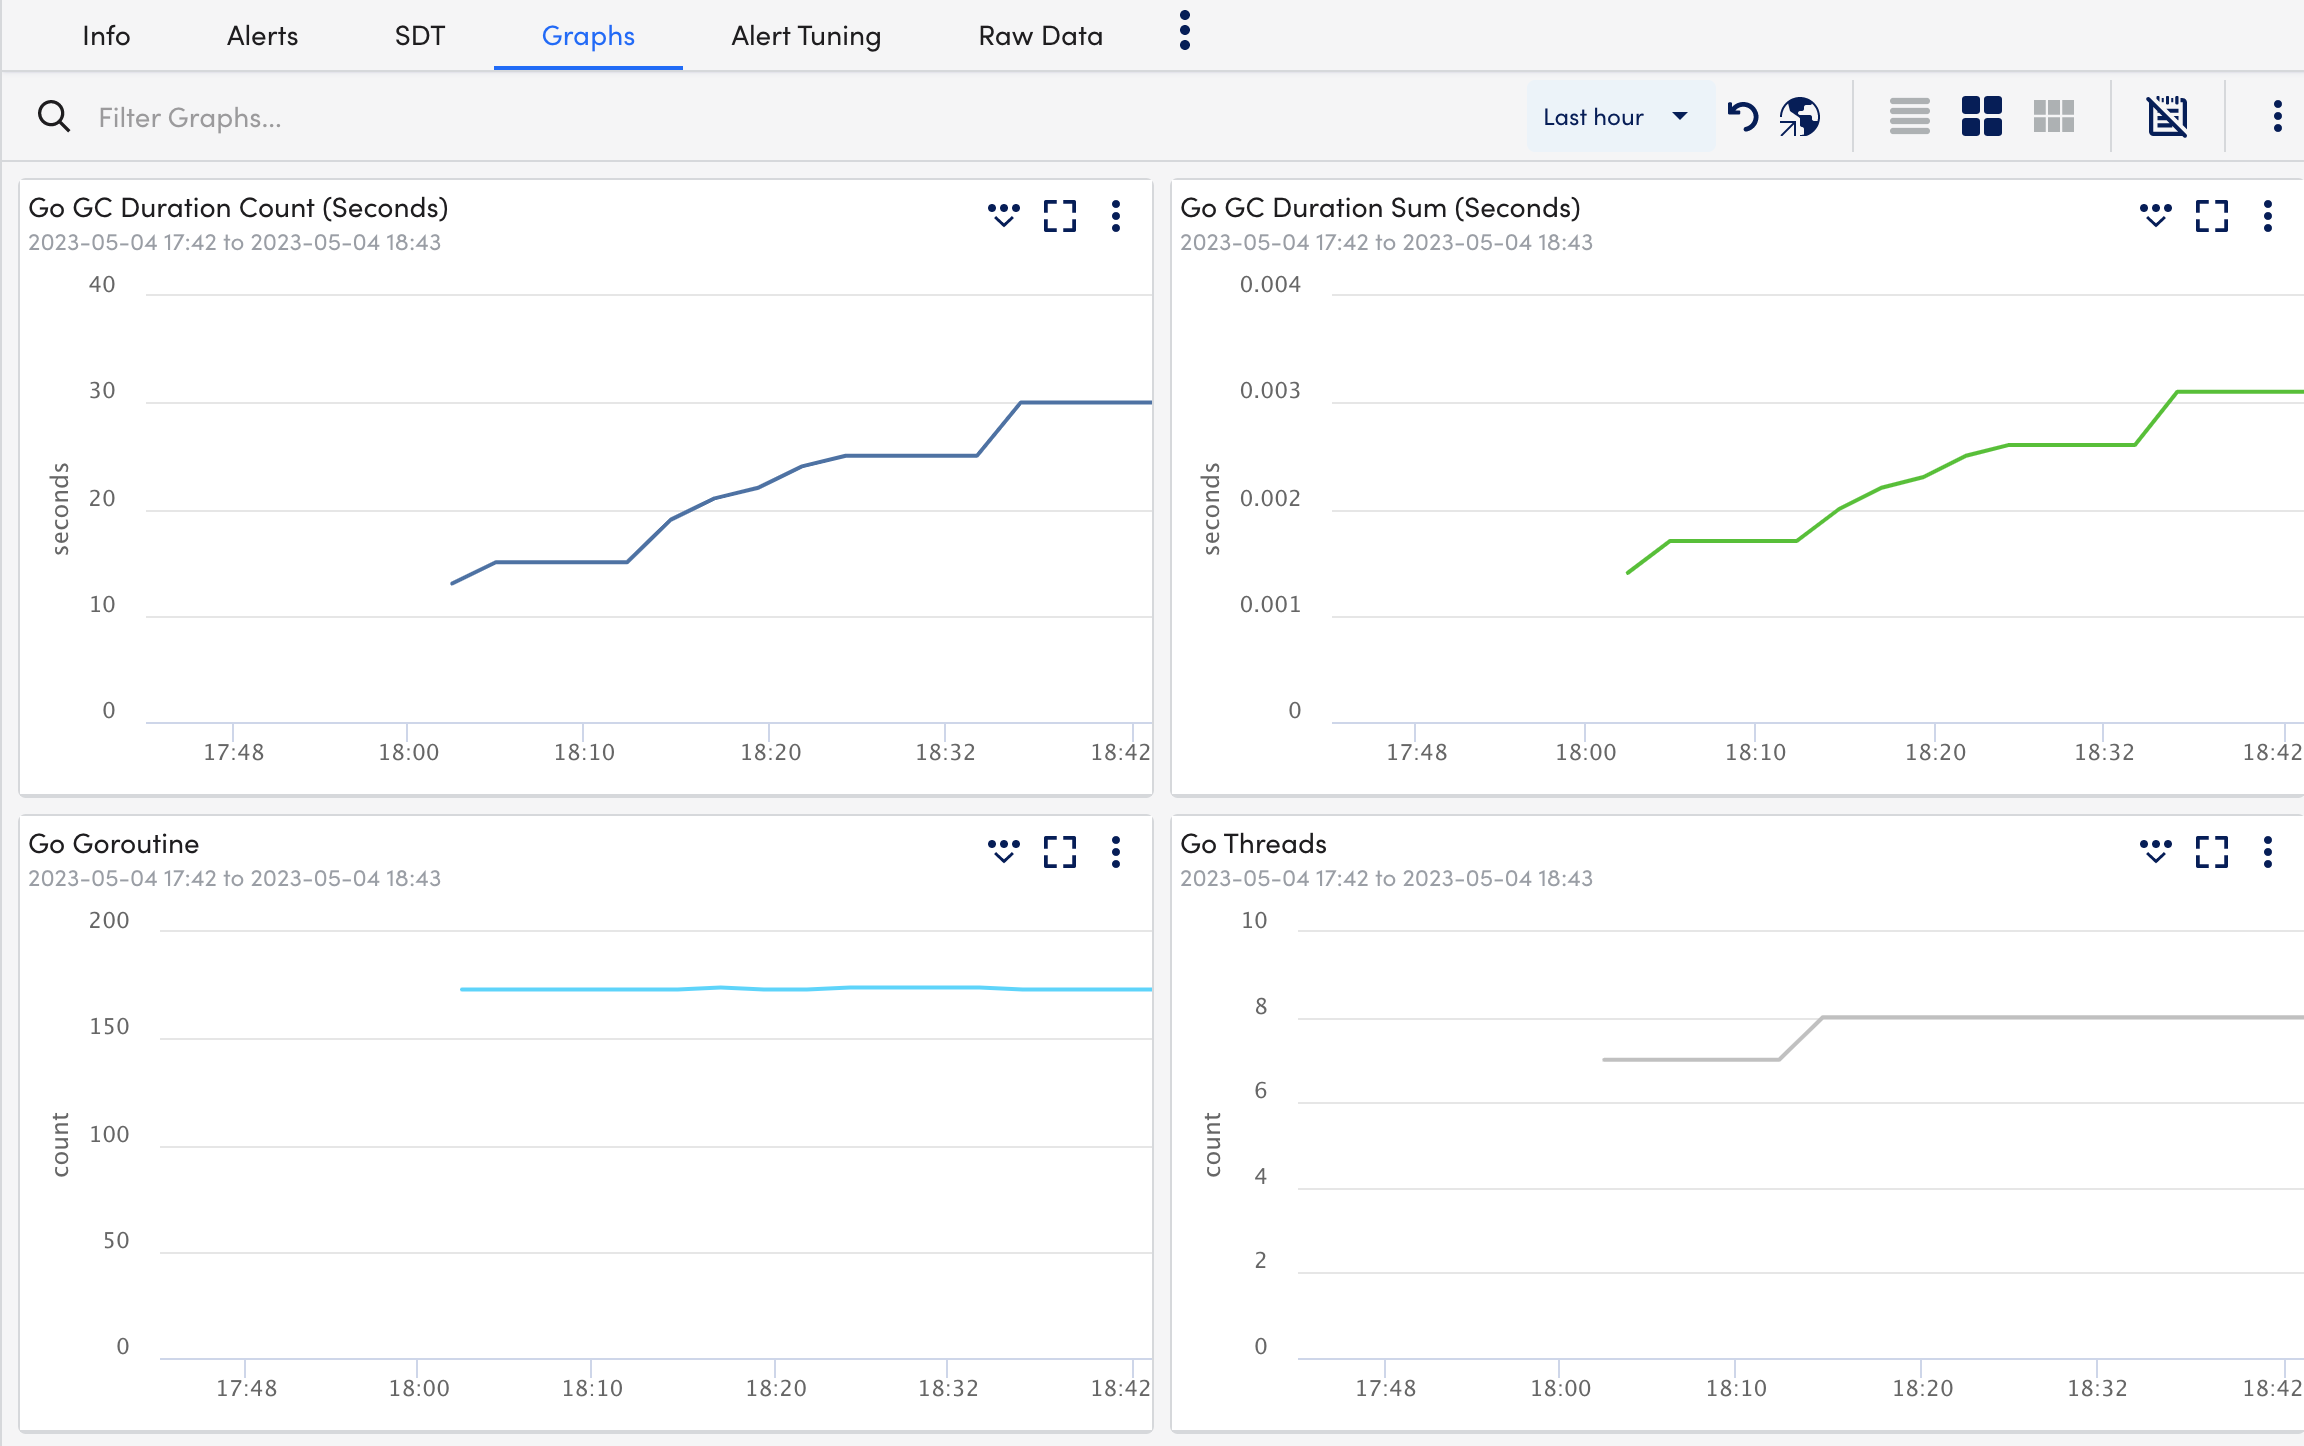
- Select Graphs tab to view the status or the details of the Kubernetes Scheduler in the graphical format.
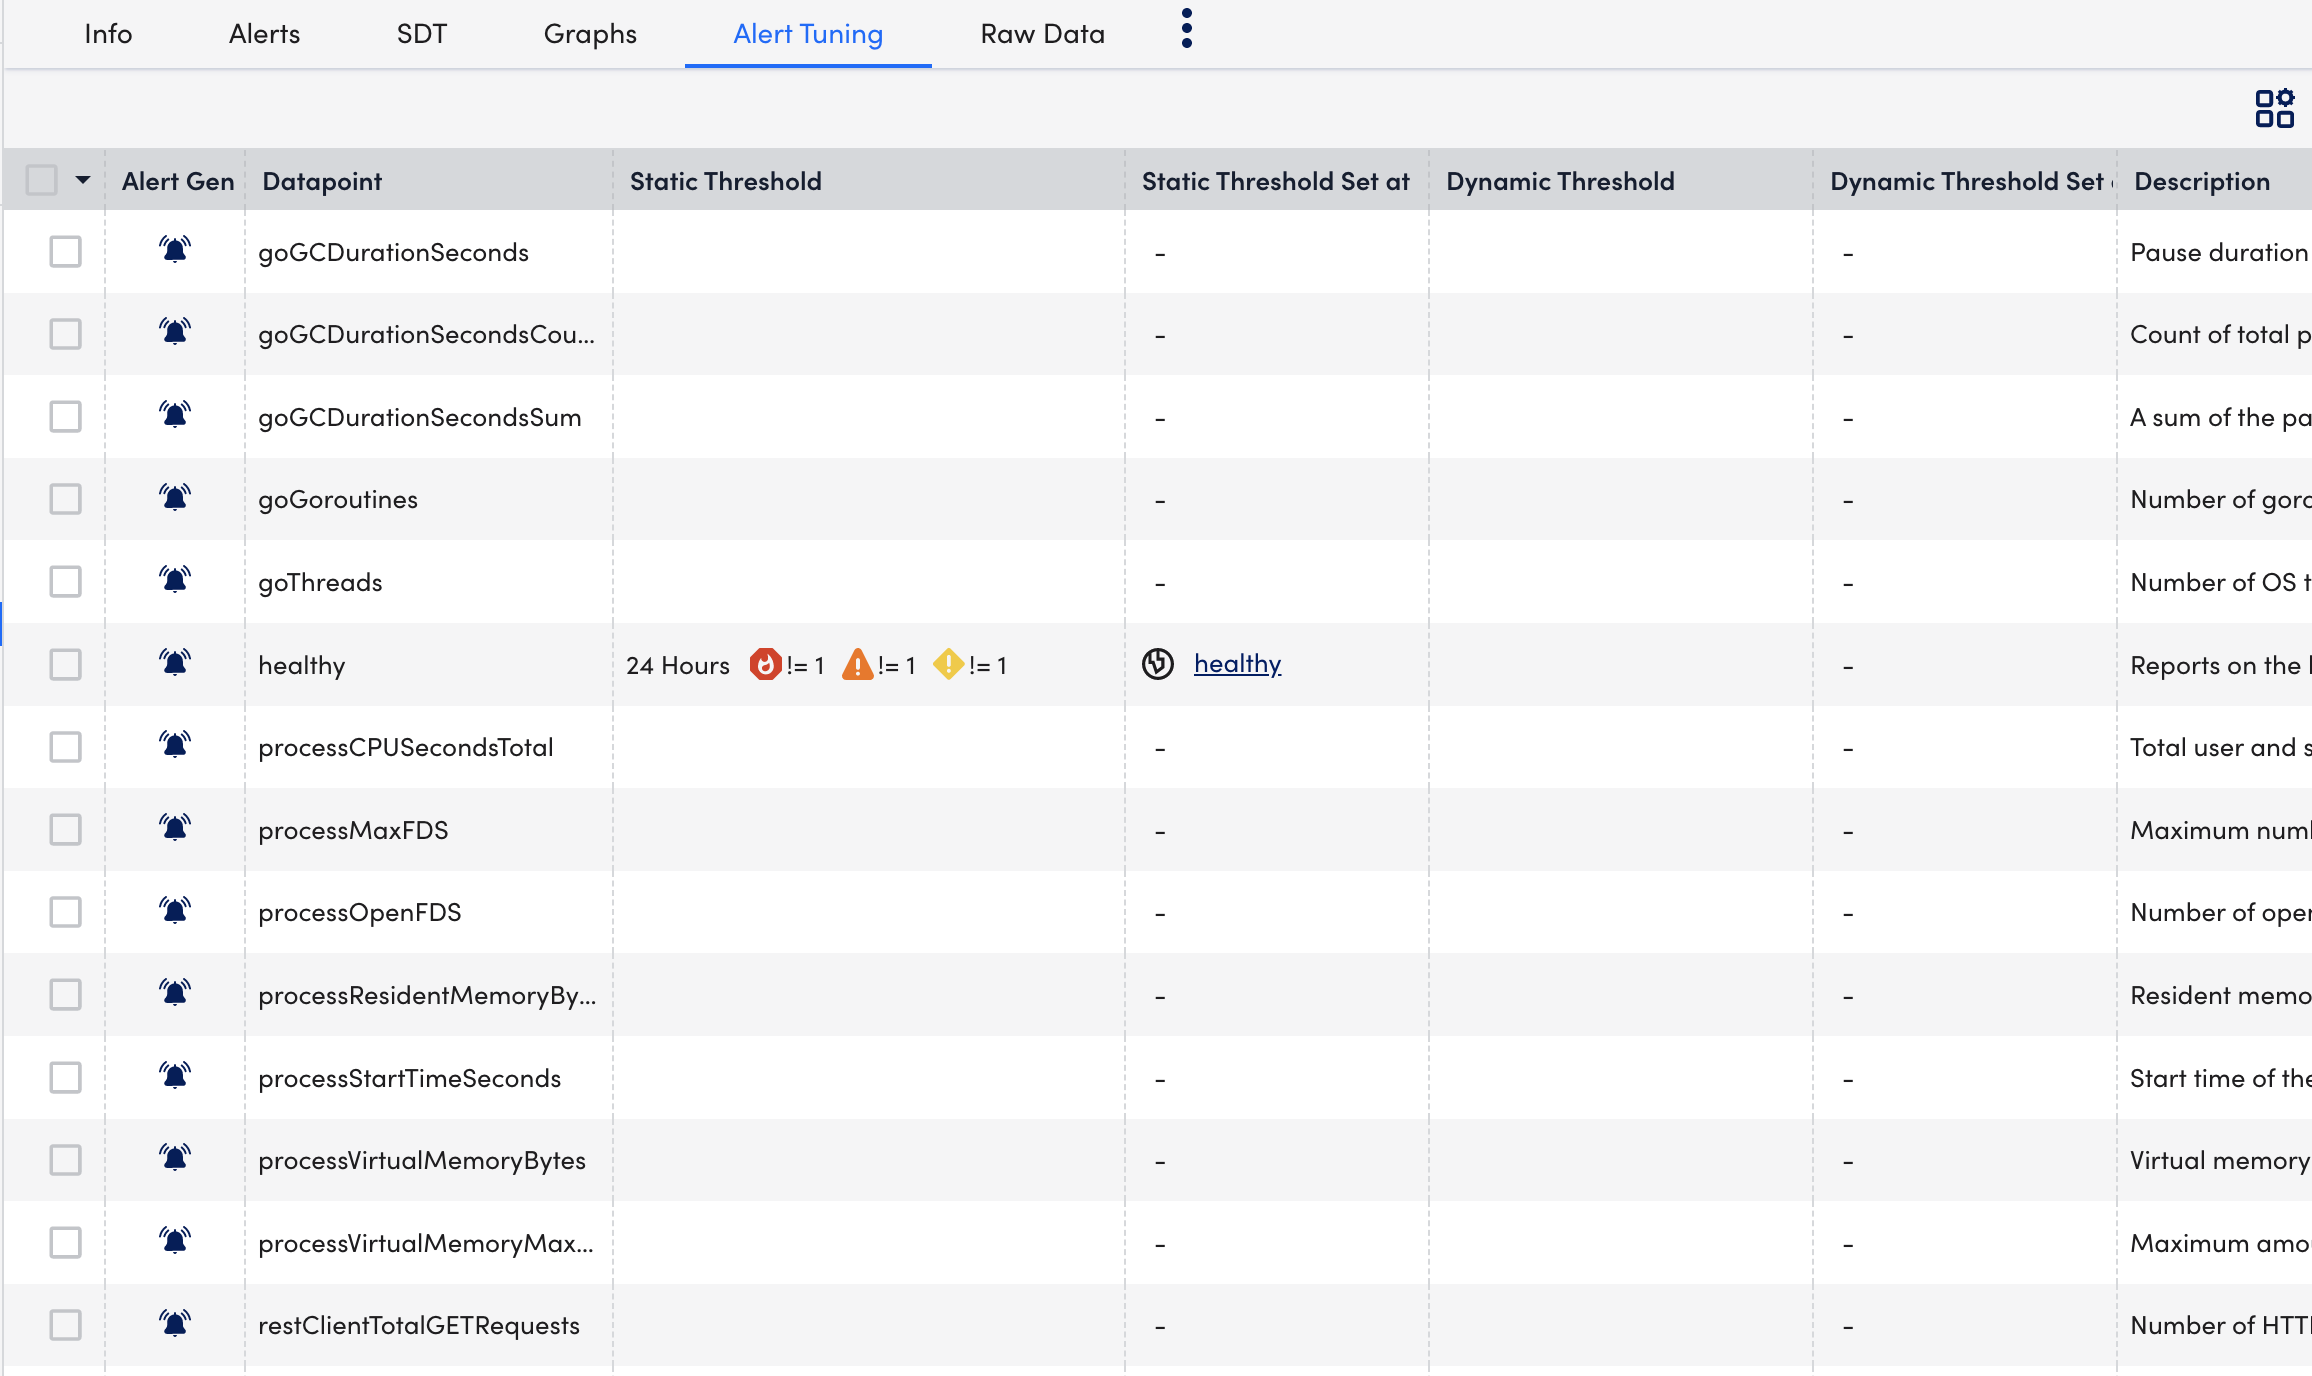
- Select Alert Tuning tab to view the datapoints on which the alerts are generated.
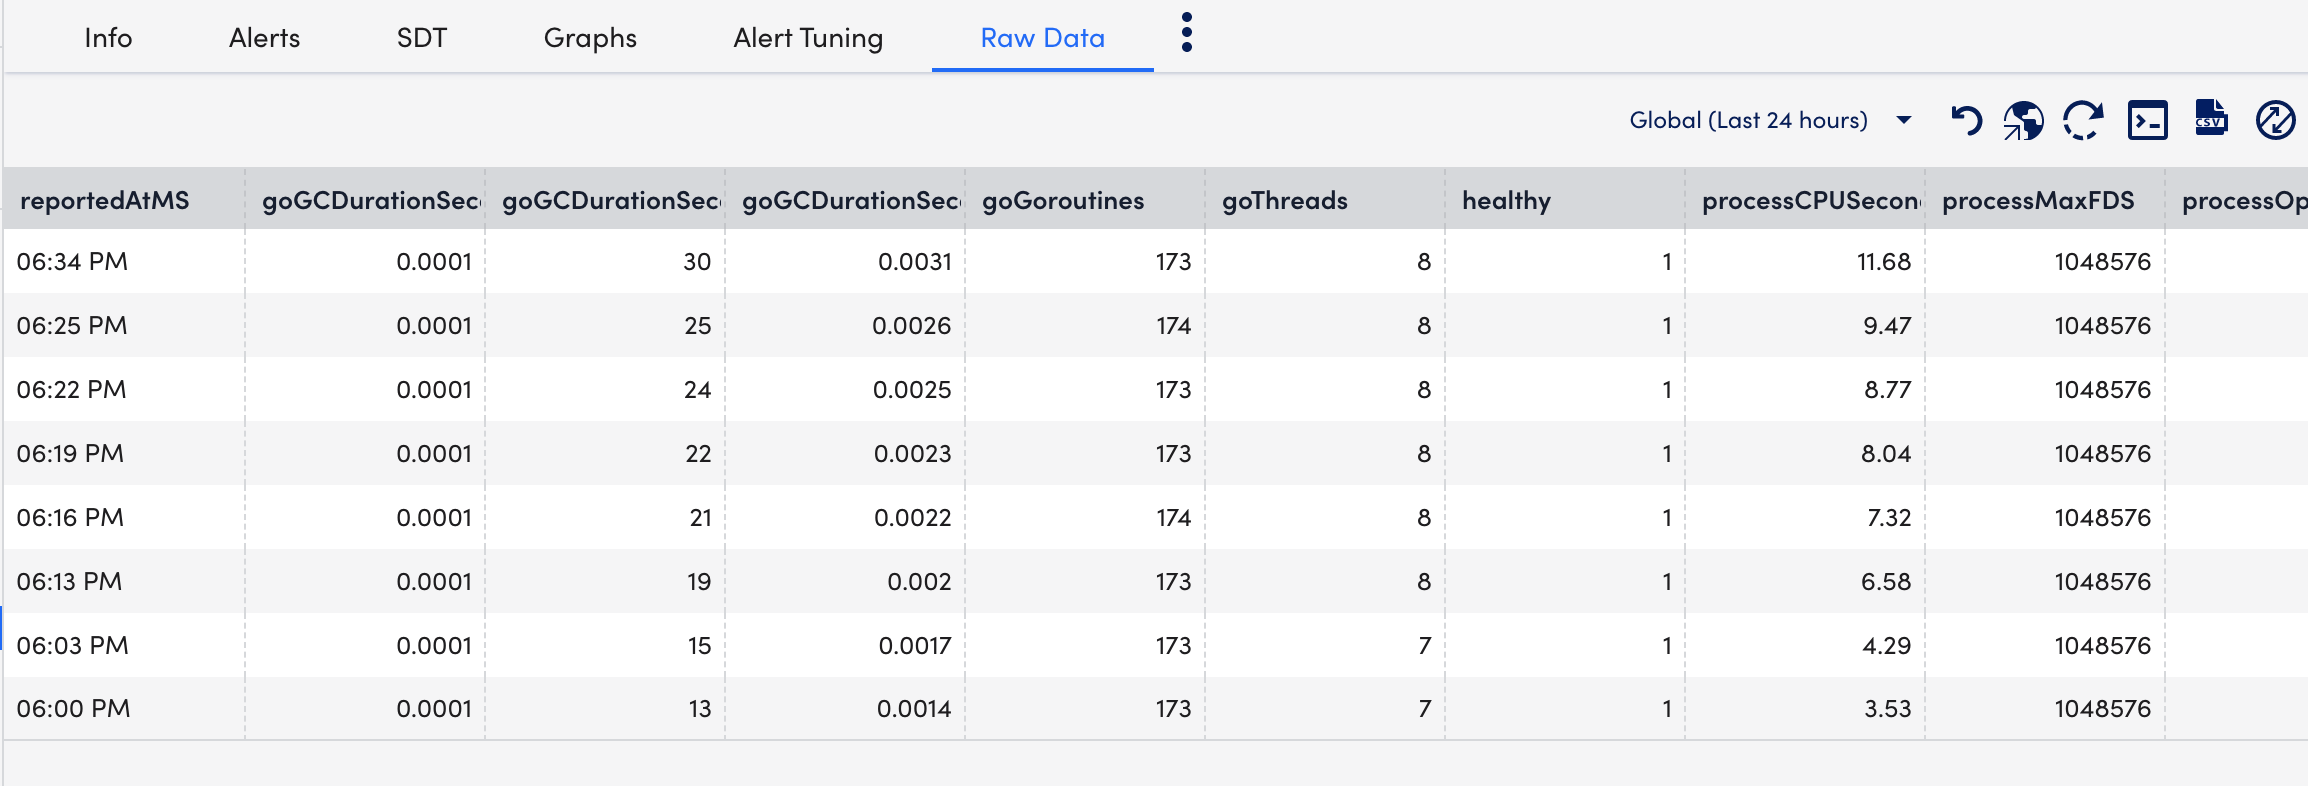
- Select Raw Data tab to view all the data returned for the defined for the instances.