
Collector Debug Facility
Last updated - 10 November, 2025
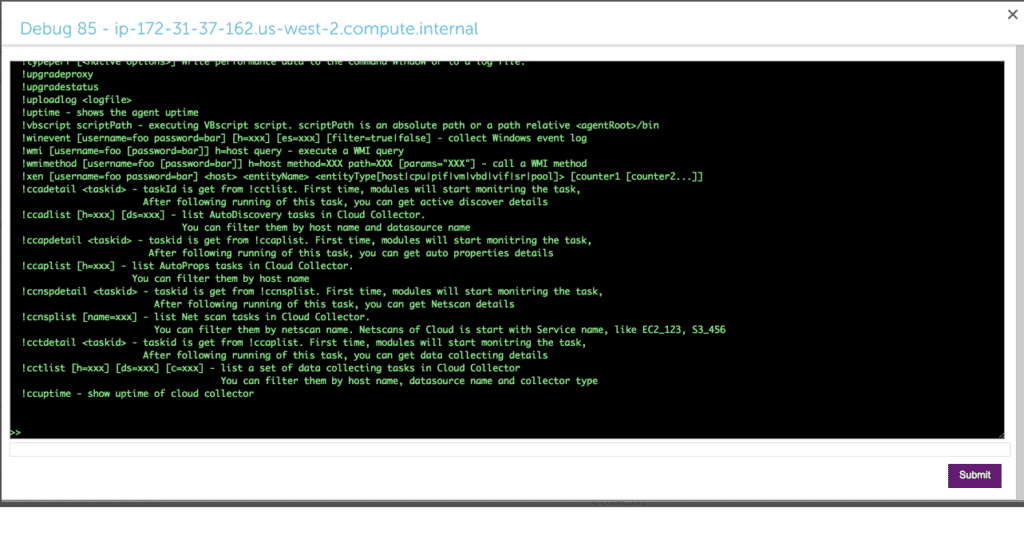
The Collector Debug Facility is a command-line interface (CLI) that you can use to remotely run debug commands on your Collector. This is helpful for troubleshooting issues with data collection. For example, if you wrote a script DataSource and are getting NaN values, or there is one instance out of ten not reporting data, you can run the Collector Debug Facility to identify the issue.
Note: The history of Collector debug commands is preserved in the Audit Log. For more information, see Audit Logs Report.
You can run the Collector Debug Facility from the Collector you want to debug, or you can navigate to the DataSource instance in Resources. When you run the Collector Debug Facility, it opens in a new tab and you can run the debug commands applicable to your environment. A list of the debug commands along with their descriptions displays in the Collector Debug Facility interface to assist with troubleshooting prior to entering the commands you need.
Debug Commands for the Collector Debug Facility
The following table lists the debug commands you can run in the Collector Debug Facility for troubleshooting:
| Command | Description | Example |
!account | Displays the account information used by sbwinproxy. | !account |
!adlist | Displays a list of the Collector’s Active Discovery tasks. A taskID is returned for each task. | !adlist type=get!adlist method=ad_snmp |
!adetail <taskId> | Displays detailed information about a specific Active Discovery task, where taskId can be found with !adlist. Note: The “taskId” reference in the command specification is labeled as “id” in the output of the | !adetail 142 |
!checkcredential | Enables, disables, and checks credential usage on the specified host to determine source of unexpected login action. | !checkcrendential proto=snmp user=public!checkcrendential proto=snmp user=public usage=AP |
!DecryptFileSHA | Gets the SHA256 values of all libraries, DLL and JAR files which are exported when a collector is installed.
| !DecryptFileSHA logicmonitor-util.jar |
!hostproperty | Adds, updates, or deletes system properties for a host. | hostproperty action=del host=localhost property=virtualization!hostproperty action=add host=localhost property=ips value=127.0.0.1,192.168.1.1 |
!http | Sends an HTTP request and displays the response. URL is required.!http [username=xxx [password=yyy]] [followRedirect=true|false] [method=GET| POST| PUT] [version=1| 1.1] [timeout=<seconds>] url [-h "<header json>"] [-b "<body json>"]The following are the optional arguments to display the response:
| !http http://www.google.com/index.html !http method=GET http://www.google.com/index.html!http method=POST http://www.google.com/index.html -h "{"Content-type": "application/json"}" -b "{"key" : "value"}"!http method=PUT http://www.google.com/index.html -h "{"Content-type": "application/json"}" -b "{"key" : "value"}" |
!jdbc | Executes a SQL query against the specified host. | !jdbc ‘url=jdbc:mysql://productrds.chqwqvn285rf.us-west-2.rds.amazonaws.com:3306 username=LogicMonitor password=MyPassword’ select Name, ID from productDB.Employees |
!logsurf | Displays log file entries that are of the specified debug level. If included, logs will only be displayed for the specified seq and taskId if they are in the specified file, and only n number of logs will be displayed. taskId and seq can be found using !tlist, where taskId is the id of a data collection task and seq is the number of times the collector remembers having done the task. | !logsurf level=trace ../logs/wrapper.log taskid=833 seq=75 |
!packetcapture2 | Captures the network traces of the device on which you are running this command. If you do not pass an argument in the !packetcapture2 command, the system displays the following components:
| !packetcapture2 interface=eth0 file=test.pcap timeout=1 "tcp and host 10.10.10.10 and port 443" |
!ping | Pings the specified host. | !ping 10.36.11.240!ping type=proxy 10.36.11.240 |
!restart | Restarts the specified Collector service. | !restart watchdog!restart collector |
!shealthcheck func=<function> collector=<collector_id> | !shealthcheck commands help you determine the health of Collector, memory consumed, and number of scheduled tasks. Based on the result, you can debug the issues and resolve them.func=trigger This debug command triggers a healthcheck task for a specific Collector. After you run this command, Santaba schedules a healthcheck task for the specified Collector. To view the result, you must run !shealthcheck command with function func=detail or func=show.func=show Typically, you will find a summary of the scheduled task in the result. It also indicates the number of total, finished, and skipped healthcheck tasks. For example, “Latest run has finished. Scheduled checks (total=34, finished=27, skipped=7)” In case an issue is detected, the issue is summarised in the result. For example, “The disk has a low free space 728.57 MBytes.” You can run !shealthcheck func=detail collector=<collector_id> debug command to know the details of the issue or get details of the health status of a Collector.func=detail This debug command provides status of all the scripts in detail. For example, “Collector exported jars and executables are not modified.” “The Collector has 177 instances.” After you run this command, Collector displays the result fetched by the func=trigger command. For example, for a specific Collector if you run the func=trigger command at 9.00 AM and then run func=detail at 11.00 AM, the Collector health status fetched at 9.00 AM is displayed. | !shealthcheck func=show collector=123!shealthcheck func=trigger collector=123!shealthcheck func=detail collector=123 |
!tdetail <taskId> | Displays detailed information about a specific data collection task, where taskId can be found with !tlist. | !tdetail 12323209239991 |
!tlist | Lists the Collector’s data collection tasks, including DataSources, ConfigSources, and EventSources. A taskID is returned for each task. You can narrow the list using the h=<hostname> and c=<collection type> options. | !tlist c=wmiNarrow the returned list: !tlist c=script |
!uptime | Displays the uptime of the Collector. | !uptime |
In addition, you can enter the following if you need the syntax for a particular command or usage details (for example, optional and mandatory arguments or parameters) and examples, replacing commandname with the applicable command:
help !<commandname>Requirements for Running the Collector Debug Facility
To run the collector debug facility, you need a user with “Debug” permission for Settings. For more information, see Settings Role Permissions.
To run commands using the Collector Debug Facility, the command must be preceded by the following syntax:
!Running the Collector Debug Facility
- Do one of the following depending on where you want to run the Collector Debug Facility from:
- To run the Collector Debug Facility from the Collector’s settings, do the following:
- In LogicMonitor, navigate to Settings > Collectors.
- Select Manage for the Collector you want to debug from the list of Collectors.
The Collector’s settings display in a panel.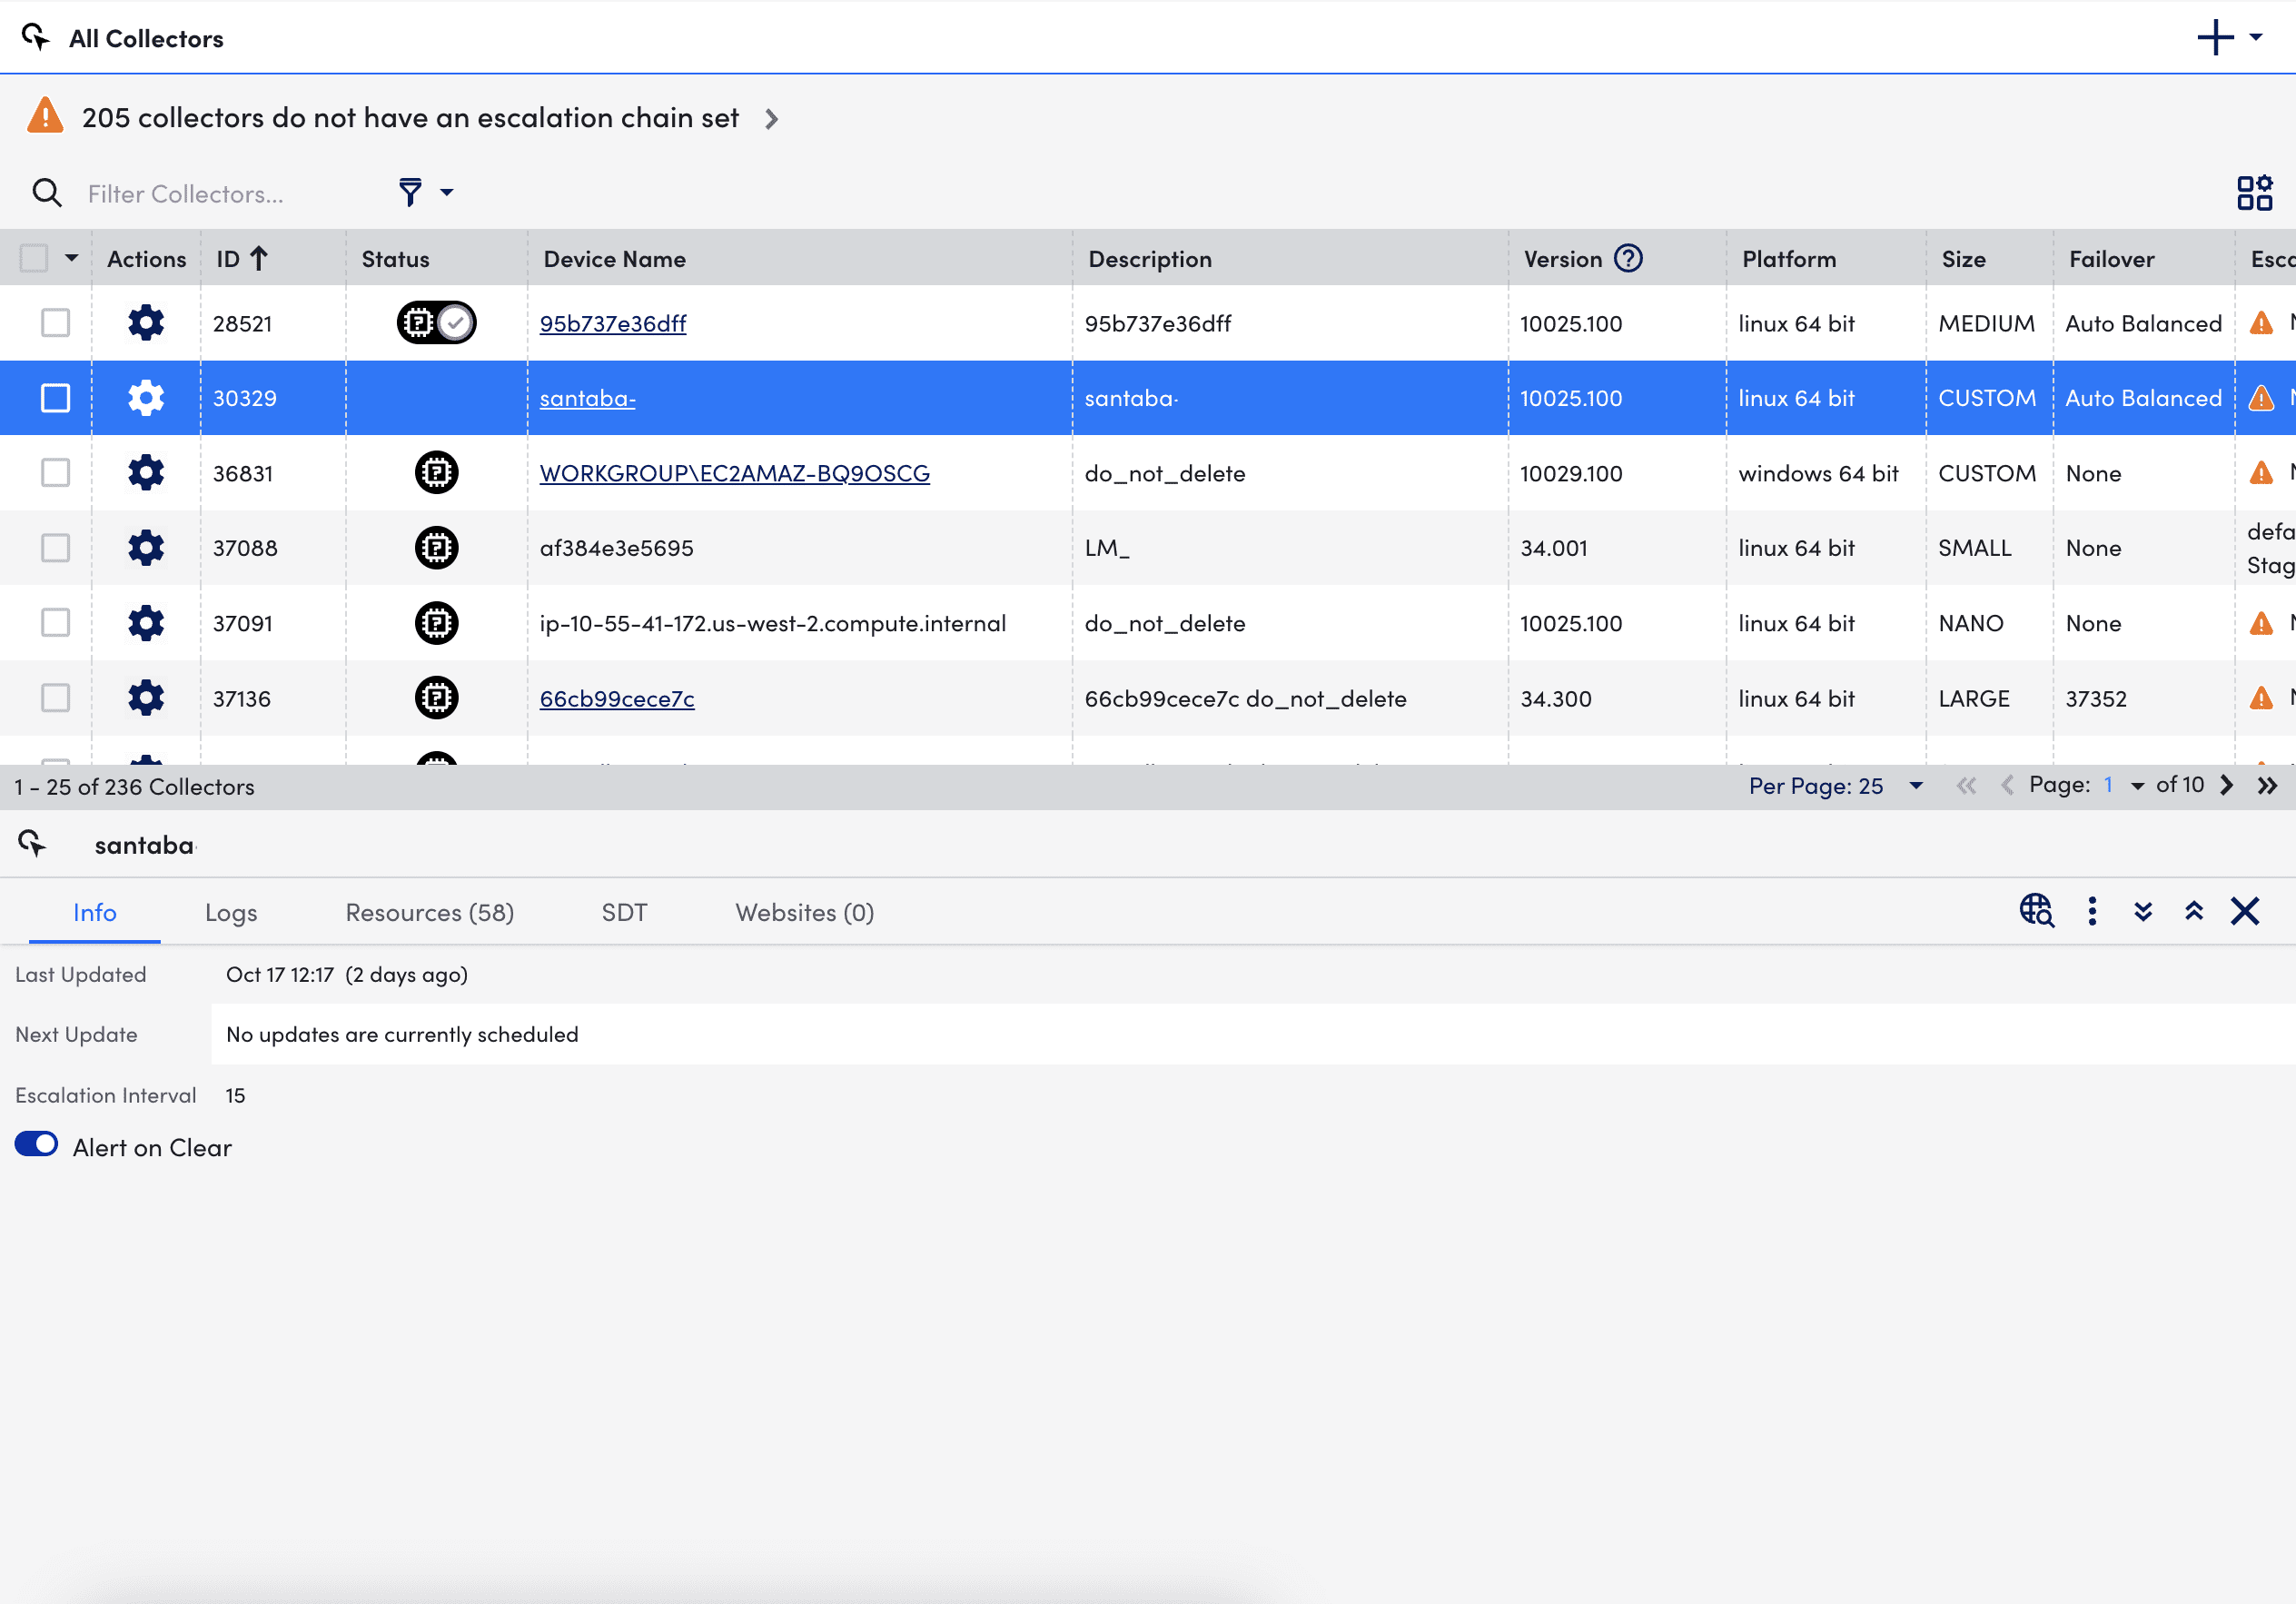
- Select More
 in the settings panel, and then select “Run Debug Command”.
 - Select Confirm when prompted.
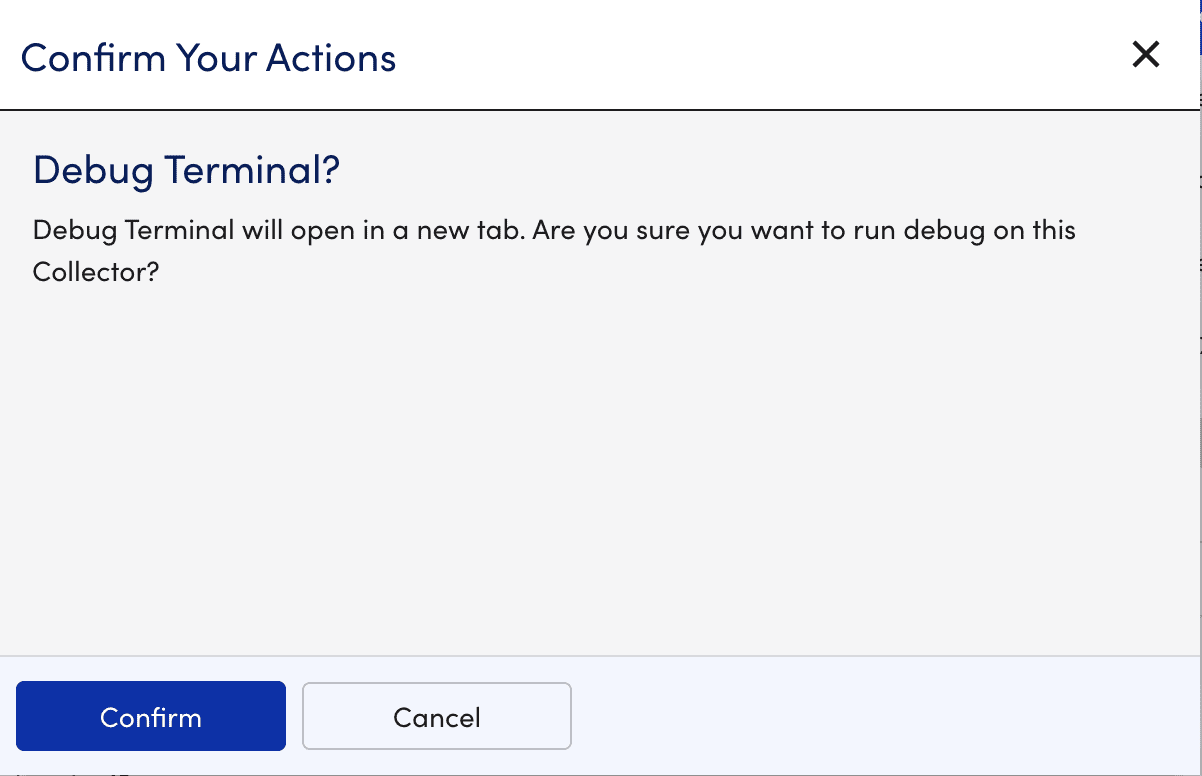
The Collector Debug Facility opens in a new tab.
- To run the Collector Debug Facility from the DataSource in Resources, do the following:
- In LogicMonitor, navigate to Resources > Resources Tree, and select the DataSource or Datasource instance you want to debug.
- On the Raw Data tab, select Open Debug Window.
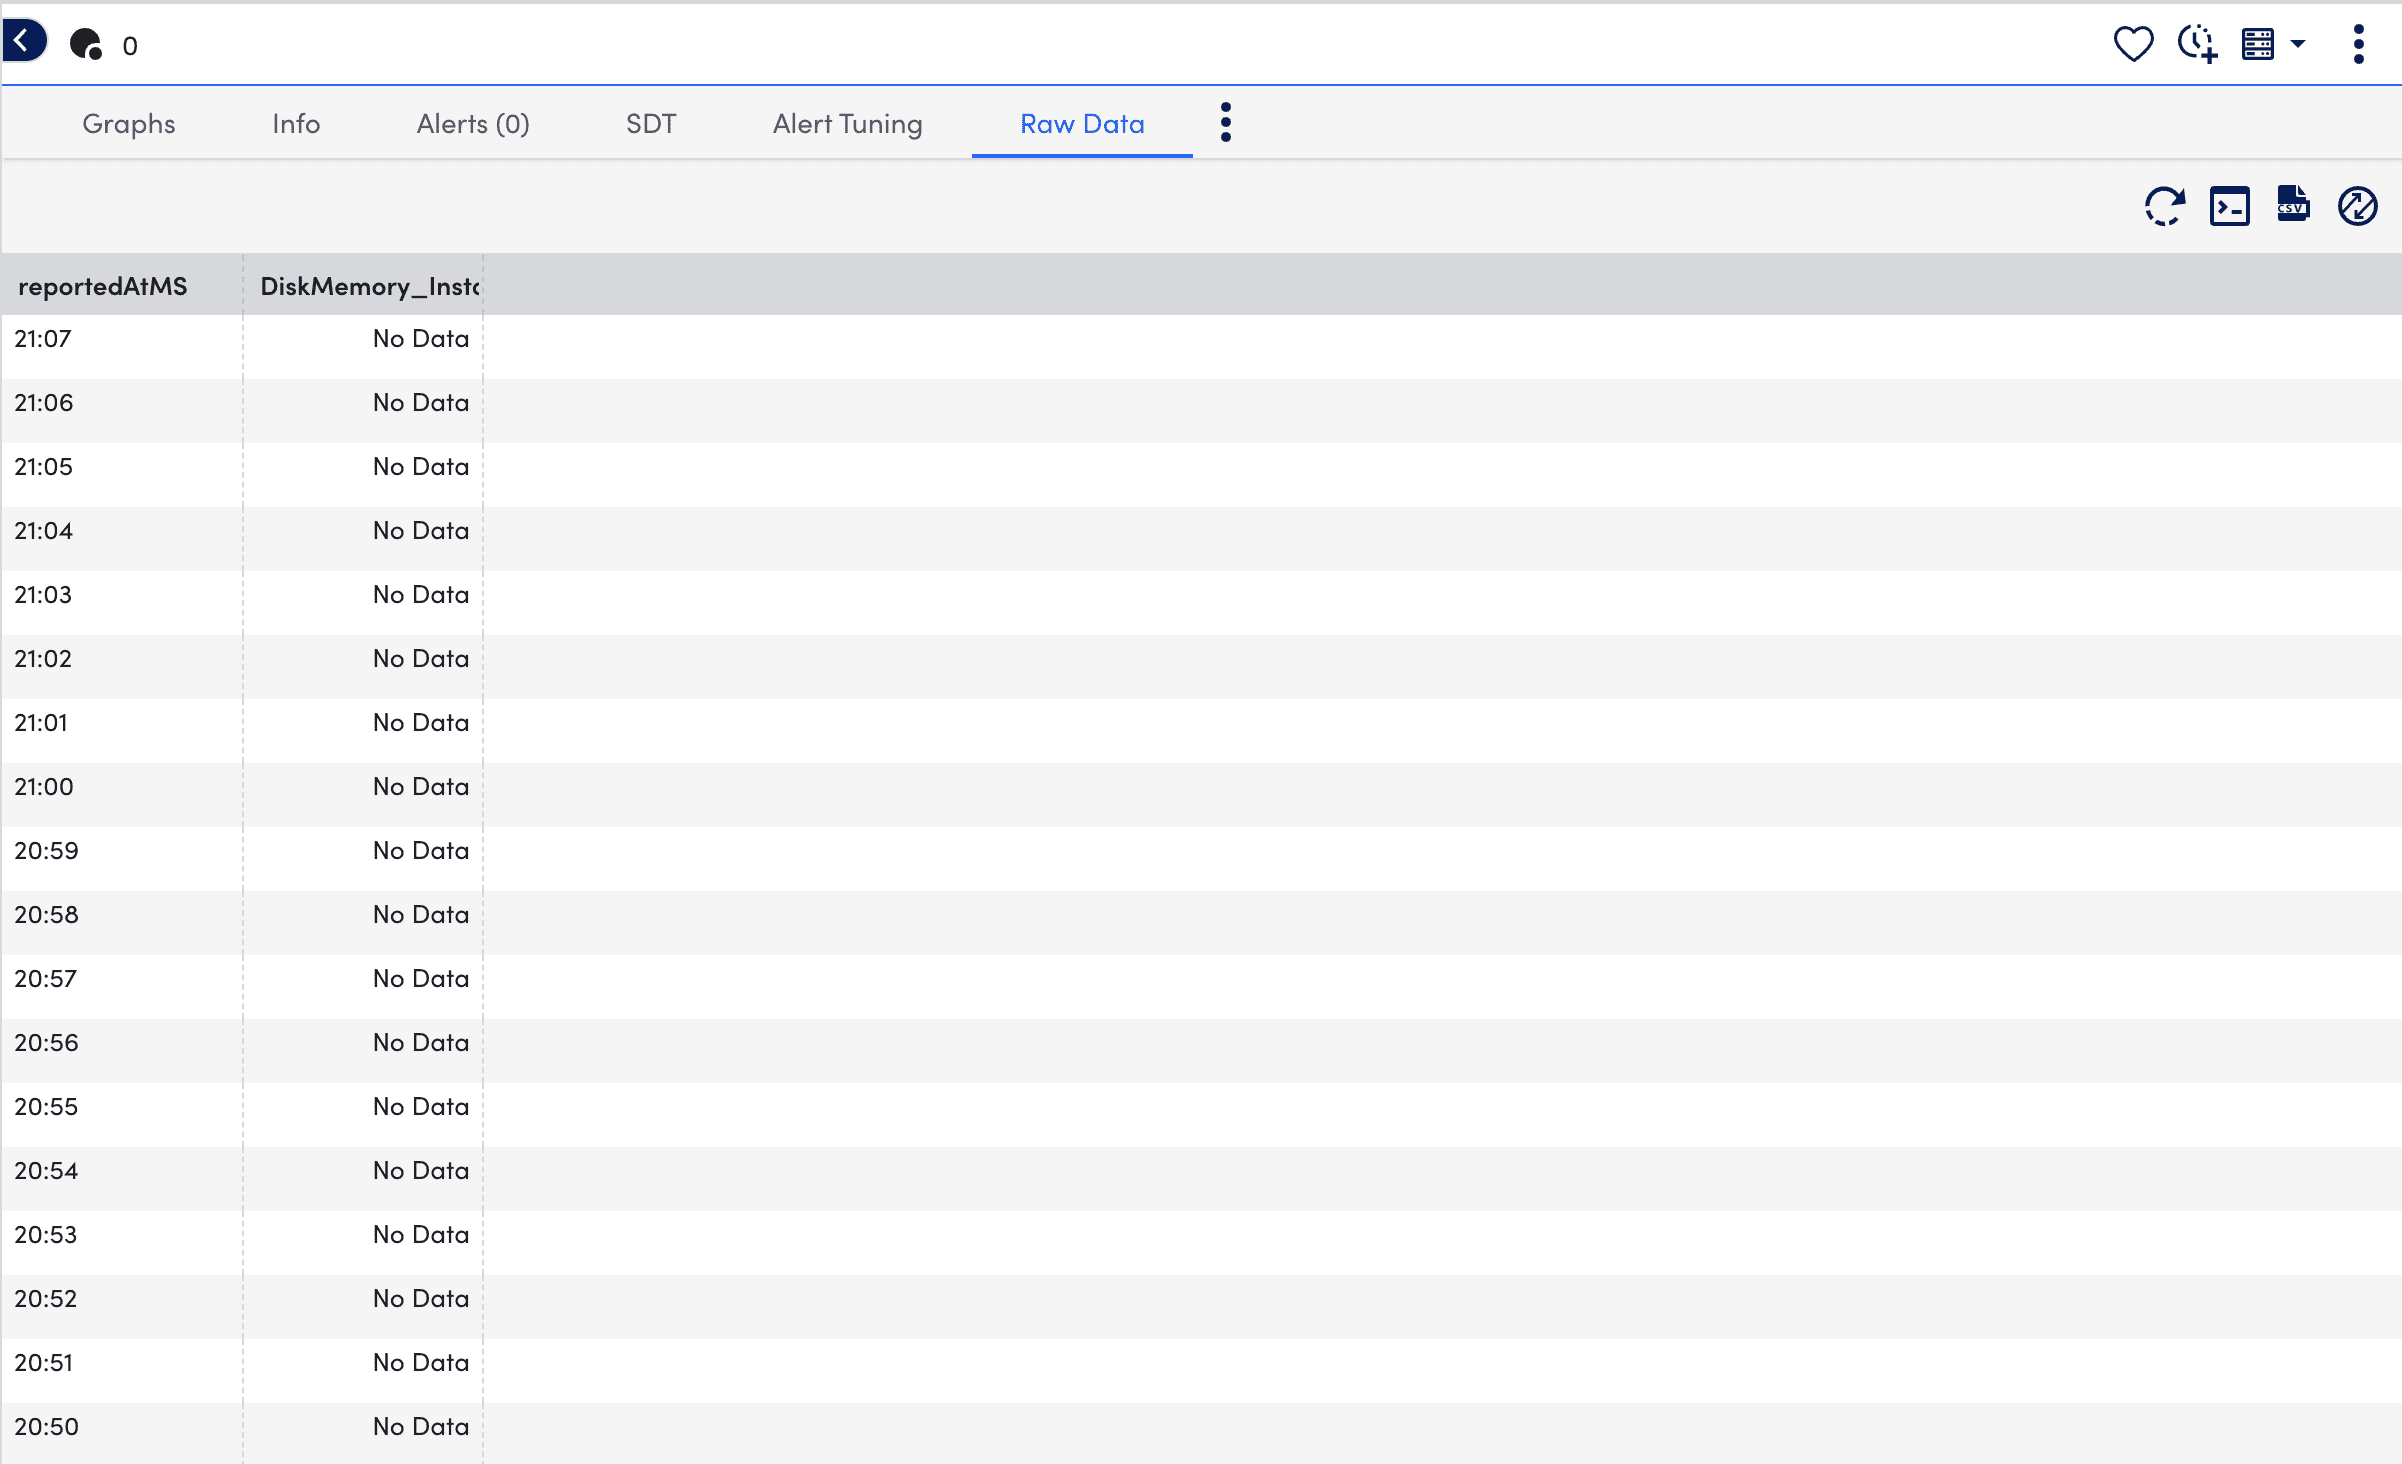
The Collector Debug Facility opens in a new tab.
- To run the Collector Debug Facility from the Collector’s settings, do the following:
- Enter the applicable commands in the Collector Debug Facility.
For example, use the!tlistcommand to list the Collector’s data collection tasks, including DataSources, ConfigSources, and EventSources.
For more information, see Debug Commands for the Collector Debug Facility.
Recommendations:
- If you need more information to diagnose the problem, increase the log level for the appropriate collection method of the Collector. For more information, see Collector Logging.
- Waiting a polling cycle or more can return more information.
