
Log Anomaly Detection
Last updated - 17 March, 2026
Monitored resources generate large volumes of log data. Anomaly detection identifies data that does not conform to expected patterns. Anomaly detection is a way to gain insight into resource behavior, allowing you to potentially catch issues before they escalate into more severe events.
The LogicMonitor Logs anomaly detection process channels log events into a pipeline analyzing structure patterns to determine whether incoming log events have been seen before. This gives you a curated overview of new and changed log events in your IT environment.
The following describes how anomaly detection works for LM Logs. For log anomaly detection in the LM platform in general, see Anomaly Detection Visualization.
What is a Log Anomaly?
Anomalies are changes in log data that falls outside of the normal patterns identified. LM Logs detects anomalies based on the log event structure that it parses, and changes in frequency or any stops in periodic log events.
LM Logs analyzes and learns the structure of incoming events and builds a library of profiles for each event. An event can only relate to one profile. A profile can relate to more than one (but similar) events. New incoming events are matched against the learned profiles to determine whether they have been seen before or are new anomalies.
Event Profiles
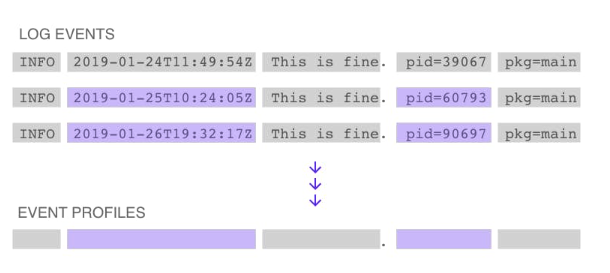
Log events are individual lines in log data. Event profiles are records of each log event’s structure with information about the log event’s origins, counts, arrival times, and frequency patterns.
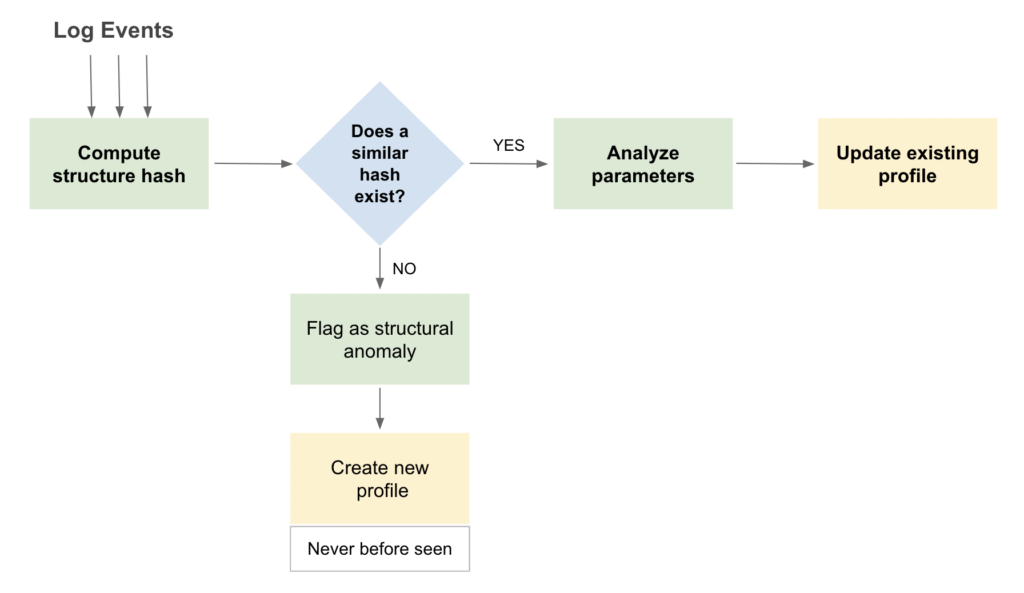
As log events come in, LM Logs identifies their structure in a process referred to as tokenization. This breaks down the message content into a sequence of words and punctuation, and computes a hash that is unique for each log event’s structure. This structure hash is used to determine if incoming log events match previously seen profiles on that resource.
Each new structure hash is compared against existing structures to check if a match exists in the profile database for each resource. If the new hash does not match an existing one, LM Logs creates a new profile in the database, and flags this event as a structural anomaly of type Never before seen. LM Logs “learns” and continuously updates event profiles as more data is received.
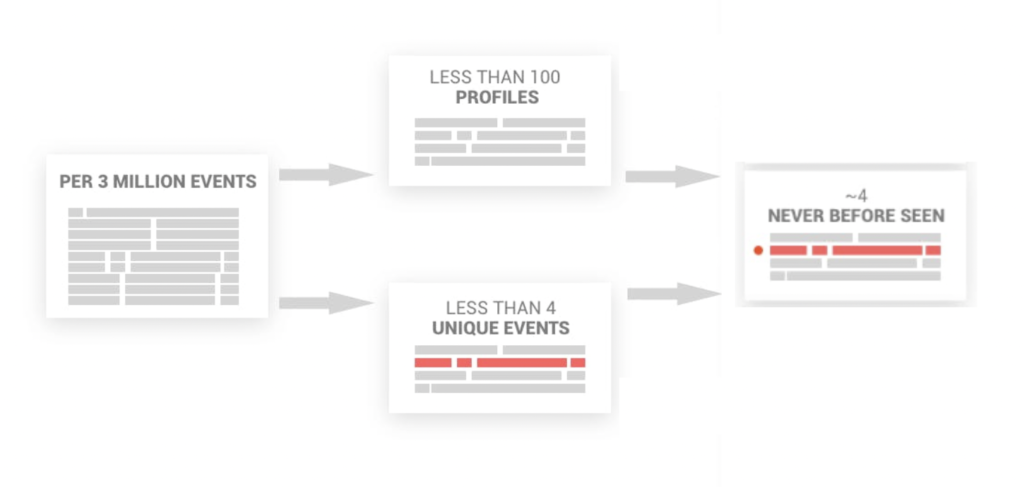
The majority of log events have the same or similar structure. Another part of the tokenization process identifies the dynamic parameters of the structure and merges similar profiles into a single aggregated profile with dynamic parameters. The result of this merge may reduce the amount of data to analyze by at least 99%.
Recognizing Log Anomalies
The profiles database makes it possible to quickly determine when incoming log events are new or different from previously seen events. Log events that don’t match existing structures are immediately flagged as a structural anomaly.
Structural Anomalies
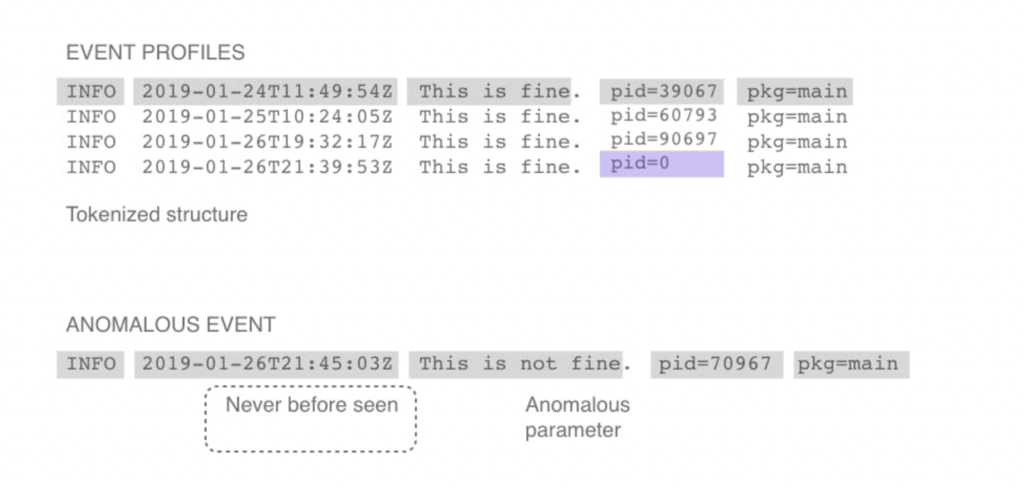
Structural anomalies are new or significantly changed log events that do not fit into the established pattern of log event structures that LM Logs has learned. These may be events with profiles that have not been detected in the system or in the entire IT infrastructure. The Never before seen is a structural type of anomaly that triggers on events that are new in the monitored resources.
Managing Log Anomalies
There are certain types of log events or anomalies that you may want to “keep visible” and always track and take action on. This can be for example errors or exceptions that should notify to be resolved immediately.
In these cases you can create a log pipeline and add alert conditions, to track an event after LM Logs has learned it. Log pipelines are a series of processing steps executed on log events that match a certain set of filters. Once you have defined filters for the logs you want to track, you can define other processing steps, such as setting alert conditions on them.
When an incoming log event matches a defined filter, LM Logs flags the event based on the alert conditions you assign to it. For example, you can define an alert condition to highlight a critical event each time it occurs, or to ignore the event.
Note: LM Logs is a service that looks for anomalies, it does not automatically produce alerts. Alerts are only generated based on thresholds you define using Log Processing Pipelines.
Managing log anomalies includes tasks as described in the following.
Viewing Log Anomalies
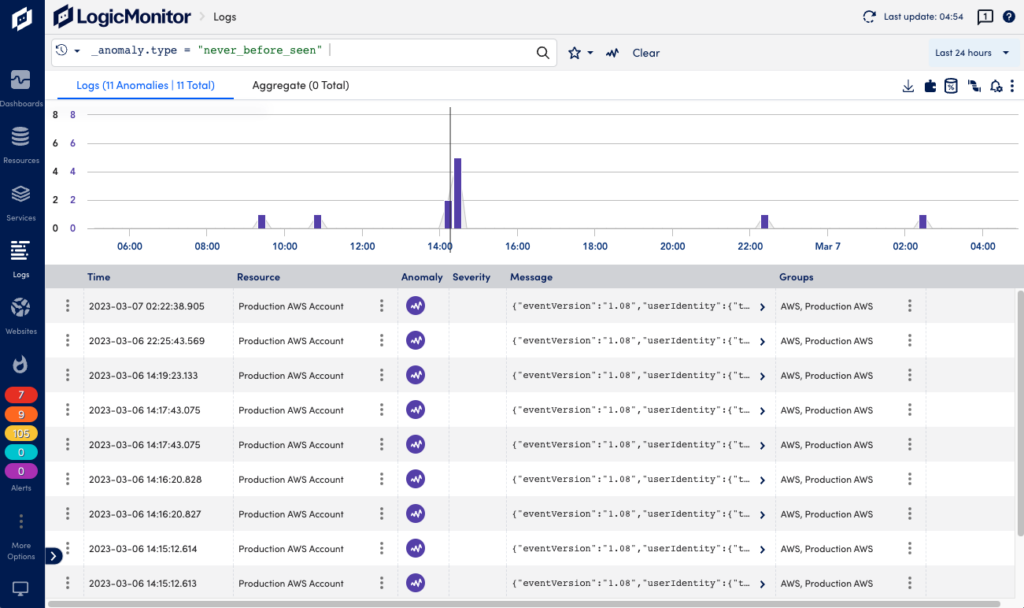
You can see log anomalies in the Logs page where you can explore raw logs and log anomalies across your infrastructure. The Anomaly button in the search bar adds anomalies to the query. If there are anomalies in the logs, these show up as purple in the graph.
You can also access log anomalies from the Graphs tab on the Alerts page where they are displayed contextually with metric alerts to help speed troubleshooting. Note that a log anomaly doesn’t automatically create an alert in the alerts tab. For an alert to be created, you need to create a pipeline and alert condition. For more information, see Reviewing Logs and Log Anomalies.
Note: Note: Anomaly detection for logs is based on the service (resource.service.namespace) and namespace (resource.service.name) keys. If these keys are not present in the ingested log event, anomaly detection will not be done.
Tracking Specific Log Events and Anomalies
If LM Logs repeatedly sees a log event, the log event becomes part of the learned events and will no longer be highlighted. In some cases where the log event is important enough to track, you can create a Log Pipeline with alert conditions and contextual information for solving the issue. For more information, see Log Processing Pipelines and Log Alert Conditions.
Monitoring Log Alerts
The Alerts page displays all alerts from across your entire LogicMonitor account. This includes alerts not only from logs, but also from various devices and resources, websites, and services that are part of your IT environment. For more information, see Managing Alerts from the Alerts Page.
Escalating Log Alerts
Escalation chains let you define how LM Logs responds to log alert triggers and conditions. When a resource in your IT environment goes offline, or when a production environment produces significant anomalies, you want LM Logs to take action. This can for example be to send an email to a user, to post to a team chat room, or to flag the event for you to review later. For more information, see Escalation Chains.
