
OpenTelemetry Collector for LogicMonitor Overview
Last updated – 01 June, 2026
LogicMonitor leverages OpenTelemetry to provide a pre-configured, wrapped version of an OpenTelemetry Collector to forward traces from your instrumented applications to the LogicMonitor platform. You can install, upgrade, configure, and monitor an OpenTelemetry collector as a native resource in your LogicMonitor portal. OpenTelemetry Collectors can optionally be deployed between instrumented applications and the Telemetry backends as a Telemetry pipeline component. With an OpenTelemetry collector, Telemetry signals can be ingested in multiple formats, translated to OpenTelemetry native pdata format, and finally exported to backend native formats.
You can use a wizard in your LogicMonitor portal to install an OpenTelemetry Collector on Windows, Linux, Docker, or Kubernetes.
Note: There may be scenarios in your environment where you want to forward traces directly to LogicMonitor without using an OpenTelemetry Collector. For more information, see Trace Data Forwarding without an OpenTelemetry Collector.
The following diagram illustrates how the OpenTelemetry Collector receives, processes, and exports trace data from instrumented applications to LogicMonitor:
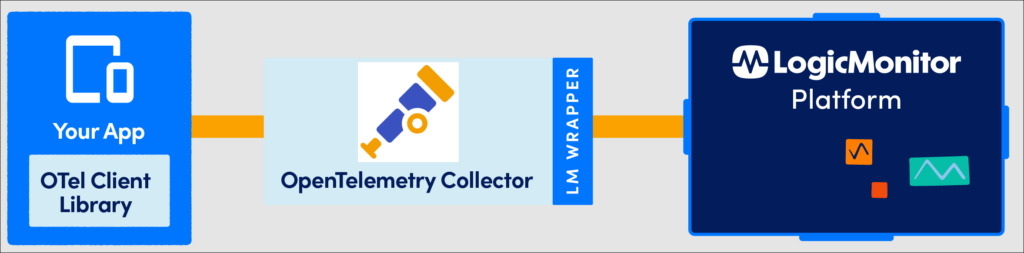
The OpenTelemetry Collector consists of the following main components that you can modify in the OpenTelemetry Collector’s configuration file:
- Receiver—Receivers get the data into the Collector. Receivers can be push-based and pull-based. Generally, a receiver accepts data in a specified format, translates it into the internal format, and passes it to processors and exporters defined in the applicable pipelines. The format of the traces and metrics supported is receiver-specific.
- Processor—Processors process the data before sending it out to the exporters. Processors can be used to transform the metrics or modify the name of the span. You can also configure the processor to batch data before sending it out, retry in case the exporting fails, add metadata, and tail-based sample.
- Exporter—Exporters export the data to multiple open-source backends and commercial backends. For example, a debug exporter can be used to export the data to the console output, while a file exporter can be used to dump the data to the file.
A combination of a receiver, processor, and an exporter can set traces, metrics, and logs pipelines.
The OpenTelemetry Collector’s configuration also includes the following components that are not part of the pipeline:
- Extension—This is an additional, optional component of the OpenTelemetry Collector. Extensions provide capabilities on top of the primary function of the Collector. Extensions do not require direct access to Telemetry data and are mostly used for managing and monitoring an OpenTelemetry Collector.
- Service—This is used to enable the components that are configured within receivers, processors, exporters, and extensions. The service section consists of extensions and pipelines. The extensions consist of a list of all of the extensions to enable. Pipelines can be of traces, metrics, and logs type and consist of a set of receivers, processors, and exporters. Each receiver/processor/exporter must be defined in the configuration outside of the service section to be included in a pipeline.
After you install an OpenTelemetry Collector, you can use LogicMonitor to manage the Collector. This includes viewing the status, managing settings, and deleting it from LogicMonitor. For more information, see Managing OpenTelemetry Collectors.
The following is an example configuration of an OpenTelemetry Collector:
receivers:

  hostmetrics:

    collection_interval: 5m

    scrapers:

      cpu:

      disk:

      filesystem:

      memory:

      network:

  prometheus:

    config:

      scrape_configs:

        - job_name: “Test-Job”

          scrape_interval: 5m

          static_configs:

          - targets: ["0.0.0.0:8888"]

  otlp:

    protocols:

      http:

      grpc:

processors:

  batch:

  memory_limiter:

    check_interval: 60s

    limit_mib: 200

  tail_sampling:

    decision_wait: 10s

    num_traces: 10000

    policies:

      [

         {

            name: sample_error_http,

            type: numeric_attribute,

            numeric_attribute: {key: http.status_code, min_value: 300, max_value: 500}

         },

         {

            name: sample_error_grpc,

            type: numeric_attribute,

            numeric_attribute: {key: rpc.grpc.status_code, min_value: 1, max_value: 16}

         }

      ]

  probabilistic_sampler:

    sampling_percentage: 20

exporters:

  lmexporter:

    url: https://${LOGICMONITOR_ACCOUNT}.logicmonitor.com/rest

  file:

    path: ./fileout.json

extensions:

  lmextension:

    properties:

       system.categories: lmotel

  health_check:


service:

  extensions: [lmextension,health_check]

  pipelines:

    traces:

      receivers : [ otlp ]

      processors: [batch]

      exporters : [lmexporter]

    metrics:

      receivers: [prometheus, hostmetrics]

      exporters: [lmexporter]
