
Data Monitored for Websites
Last updated – 25 July, 2025
The metrics collected for a website depend on whether the website is monitored by a Web Check or Ping Check. You can view the collected data in the Website’s Graphs and Raw Data tabs.
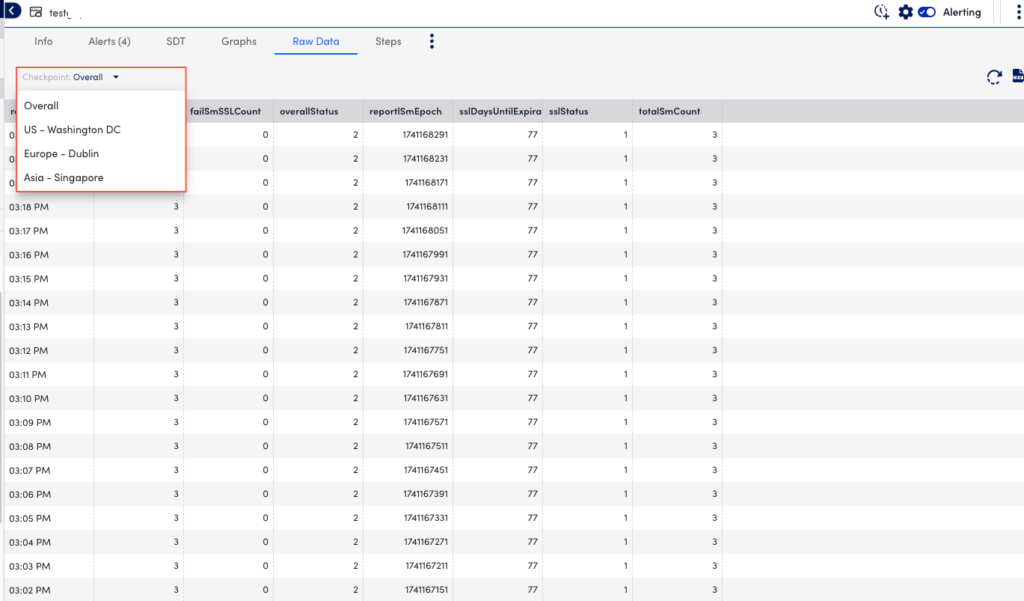
The Websites page displays the Web Check or Ping Check data based on the following checkpoints:
- Per-checkpoint basis—Displays the data for the selected checkpoint locations
- Overall checkpoint basis—Displays the overall aggregated data per polling interval derived from the responses from different individual checkpoints
Note: In addition to viewing website metrics on the Graphs and Raw Data tabs for a website, you can also view these metrics from your dashboards. For more information on adding website metrics to your dashboards, see Widget Overview.
Data Monitored for Web Checks
For each checkpoint configured in your Web Check (whether an external LogicMonitor checkpoint or internal Collector), the following data is monitored:
- Response time—The time (milliseconds) it takes to run the entire Web Check is available per checkpoint location, both visually in graph form on the Graphs tab (Response Time graph) and as columnar data on the Raw Data tab.
- Status—The status of the Web Check (okay and timeout) is available per checkpoint location, both visually in graph form on the Graphs tab (Status graph) and as columnar data on the Raw Data tab. For more information on various status codes LogicMonitor returns for Web Checks, see Understanding Website Status Codes.
- Read time—The total time (milliseconds) spent reading all data sent back by the server, from the first to the last byte. This data is available per checkpoint location, both visually in graph form on the Graphs tab (Initial Connection Performance graph) and as columnar data on the Raw Data tab. Only the read time for the first step of a Web Check is collected.
- Wait time—The server-side process delay (milliseconds). This data is available per checkpoint location, both visually in graph form on the Graphs tab (Initial Connection Performance graph) and as columnar data on the Raw Data tab. Only the read time for the first step of a Web Check is collected.
- SSL handshake time—The time (milliseconds) spent negotiating the SSL handshake, including certificate exchange and validation. This data is available per checkpoint location, both visually in graph form on the Graphs tab (Initial Connection Performance graph) and as columnar data on the Raw Data tab. Only the read time for the first step of a Web Check is collected.
- SSL status—The status of the website’s SSL environment (okay and expired certificate) is available per checkpoint location as columnar data on the Raw Data tab. For a description of the various status codes LogicMonitor returns for SSL status, see Understanding Website Status Codes.
- SSL days until expiration—The number of days remaining until the SSL certificate expires, relative to the current date (sslDaysUntilExpiration).
- Connect time—The time (milliseconds) required to establish the socket connection, including the SYN/ACK negotiation. This data is available per checkpoint location, both visually in graph form on the Graphs tab (Initial Connection Performance graph) and as columnar data on the Raw Data tab. Only the read time for the first step of a Web Check is collected.
- DNS resolve time—The time (milliseconds) required to resolve the DNS, including the time required to contact the DNS server if necessary. This data is available per checkpoint location, both visually in graph form on the Graphs tab (Initial Connection Performance graph) and as columnar data on the Raw Data tab. Only the read time for the first step of a Web Check is collected.
- First byte read time—The server-side process delay (in milliseconds). This data is available per checkpoint location, both visually in graph form on the Graphs tab (Initial Connection Performance graph) and as columnar data on the Raw Data tab (firstByteReadTime). Only the read time for the first step of a Web Check is collected.
- External resources—Total number of external resources and media links (externalResources). Applicable only when Wait for all page elements to load is configured.
- Broken external resources—Number of broken external resources and media links (brokenExternalResources). Applicable only when Wait for all page elements to load is configured.
- Full page load time—Time taken in milliseconds to entirely load the page (fullPageLoadTime). Applicable only when Wait for all page elements to load is configured.
In addition to viewing data on a per-checkpoint basis, there are a few metrics offered that provide a view into the health of the Web Check overall (aggregated across all checkpoint locations):
- Overall status—If no checkpoint locations return an error, LogicMonitor returns an overall status code of “1.” If an error at one or more checkpoints is detected, LogicMonitor returns an overall status code of “2.” Overall status is available both visually in graph form on the Graphs tab (Website Overall Status graph) and as columnar data on the Raw Data tab. To get more specific information about an overall status error, you’ll need to review the Web Check status codes for the individual test locations.
- Overall SSL status— If no checkpoint locations return an SSL error, LogicMonitor returns an overall status code of “1.” If an error at more than one checkpoint is detected, LogicMonitor returns an overall status code of “2.” Overall SSL status is available as columnar data on the Raw Data tab. To get more specific information about an overall SSL status error, you’ll need to review the status codes for the individual test locations.
- Total site monitor count—The number of checkpoints that participated in the check. This count is available as columnar data on the Raw Data tab (totalSmCount).
- Failed site monitor count—The number of checkpoints that failed in the check. This count is available as a columnar date on the Raw Data tab (failSmCount).
- Reporting timestamp—The timestamp (seconds) when the site monitor reported the data. This count is available as a columnar date on the Raw Data tab (reportlSmEpoch).
Data Monitored for Ping Checks
For each checkpoint configured in your Ping Check (whether an external LogicMonitor checkpoint or internal Collector), the following data is monitored:
- Trace route—In the Trace Route tab, you can see the list of host names or IP addresses test packets are routed through from the originating test checkpoint to the destination host name or IP address (live data capture only for troubleshooting purposes; trace route information is not stored for historical purposes).
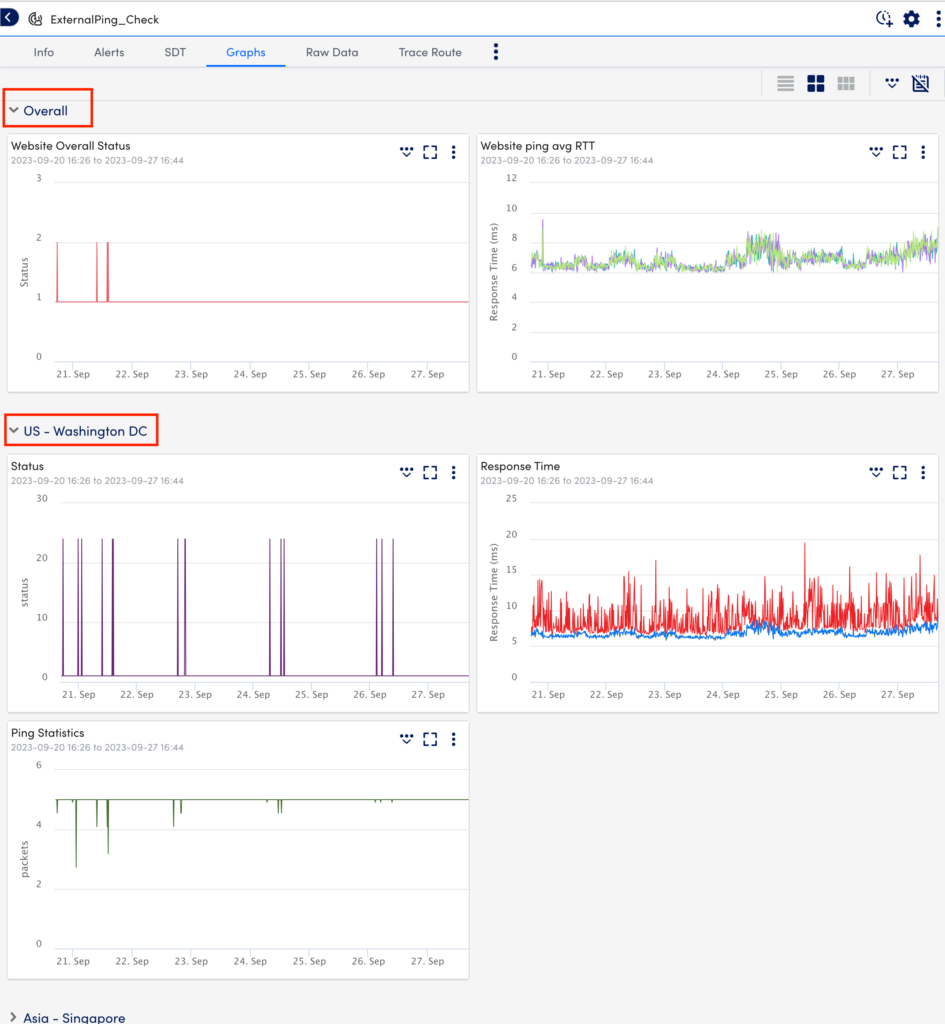
- Status—The status of the Ping Check (okay and DNS failure) is available per checkpoint location, both visually in graph form on the Graphs tab (Status graph) and as columnar data on the Raw Data tab. For more information on the various status codes LogicMonitor returns for Ping Checks, see Understanding Website Status Codes.
- Maximum, minimum, and average round trip times—The maximum, minimum, and average round trip times (RTT) for packets in the Ping Check are available per checkpoint location, both visually in graph form on the Graphs tab (Response Time graph) and as columnar data on the Raw Data tab.
- Number of sent and received packets—The number of packets sent and received in the Ping Check is available per checkpoint location, both visually in graph form on the Graphs tab (Ping Statistics graph) and as columnar data on the Raw Data tab.
In addition to viewing data on a per-checkpoint basis, there are a few metrics offered that provide a view into the health of the Ping Check overall (aggregated across all checkpoint locations):
- Overall status—If no checkpoint locations return an error, LogicMonitor returns an overall status code of “1.” If an error at more than one checkpoint is detected, LogicMonitor returns an overall status code of “2.” Overall status is available both visually in graph form on the Graphs tab (Website Overall Status graph) and as columnar data on the Raw Data tab. To get more specific information about an overall status error, you’ll need to review the Ping Check status codes for the individual test locations.
- Total site monitor count—The number of checkpoints that participated in the check. This count is available as columnar data on the Raw Data tab (totalSmCount).
- Failed site monitor count—The number of checkpoints that failed in the check. This count is available as a columnar date on the Raw Data tab (failSmCount).
- Reporting timestamp—The timestamp (seconds) when the site monitor reported the data. This count is available as a columnar date on the Raw Data tab (eportlSmEpoch).
LogicMonitor’s External Testing Locations
LogicMonitor has several testing locations you can use for Web Checks and Ping Checks. These checkpoints are part of the SiteMonitor service and are intended to provide you with details about access to your website externally.
Recommendation: You will get better test information if you are not explicitly watching for traffic from a given IP address. For this reason, do not directly add the IP addresses of these location to your allow list as they are likely to change more frequently than the other server addresses.
If you find that you need to restrict pages to SiteMonitor requests, the best options are as follows:
- Look for the user-agent “LogicMonitor SiteMonitor/1.0”. This is used by all SiteMonitor requests.
- Set your own custom header while formulating the Web or Ping check and filter on that.
If you need to explicitly allow access to the list of IP addresses SiteMonitor may check from, you can use the following locations and allocated IP address/address block:
Recommendation: Review the entire list for all IPs corresponding to a particular checkpoint as locations are not necessarily grouped together.
- Asia – Singapore – 18.139.118.192/26
- Australia – Sydney – 3.106.118.64/26
- EU – Dublin – 52.215.168.128/26
- US – Oregon – 34.223.95.64/26
- US – Washington DC – 52.202.255.64/26
IP addresses are available in the following formats:
- TXT
3.106.118.64/26
18.139.118.192/26
34.223.95.64/26
52.202.255.64/26
52.215.168.128/26- JSON
{
  "Logicmonitor_Sitemonitor_Machines": {
    "Public_IPs": [
      {
        "ip": "18.139.118.192/26",
        "location": "Asia - Singapore"
      },
      {
        "ip": "3.106.118.64/26",
        "location": "Australia - Sydney"
      },
      {
        "ip": "52.215.168.128/26",
        "location": "EU - Dublin"
      },
      {
        "ip": "34.223.95.64/26",
        "location": "US - Oregon"
      },
      {
        "ip": "52.202.255.64/26",
        "location": "US - Washington DC"
      }
    ]
  }
}- XML
<LogicmonitorSitemonitorMachines>
<PublicIPs>
<Node>
<IP>18.139.118.192/26</IP>
<Location>Asia - Singapore</Location>
</Node>
<Node>
<IP>3.106.118.64/26</IP>
<Location>Australia - Sydney</Location>
</Node>
<Node>
<IP>52.215.168.128/26</IP>
<Location>EU - Dublin</Location>
</Node>
<Node>
<IP>34.223.95.64/26</IP>
<Location>US - Oregon</Location>
</Node>
<Node>
<IP>52.202.255.64/26</IP>
<Location>US - Washington DC</Location>
</Node>
</PublicIPs>
</LogicmonitorSitemonitorMachines>