
Application Topology Map
Last updated – 16 December, 2022
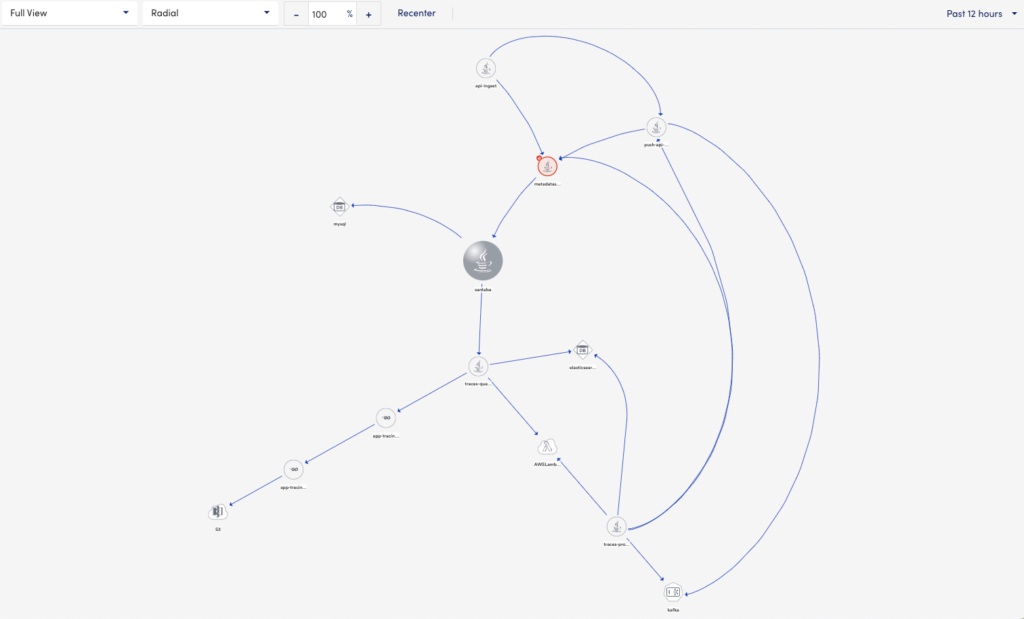
You can view the topology map for all your services for a given operation. This allows you to see how the different services are performing in your application and troubleshoot accordingly. If there are any alerts generated, the appropriate alert icon displays on the service itself. Clicking each service displays the overview, logs, alerts, and metrics information. For more information, see Application Topology Table.
Each external resource type is denoted with map icons that allow them to be recognized in the topology maps. For more information on these icons, see External Resource Types.
Note: There are some service nodes which appear in the topology map but when selected do not display data due to inadequate permissions.
You can customize the map using the following options:
- View
- Layout
- Zoom
Note:
- You can recenter the entire topology map.
- You can sort the data using the time range drop-down. The default value is Past 15 minutes.
Using the View option
View option consists of the following:
- Full view (default)- Displays the entire view of the topology map for all the services.
- 1-Degree Away – Displays only the immediate or same-level services. This view does not display child services.
Using the Layout option
Layout option consists of the following:
- Radial (default)- Arranges all the services in a radial layout.
- Dynamic Layout – Arranges all the services in a dynamic layout. The services are listed in random order.
- Circular – Arranges all the services in a circular layout. For example, the traces-process service acts as a pivot node and all other services display around it.
- Hierarchical (top-down) – Arranges all the services in a hierarchy from top to bottom.
- Hierarchical (left to right) – Arranges all the services in a hierarchy from left to right.
Using the Zoom option
You can either type the zoom percentage to view the topology map or use the zoom controls.
