
Usage Data for SaaS Monitoring
Last updated – 17 March, 2026
LogicMonitor provides detailed usage data for your SaaS Monitoring services. These metrics enable you to track the number of licensed users across the SaaS integrations you monitor.
Usage Reporting helps you do the following:
- View and compare licensed user counts across SaaS services such as Slack, Zoom, Webex, Office 365, and Salesforce
- Understand total usage across all SaaS integrations (aggregate count)
- Track usage growth and stay within your licensed user range
Note: SaaS performance is monitored without exposing individual user identities.
LogicMonitor aggregates data from several SaaS integrations to produce the following values representing active licensing:
| Integration | Data Source | Datapoints Used | Description |
| Microsoft 365 | Microsoft_Office365_UserCount | Office365Active + Office365Inactive | Total licensed users including inactive. |
| Zoom | SaaS_Zoom_UserStats | Active + Inactive | Total licensed users, including inactive. |
| Salesforce | Salesforce_License_Usage | TotalLicenses | Total licensed users, including inactive. |
| Slack | Slack_User_Count | user count | Total licensed users, including inactive. |
| Webex | Webex_User_Stats | total | Total licensed users, including inactive. |
| Aggregate Total | All integrations above | Sum of all five services | Combined total of all monitored SaaS users. |
Note: SaaS Lite Resources are included at no additional cost. They do not generate billable usage and do not count towards your SaaS Monitoring licensing. For more information on how to add a SaaS Lite Resource, see SaaS Lite Monitoring.
These metrics enable you to visualize licensed user activity across your monitored SaaS services, including the individual user counts for each integration, the aggregate total number of licensed users across all monitored services.
Billing and Usage Calculation for SaaS Monitoring
LogicMonitor offers the following licensing models for SaaS Monitoring:
Note: The billing unit for an individual employee license for Zoom and Microsoft 365 is applied independently to each integration.
| SaaS Monitoring License | Description |
| Usage Per User | Usage is measured as the monthly average of the total users across all monitored SaaS applications. This includes the following:
|
| Usage per Integration (Legacy) | A legacy billing model used by some existing customers monitoring SaaS applications such as Microsoft 365, Zoom, Slack, Salesforce, and Webex. Monthly usage is measured as the monthly average count of monitored SaaS service integrations, independent of the number of licensed users within each integration. |
Requirements for Viewing Usage Data for SaaS Monitoring
To view usage data for SaaS Monitoring products in Usage Reporting, you must subscribe to SaaS Monitoring.
Note: If you do not see the SaaS Monitoring product in the Usage page, confirm that the integration DataSources are active and collecting user license data.
Viewing Usage Data for SaaS Monitoring
- In LogicMonitor, navigate to Settings > Usage > and select “SaaS Monitoring” from the Product dropdown menu.
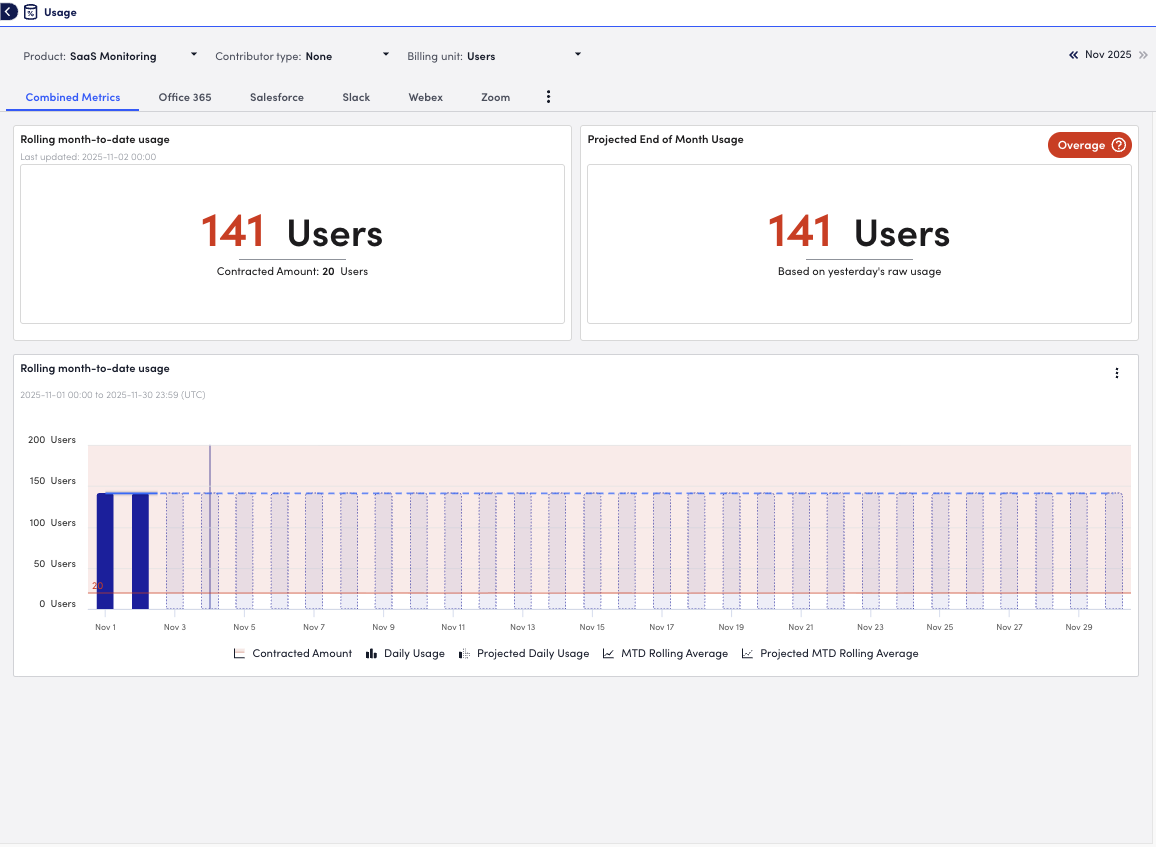
- To view specific child accounts or tenant identifiers, select one from the Contributor Type dropdown menu.
Note: This option displays only if your organization manages multiple portals.
- From the Billing unit dropdown, select one of the following billing units:
- Services—SaaS services being monitored (for example, Slack, Zoom, Webex)
- Users—The number of licensed users for the monitored services
- (Optional) To view usage data for a specific integration, select the integration from the list of tabs.
The default view displayed is the combined metrics tab. - (Optional) Select a month to view historical usage data.
The page by default displays the current month. - Review the following visuals:
- Month-to-Date Usage Summary—total licensed users and percent of commitment used.
- Cumulative Usage Graph—daily user count trends across integrations.
- Usage Contributors Table—per-account or per-tenant SaaS user totals.
