Kubernetes etcd Monitoring
Last updated – 28 August, 2023
etdc is a lightweight, highly available key-value store where Kubernetes stores the information about a cluster’s state. For more information, see Operating etcd clusters for Kubernetes from Kubernetes documentation.
LogicMonitor can only monitor etcd clusters that are deployed within a Kubernetes Cluster, and not those that are deployed outside of the cluster.
Important: We do not support Kubernetes etcd monitoring for managed Kubernetes services like OpenShift, Amazon Elastic Kubernetes Service (EKS), Google Kubernetes Engine (GKE), and Azure Kubernetes Service (AKS) because they do not expose the Kubernetes Control Plane components.
Requirements for Monitoring etcd
Ensure you have enabled the Kubernetes_etcd DataSource.
Note: This is a multi-instance datasource, with each instance indicating an etcd node. This DataSource is available for download from LM Exchange.
Setting up Kubernetes etcd Monitoring
Installation
You do not need any separate installation on your server to use the Kubernetes etcd.
Depending on your preference, you can install LM Container with the following two options:
- Installing through the user interface. For more information, see Installing the LM Container Helm Chart.
- Installing through the command line interface. For more information, see Installing LM Container Chart using CLI.
Configuration
The Kubernetes etcd cluster is pre-configured for monitoring. No additional configurations are required. If you do not see any data for the Kubernetes etcd resource, do the following:
- In your system, enter /etc/kubernetes/manifests in the terminal.
- Open the etcd.yaml file for updating.
- In etcd Pod under kube-system namespace, change the value of –listen-metrics-urls at .spec.containers.command from http://127.0.0.1:2381 to http://0.0.0.0:2381.
Note: Changing the value of –listen-metrics-urls allows the collector pod to scrape the metrics URL of the etcd pod within the cluster only. - Save the etcd.yaml file.
Note: Ensure you disable the SSL certificate verification. To do this, use http instead of https for the –listen-metrics-urls value.
For monitoring custom etcd deployment, follow the instructions below:
- In LogicMonitor, navigate to Settings > DataSources > select Kubernetes etcd DataSource.
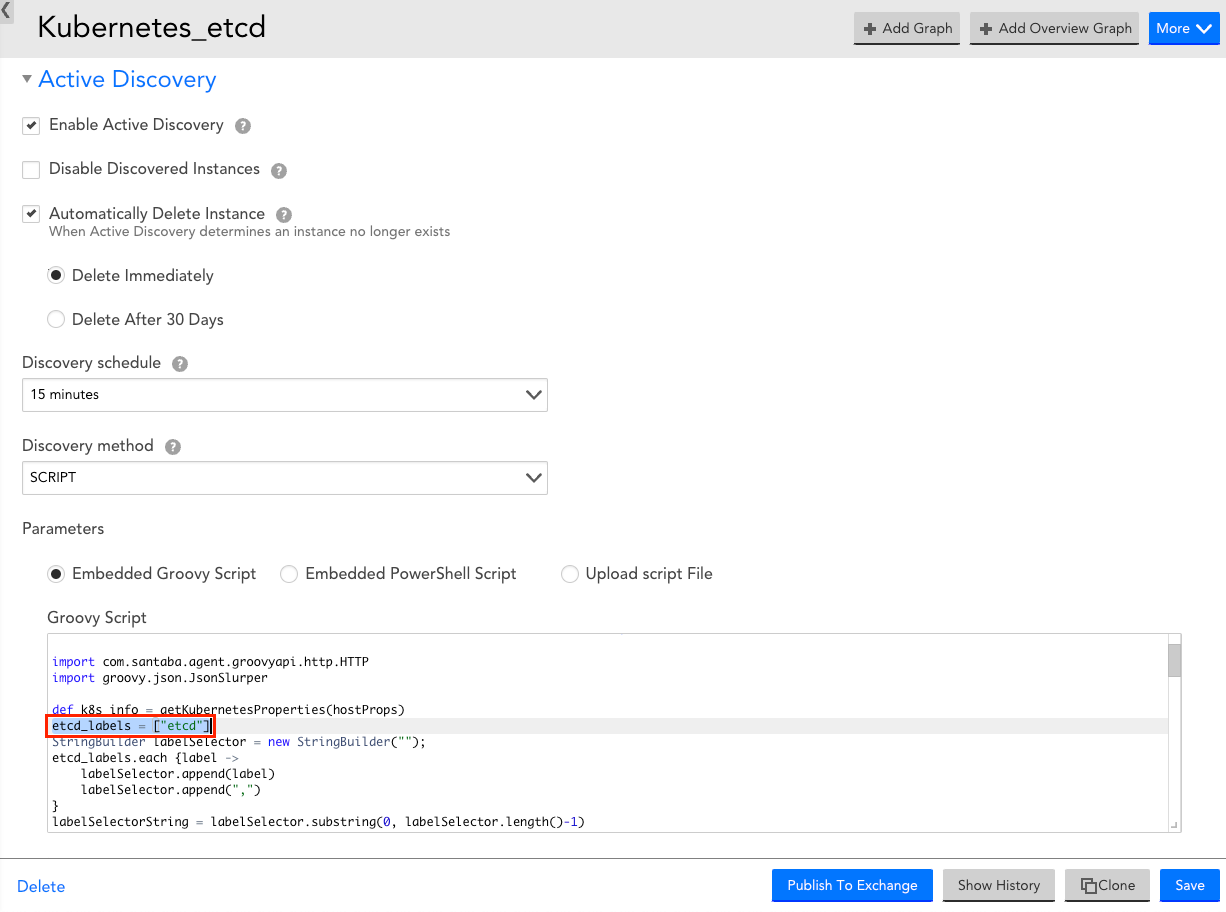
- In the Kubernetes etcd DataSource page, expand Active Discovery.
- In the Parameters section, select the Embedded Groovy Script option.
- In the Groovy Script field, enter the required component name for the etcd_label array.
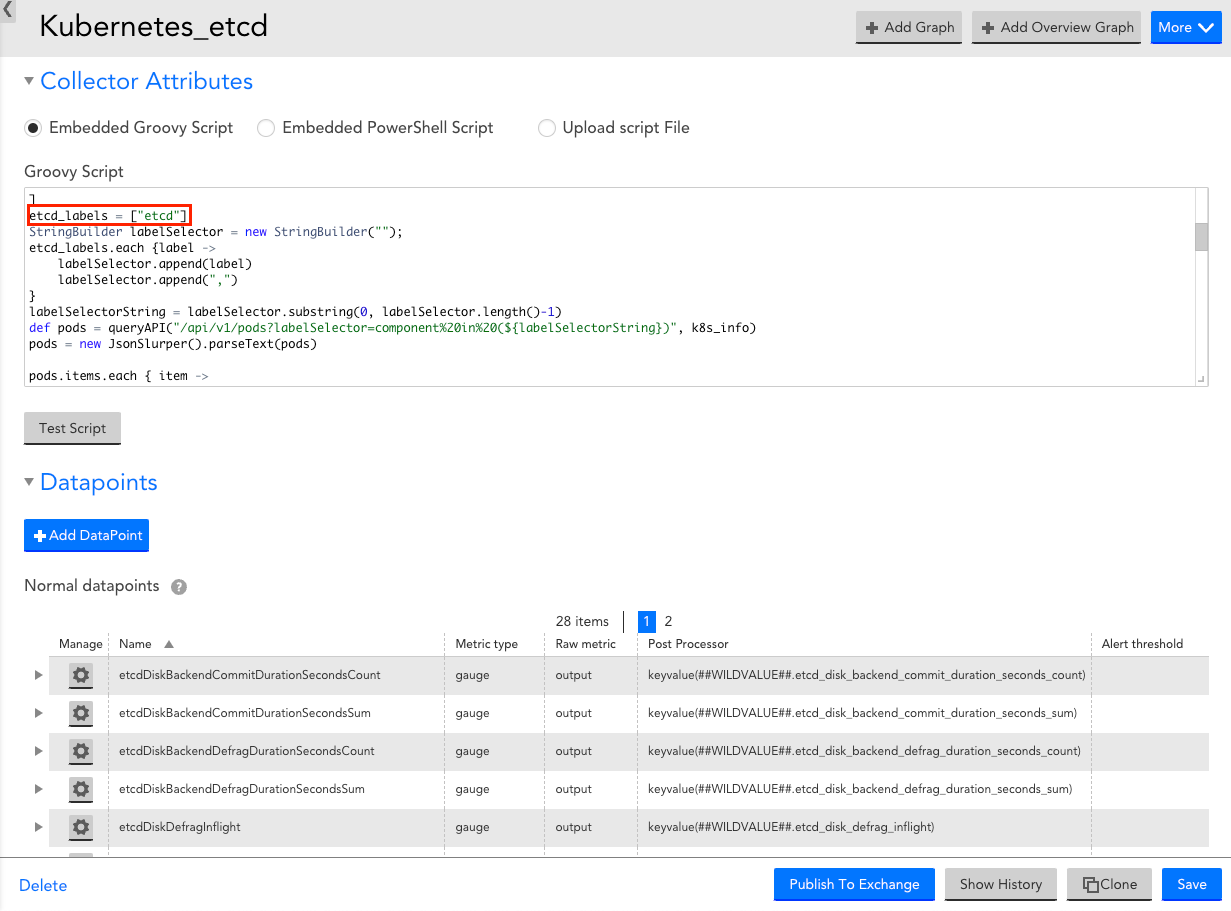
- Expand Collector Attributes, and in the Groovy Script field, enter the required component name for the etcd_label array.
- Select Save to save the Kubernetes etcd DataSource.
Viewing Kubernetes etcd Details
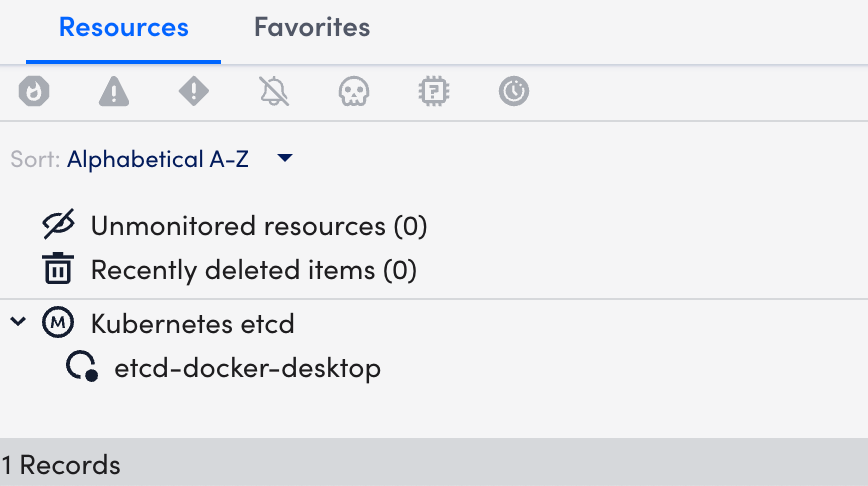
Once you have installed and configured the Kubernetes etcd on your server, you can view the etcd cluster properties and metrics on the Resources page.
- In LogicMonitor, navigate to Resources > select the required etcd DataSource resource.
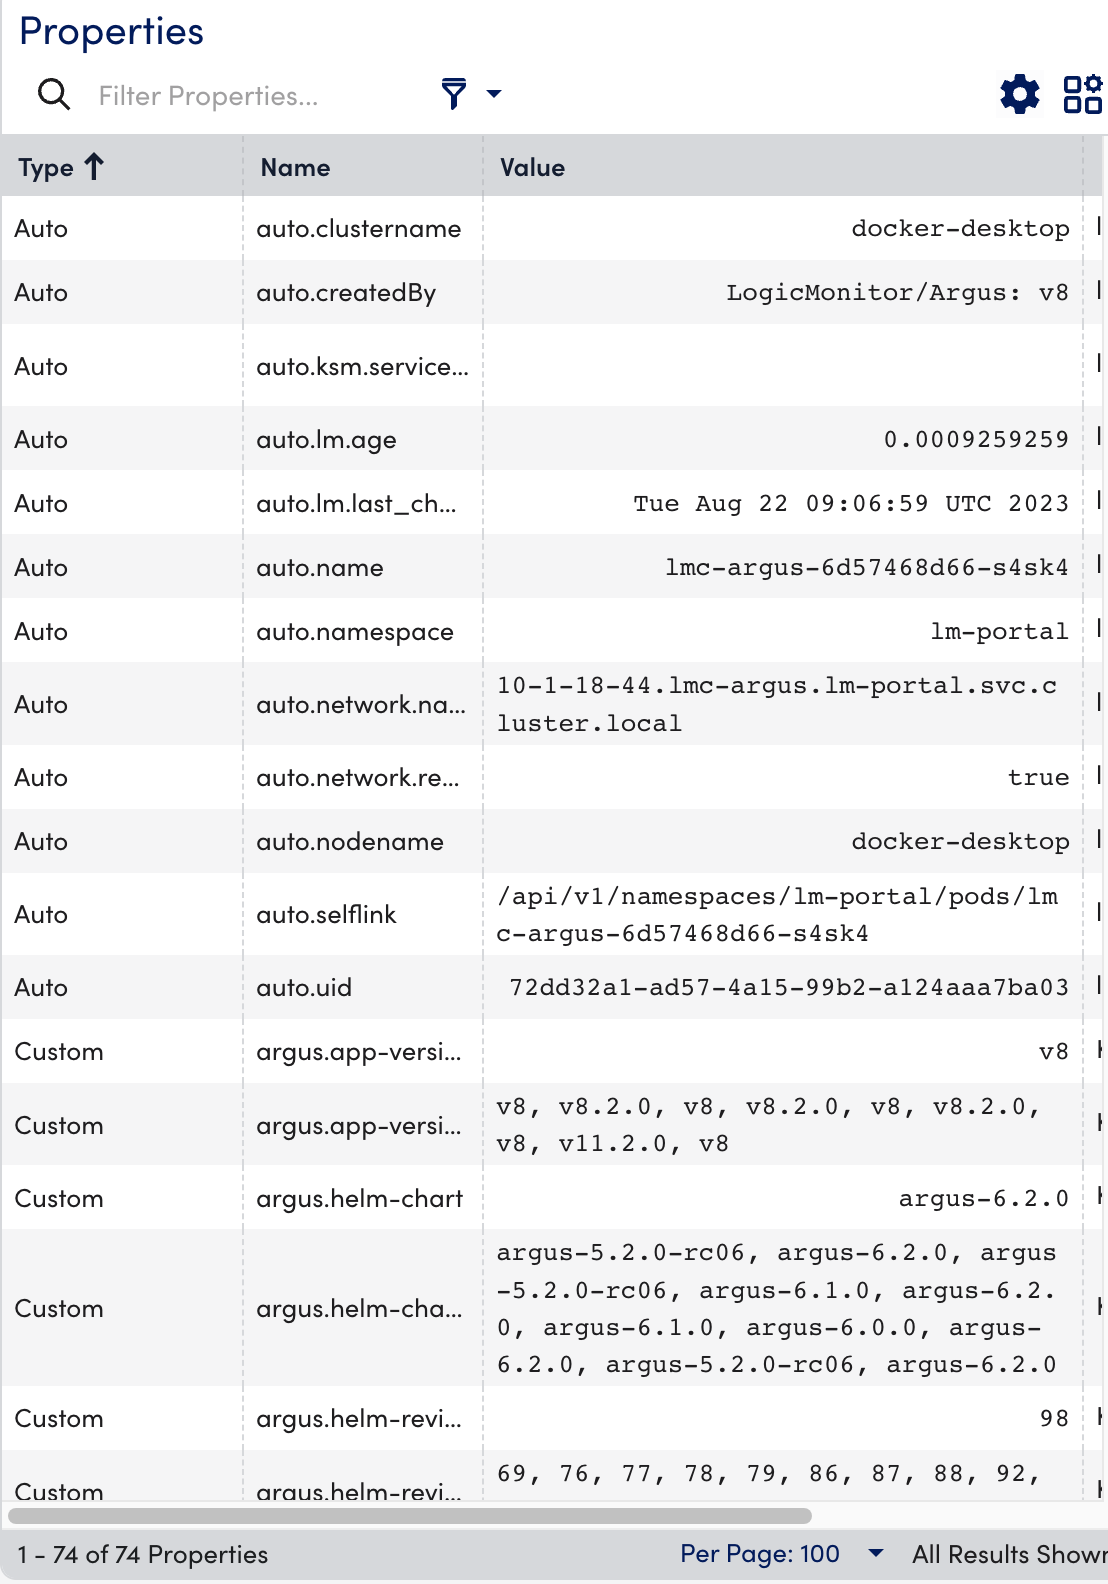
- Select the Info tab to view the different properties of the Kubernetes etcd.
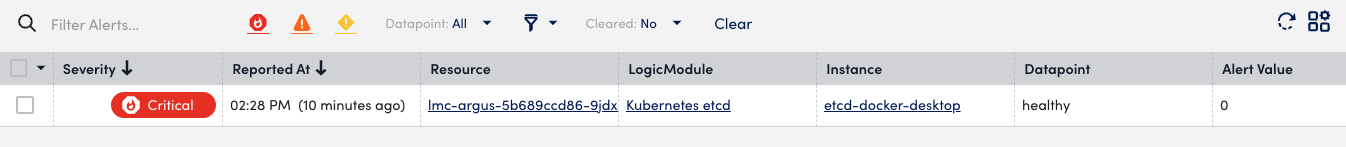
- Select the Alerts tab to view the alerts generated while checking the status of the Kubernetes etcd resource.
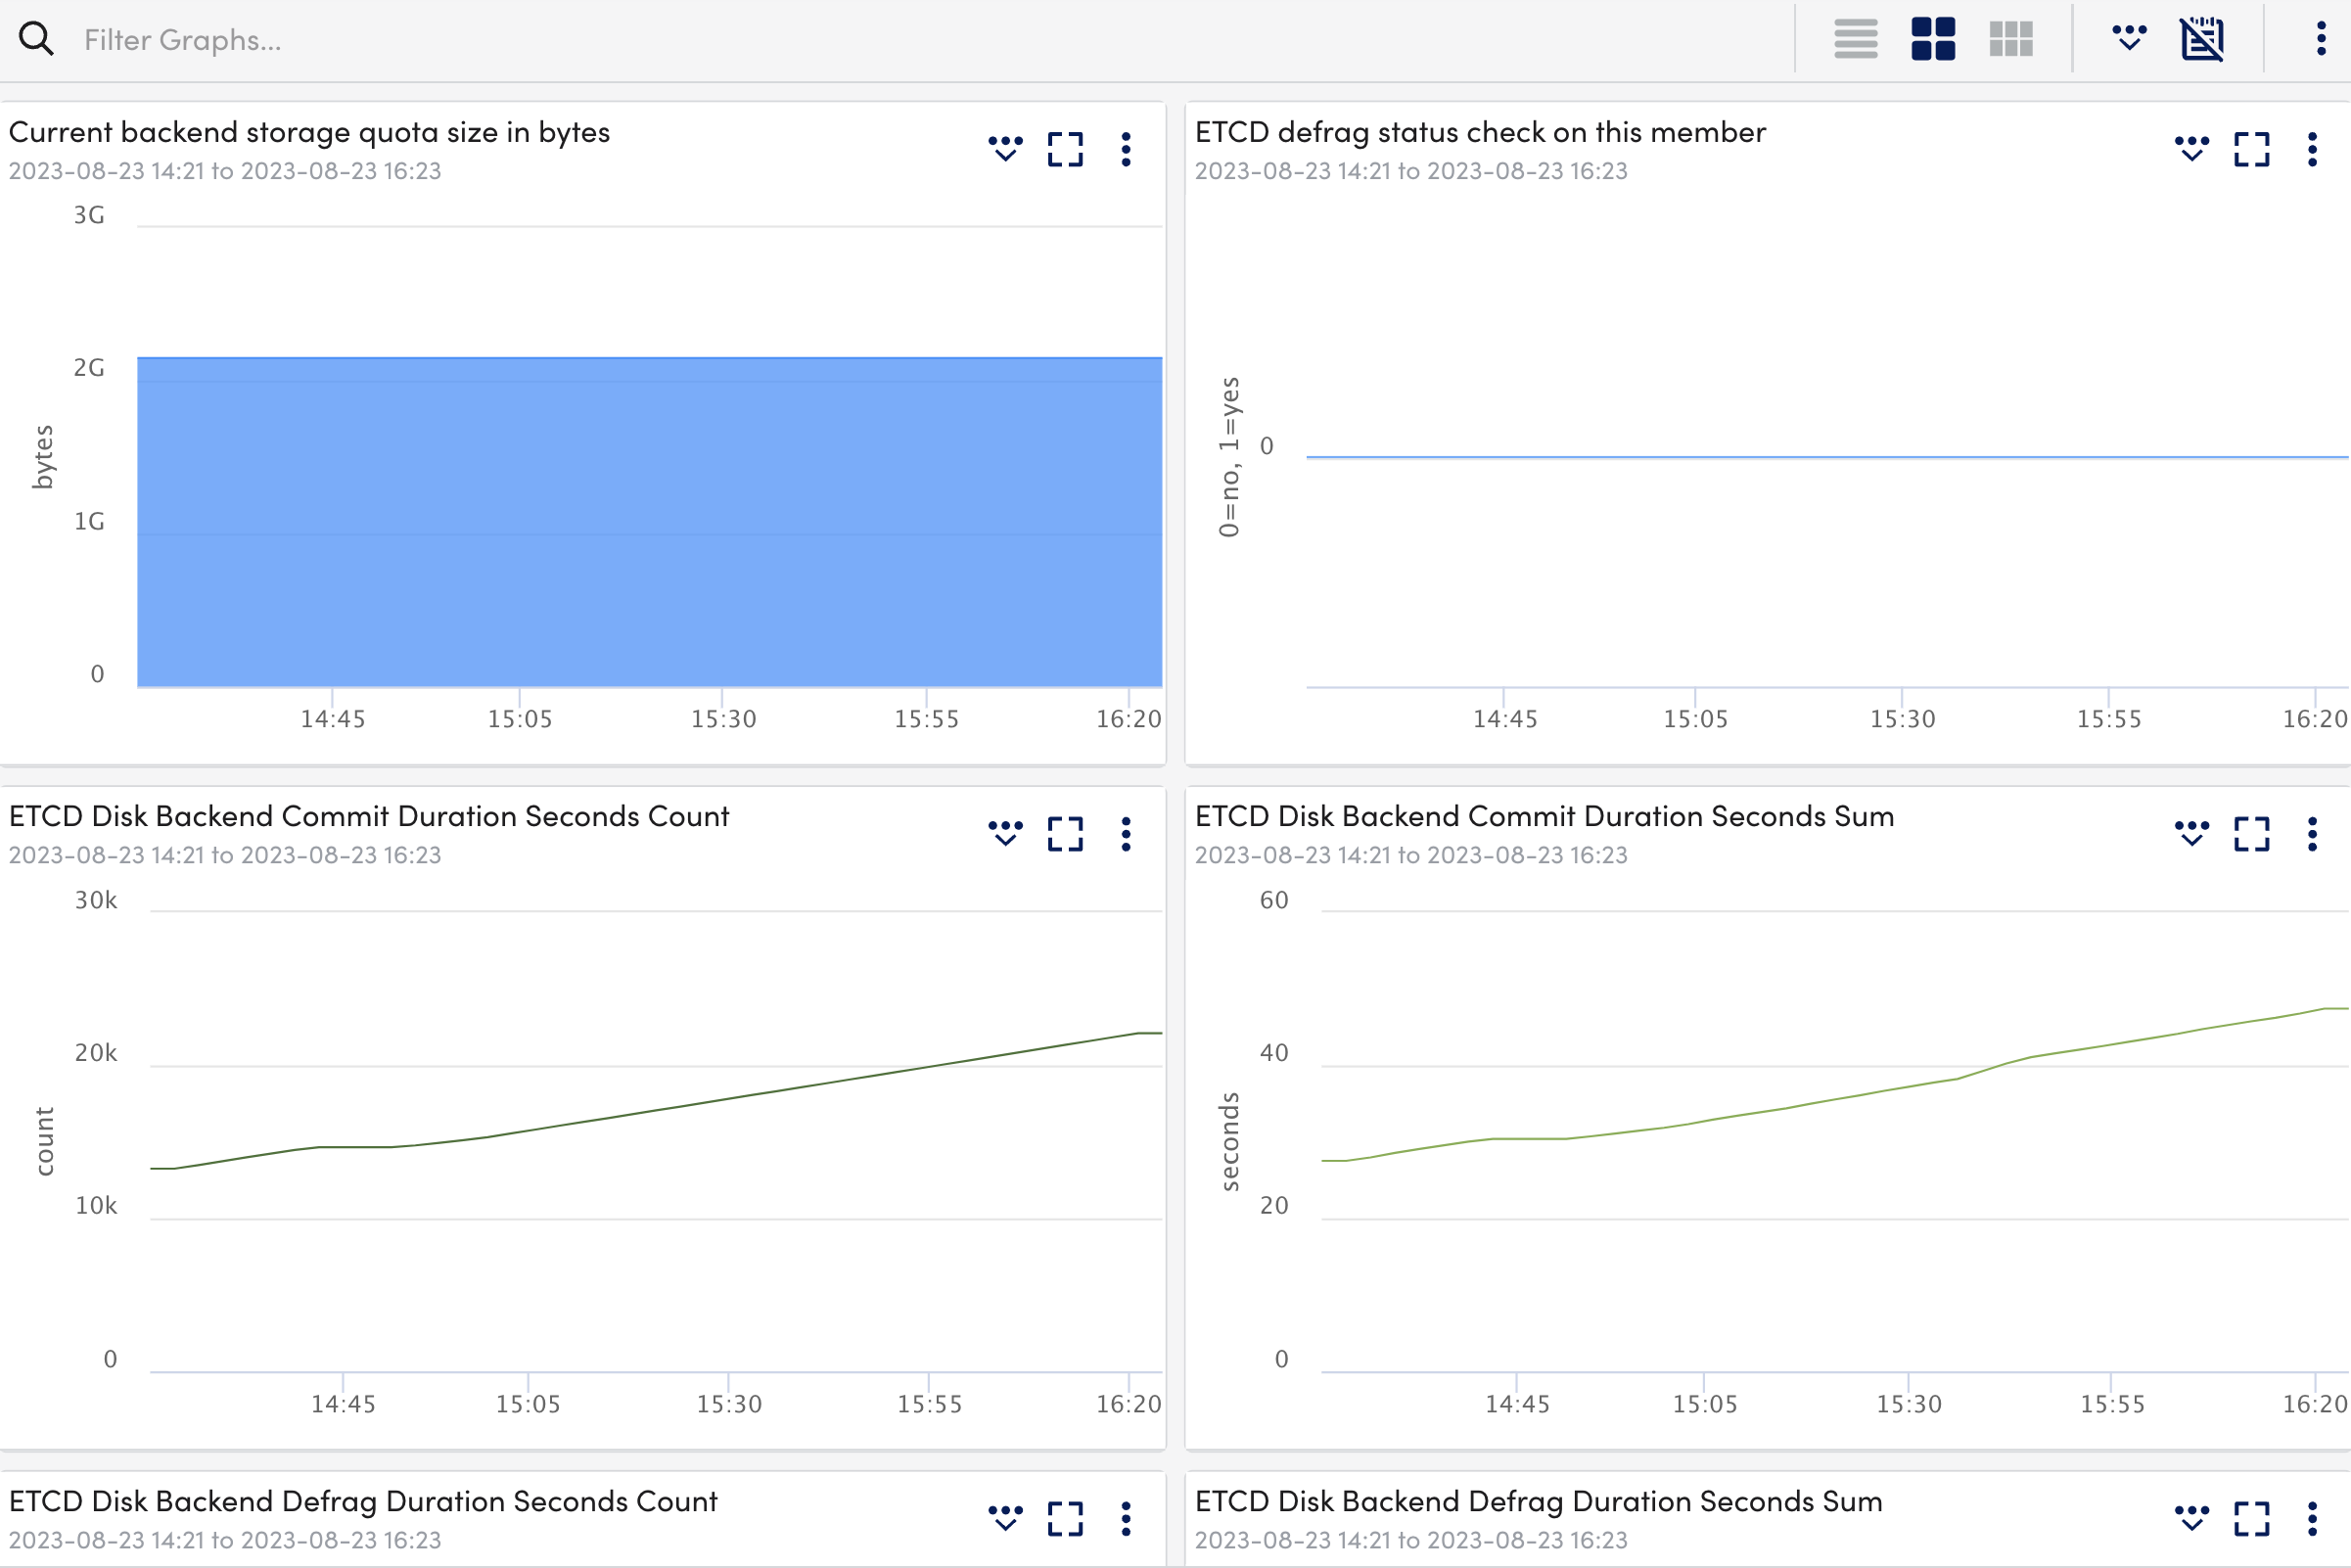
- Select the Graphs tab to view the status or the details of the Kubernetes etcd in the graphical format.
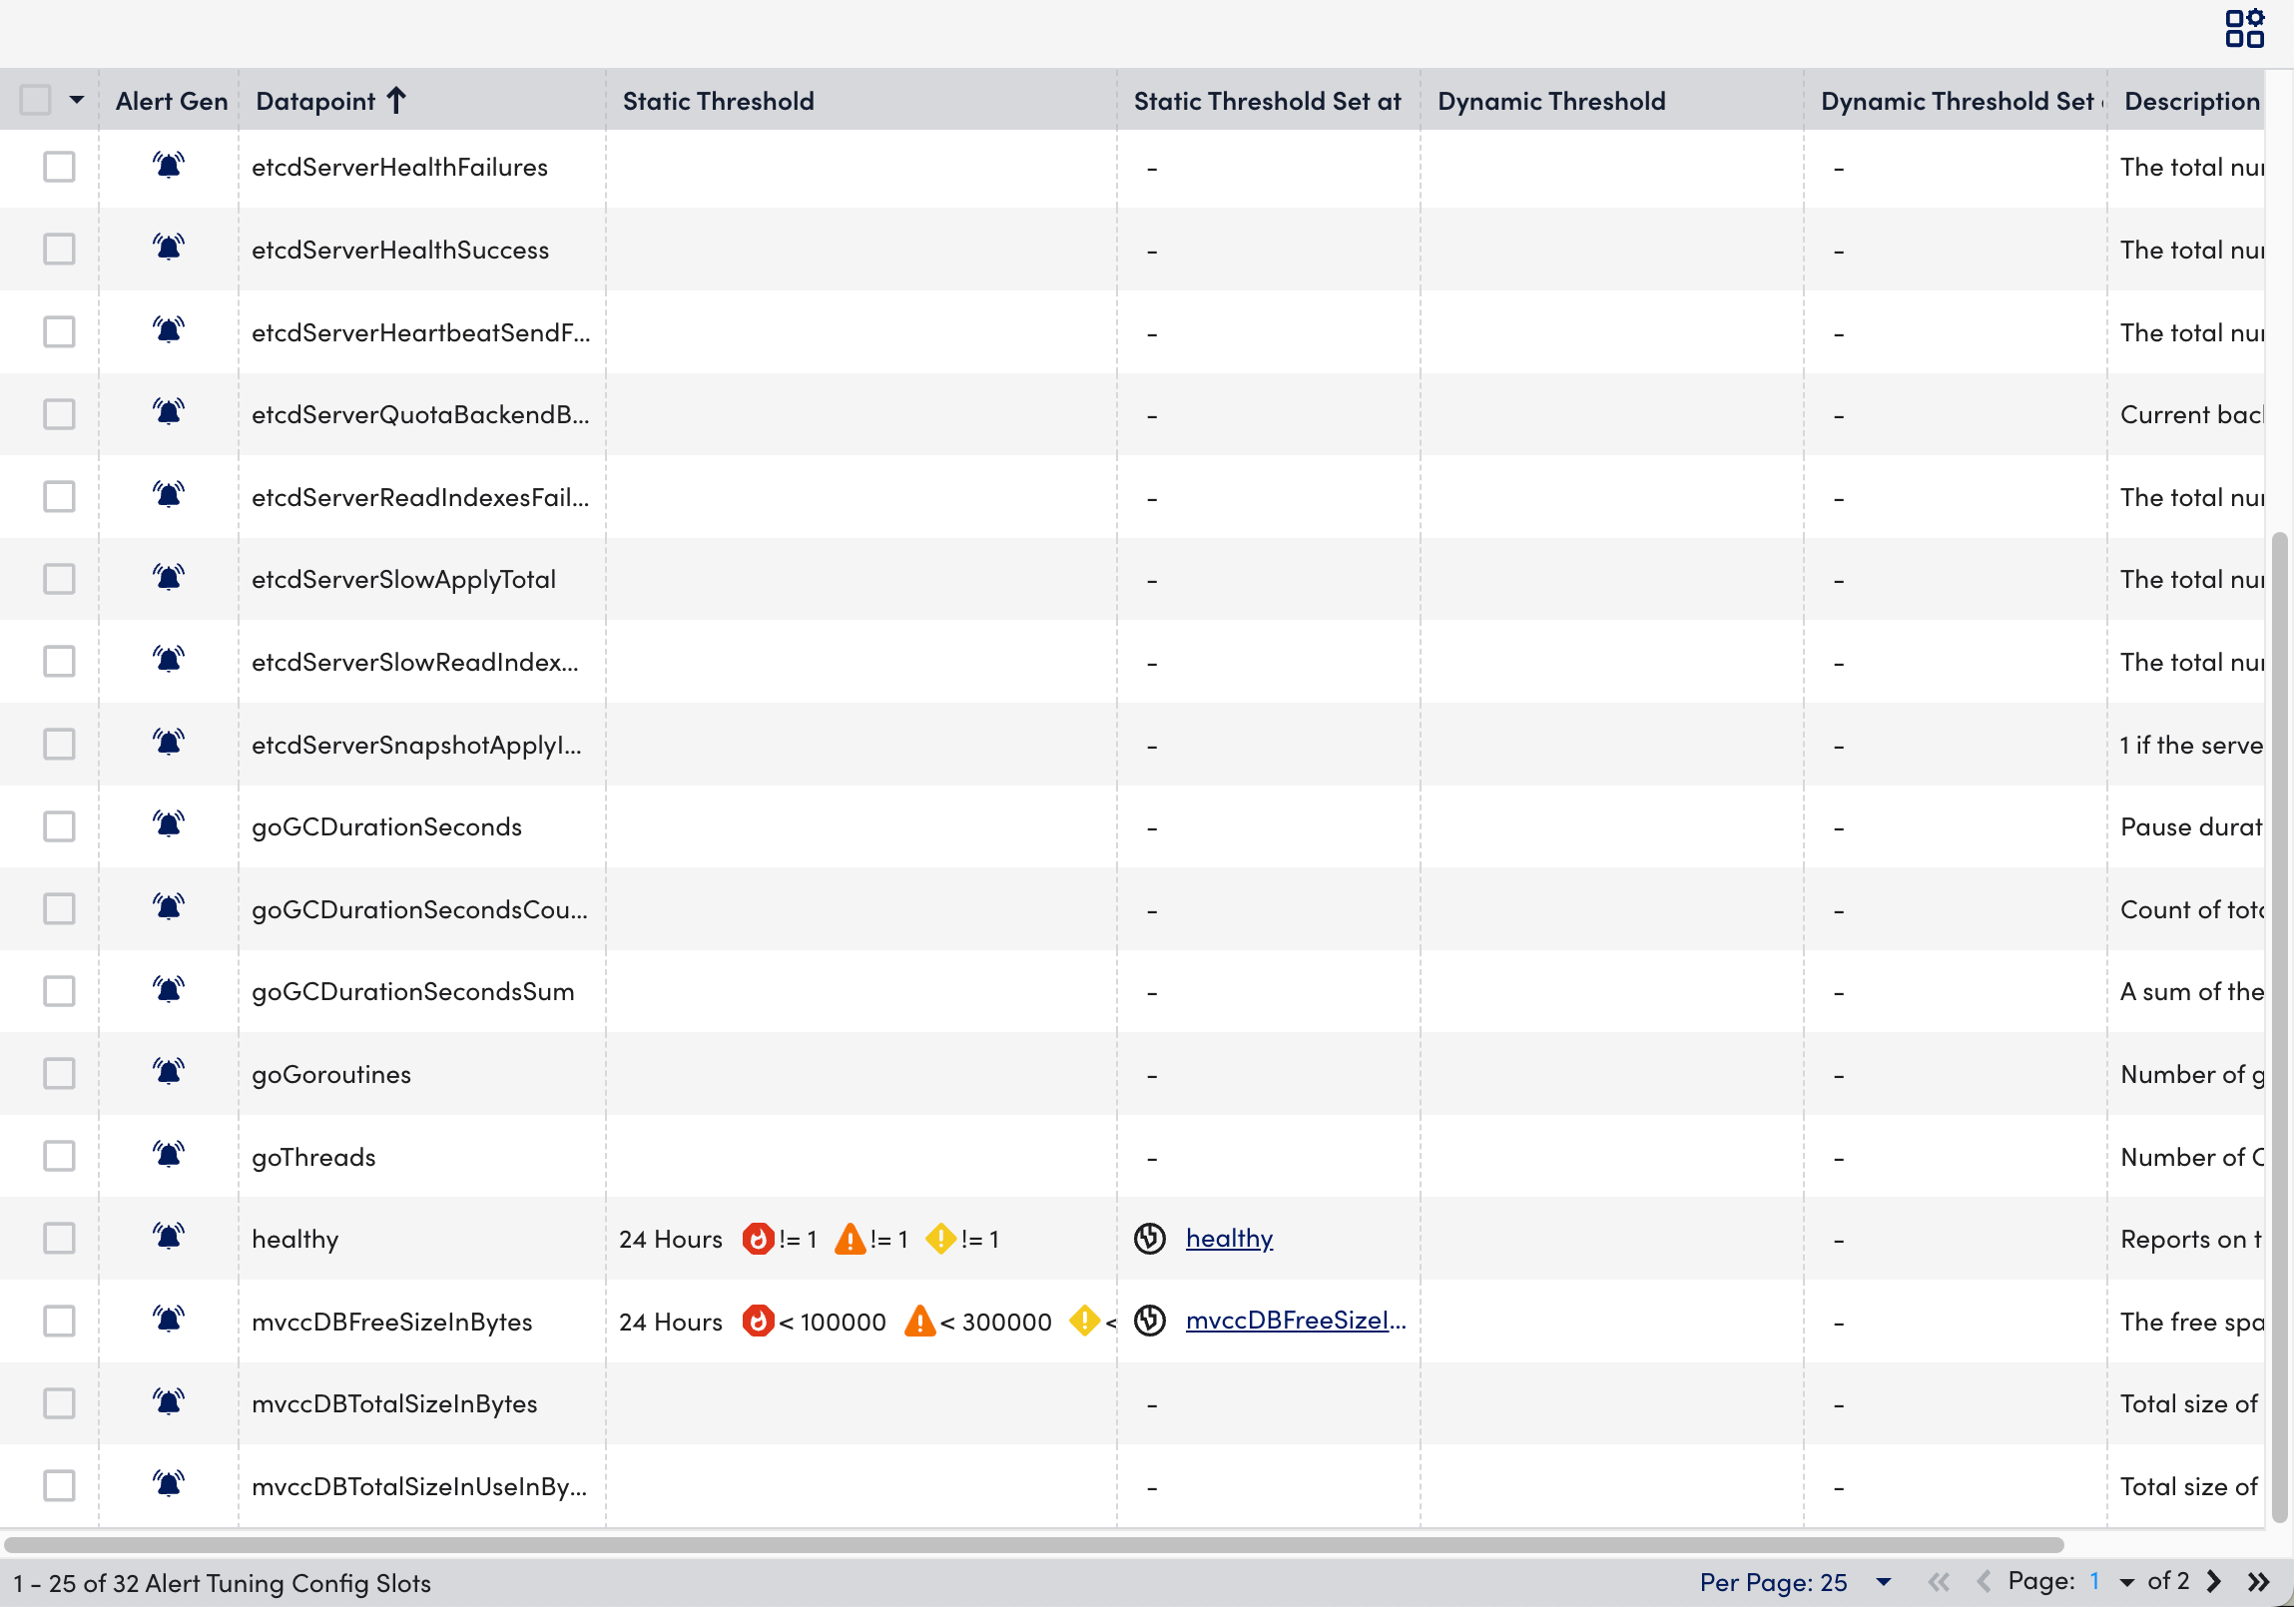
- Select the Alert Tuning tab to view the datapoints on which the alerts are generated.
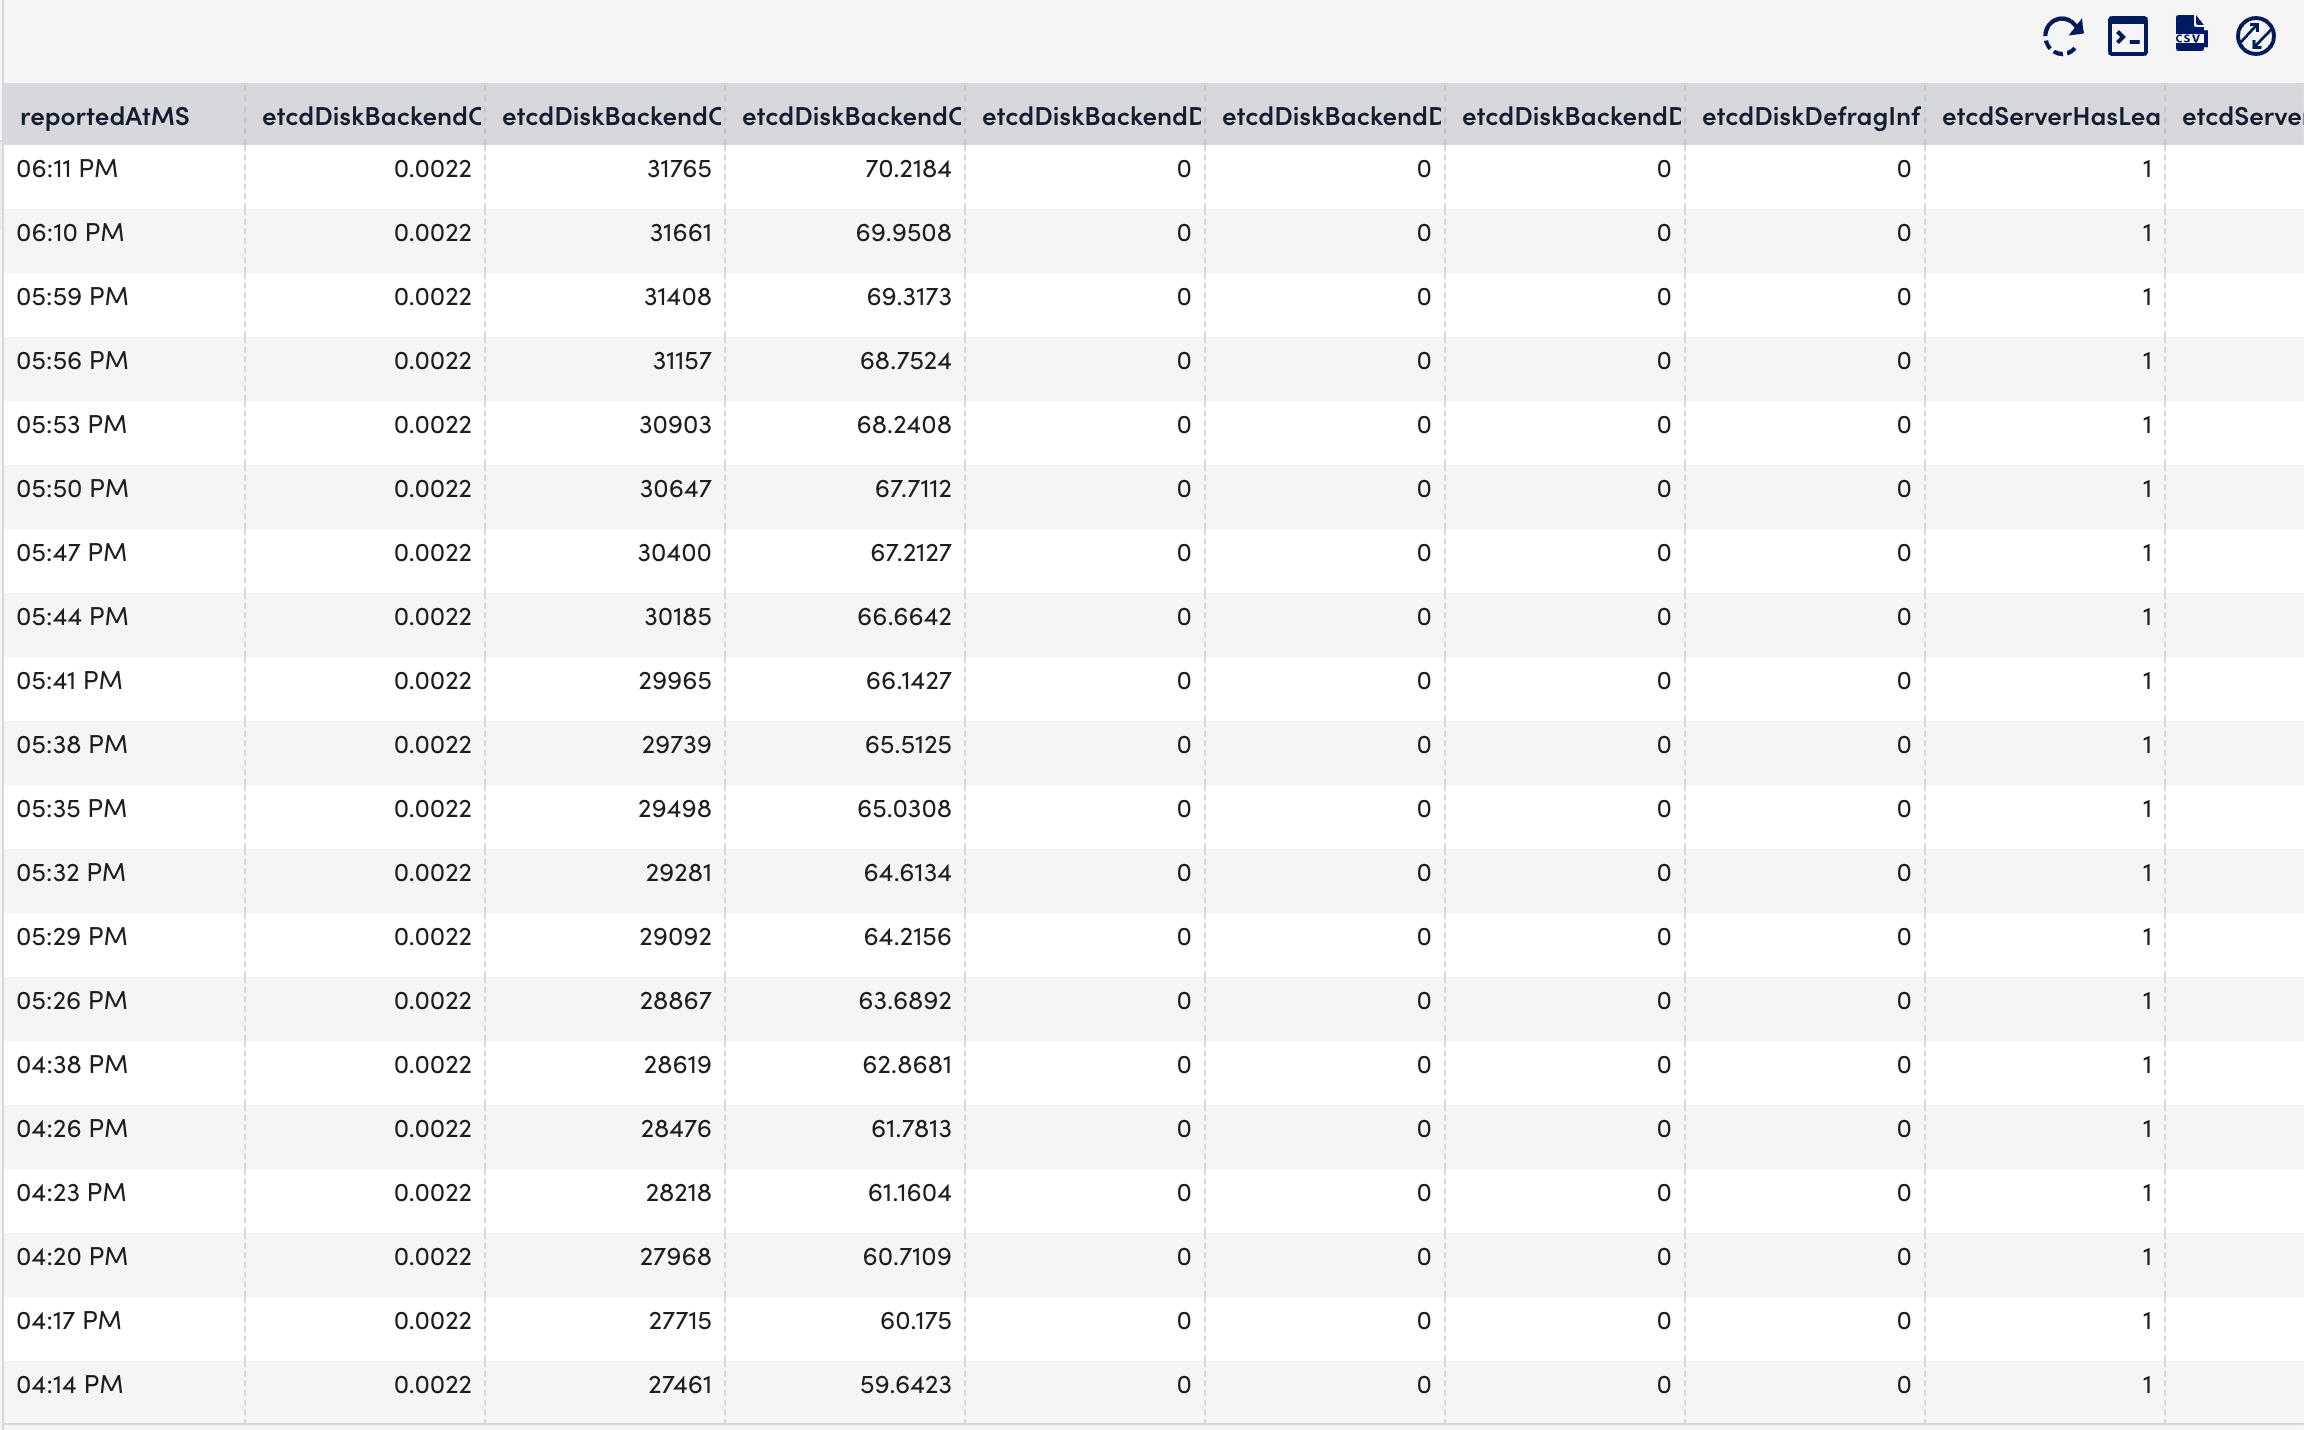
- Select the Raw Data tab to view all the data returned for the defined instances.