
Ops Notes
Last updated - 03 October, 2025
Ops Notes allow you to add time-stamped annotations (markers) to your graphs. It is a powerful way to correlate events such as manual device changes, upgrades, or releases with performance changes in your environment. It is not only useful for troubleshooting purposes, but also provides a historical log of events’ impact on your environment’s performance.
Accessing Ops Notes Page
Navigate to Settings > Ops Notes, the Ops Notes page provides an interface from which you can view and filter Ops Notes under the Notes tab.
Note: You can also add individual tags from the Tags tab.
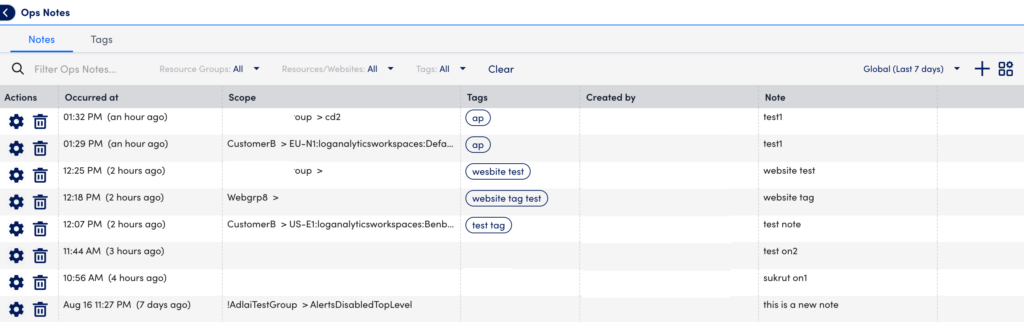
In the Actions column, you can perform the following:
 — allows you to manage or edit the values of the selected Ops Notes.
 — deletes the selected Ops Notes permanently.
Adding Ops Notes
- Navigate to Settings > Ops Notes.
- Under the Notes tab, select Add Ops Notes
 .
. - In the Note field, enter all the relevant information necessary to contextualize the event.
- In the Tags field, select the tags based on event type (bug, deployment, upgrade, and manual changes).
Tagging Ops Notes based on event type provides a good historical log that will contextualize how certain actions impact your environment. - Select a date and time associated with the Ops Notes.
- Based on your requirement, select either the Resource, Groups, Website Groups, or Websites tab and add the relevant records.
- Select Save.
Customizing Table Settings
- Navigate to Settings > Ops Notes.
- Select
 .
. - Do the following:
- To reorder columns, select
 and drag to the order you want
 - To hide or show columns, select
 .
.
- To reorder columns, select
