
Usage Reporting for APM Metrics
Last updated - 17 March, 2026
You can view the usage data for APM Metrics in a tabbed format that decouples the data for Push Metrics and OpenMetrics. This enables you to view usage patterns separately for Push Metrics or OpenMetrics. By default, the page displays your combined APM Metric usage.
Billing and Usage Calculation for APM Metrics
APM Metrics billing is based on the combined usage of all APM Metrics, including both APM Push Metrics and APM OpenMetrics. While Usage Reporting enables you to view Push Metrics and OpenMetrics separately for analysis purposes, these values are aggregated for billing.
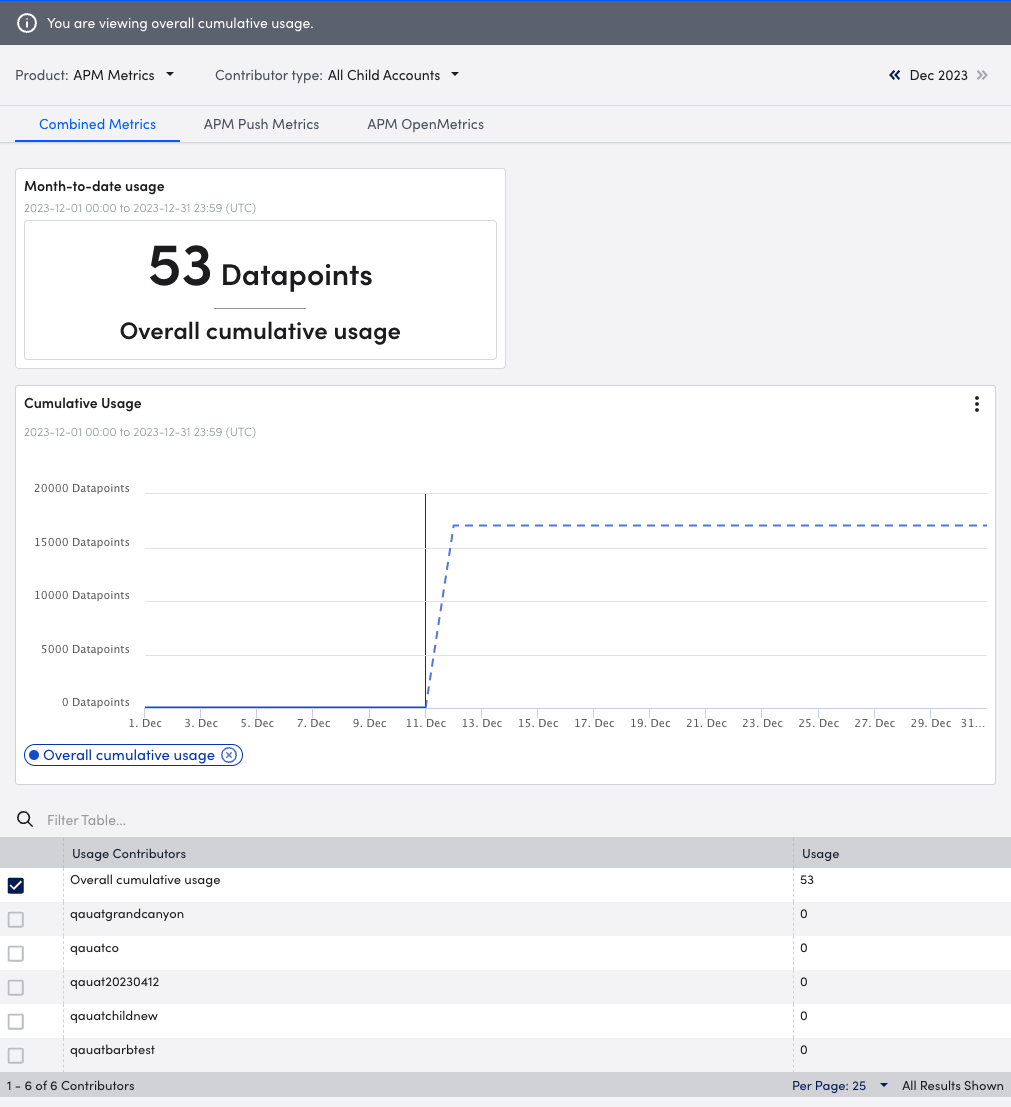
Usage is calculated based on the total number of datapoints ingested during the selected billing period. A datapoint represents a single metric value collected at a point in time. Monthly usage is calculated using the datapoints collected within the selected month.
Requirements for Viewing Usage Data for APM Metrics
To view usage data for APM Metrics in Usage Reporting, you must subscribe to the APM Metrics products.
Viewing Usage Data for APM Metrics
- Navigate to Settings > Usage.
- From the Products option, select “APM Metrics”.
- To interact with the Usage Contributors table, select a contributor from Contributor Type.
Note: This option is only available if your environment provides services to multiple portals.
- Select the month you want to view usage for.
- Do one of the following:
- To view the combined metrics for all APM Metrics, select the Combined Metrics tab.
The total number of datapoints defined in PushModules is displayed, and the visual components update accordingly. - To view the metrics for APM Push Metrics, select the APM Push Metrics tab.
The total number of datapoints for Push metrics is displayed, and the components update accordingly. - To view the metrics for APM OpenMetrics, select the APM OpenMetrics tab.
The total number of datapoints for OpenMetrics is displayed, and the visual components update accordingly.
- To view the combined metrics for all APM Metrics, select the Combined Metrics tab.
- To view usage in a sparkline or bar graph format in the Cumulative Usage graph, select the type of graph from the Options menu of the Cumulative Usage graph.
Note: If a contributor is selected from Contributor Type, you must select a contributor from the Usage Contributors table to display data in the Cumulative Usage graph.
