
Troubleshooting Traces
Last updated - 22 April, 2026
If you have issues with trace data collection, the following sections can help you identify and troubleshoot the issue.
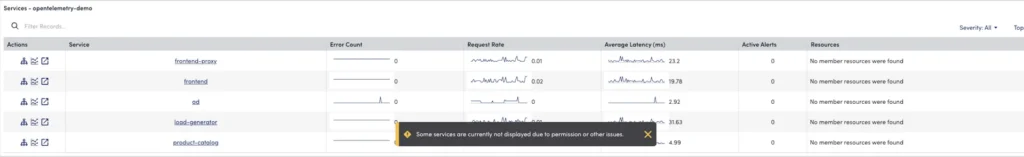
Services Not Displayed Due to Permission or Data Issues
This issue occurs when expected services are not displayed in the LogicMonitor portal. This behavior is commonly related to user access restrictions or issues with service data ingestion and configuration.
The issue occurs due to one or more of the following:
- The user does not have the required RBAC permissions to view services or associated resources within a namespace.
- The required APM DataSource (LogicMonitor_APM_Services) is not applied or is missing from the service.
- The service has stopped sending APM data, resulting in the datasource being removed during cleanup.
- The service exists in the APM context but has been deleted from the LogicMonitor system.
Mitigating Services Not Displayed Issue
- In LogicMonitor, navigate to Settings > Users and Roles.
- Select your user and open the Permissions tab.
- Ensure that View access for Services is enabled.
- Review the topology map to identify the relevant namespace where the service should exist.
- Verify that all services within that namespace have the LogicMonitor_APM_Services DataSource assigned.
- Open the Service > Instance Details tab.
- Confirm that datapoints are actively collecting data.
- Check the Traces View page to ensure LogicMonitor is receiving trace data.
- If no data is being collected, start data ingestion from the service.
- If the service is not present, it is automatically created once data is received, and the appropriate DataSource is applied.
Recommendation: Refresh the portal after completing the steps to ensure services are displayed correctly.
I don’t see anything on the Traces page
The Traces page may not show anything if LogicMonitor is not receiving or properly processing the traces forwarded from your applications. In this case, you can perform the following checks to isolate the issue and identify the cause:
Are there Errors in LogicMonitor audit logs?
Search the audit log for the user you used to set your OpenTelemetry Collector. If the Collector is sending traces to LogicMonitor, you will see an audit log entry for the creation of the service.
Does the OpenTelemetry Collector receive spans?
LogicMonitor monitors each OpenTelemetry Collector that is added to automatically detect traces. You can use these metrics to verify if traces are being received from the application to the OpenTelemetry Collector and forwarded to your LogicMonitor account. If you don’t see the Receiver and Exporter DataSources, the Collector hasn’t received any spans form your application.
Duplicate Resources are being created
For each trace that is forwarded, LogicMonitor tries to map the ‘host’ attributes to an existing monitored resource. (The ‘host’ attribute is not required by OpenTelemetry.)
- If LogicMonitor does not find a matching ‘host’ resource, it creates a new resource.
- If the ‘host’ attributes are not specified, a service will be automatically created based on the ‘service’ attribute and all trace data will mapped to the service.
If you instrumented your applications to send ‘host’ attributes with the traces forwarded to LogicMonitor, but you’re not seeing the trace data associated to the correct monitor resources, make sure that following values are provided and current during instrumentation:
host.name=(hostname mapped to system.hostname in LM)
ip=(ip address of the resource mapped to system.hostname in LM)
resource.type={pod, cloud, physical}
resource.group={group name or id for the resource}Note: For Kubernetes, we recommend that you add your cluster into monitoring before forwarding traces from your cluster to ensure that traces are associated with the correct pods and that duplicate resources are not created.
I want to change how Traces are displaying
The Traces page does not let you modify how traces are displayed. To modify how traces display, you must make the change on the instrumentation.
- If you want to change the name of a service, change the parameters for your automatically instrumented application.
- If you want to change the name of an operation, change the name from your manual instrumentation.
- If your operations appear to be out of order in the end-to-end trace view, make sure the NTP is synced for your host.
Installing the LM OTel Collector as a Root or Non-Root User
LM OTel can be installed as root user as well as non-root user.
Root User
- If LM OTel is installed as a root user, then it will run as a service.
- System prompts you to enter the installation user name to start lmotel service.
- If the mentioned user does not exist, then the lmotel service does not start.
- To verify whether the installation is successful, check for the following messages in console log:
user testuser exists, run lmotel service from user: testuser
Please wait to install service...
Installation completed...- To verify the status of installed service, execute the following command:
systemctl status lmotelNon-Root User
- If LM OTel is installed as a non-root user, then it will run as a process.
- To verify whether the installation is successful, check for the following messages in the console log:
lmotel running as a process
Installation completed ...- To verify the status of lmotel process, use the following command:
ps -ef | grep lmotel