
Monitoring Kubernetes Clusters with kube-state-metrics
Last updated - 14 September, 2023
kube-state-metrics (KSM) monitors and generates metrics about the state of the Kubernetes objects. KSM monitors the health of various Kubernetes objects such as Deployments, Nodes, and Pods. For more information, see kube-state-metrics (KSM) from GitHub.
You can use the kube-state-metrics-based modules available in LM Exchange in conjunction with the new LM Container Helm charts to gain better visibility of your Kubernetes cluster. The charts automatically install and configure KSM on your cluster. For more information on LM Container installation, see Installing the LM Container Helm Chart or Installing LM Container Chart using CLI.
Monitoring Workflow
The following diagram illustrates the monitoring workflow with the KSM:
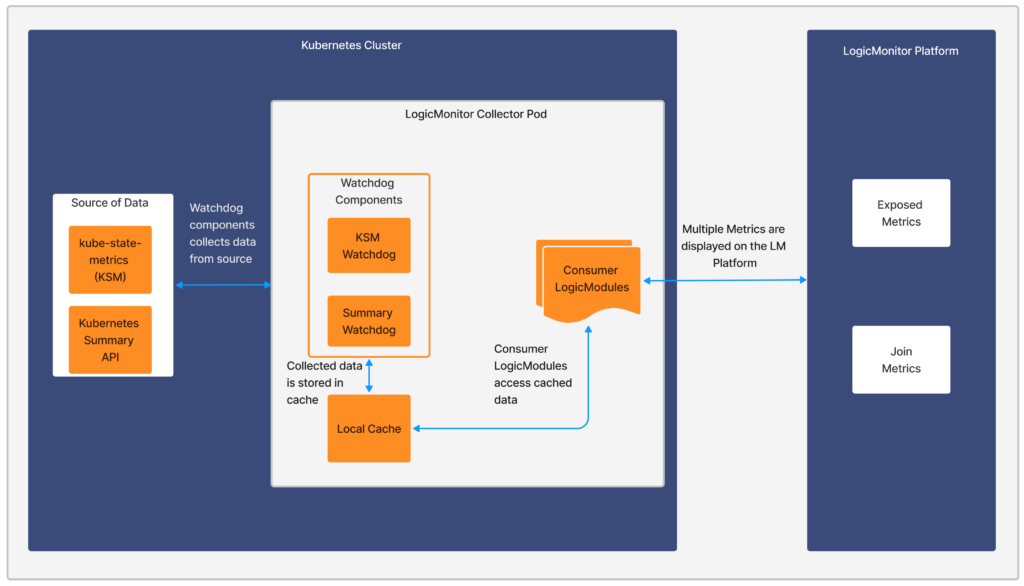
Sources of Data
- kube-state-metrics (KSM)— Listens to the Kubernetes API server and generates metrics about the state of the objects. For more information, see kube-state-metrics from Github.
- Kubernetes Summary API (/stats/summary)— It is provided by the kubelet for discovering and retrieving per-node summarized stats available through the /stats endpoint. For more information, see Node metrics data from Kubernetes documentation.
Watchdog Component
The Watchdog component collects and stores the data for other LogicModules to consume. LogicMonitor uses kube-state-metrics (KSM) and Kubernetes Summary API to monitor Kubernetes cluster health.
There are two modules, watchdog module and consumer module. Watchdog fetches the data from the API and stores it in the local cache. The consumer uses the stored data.
- KSM Watchdog— KSM Watchdog collects data from kube-state-metrics.
- Summary Watchdog— Summary Watchdog fetches metrics from the summary API and provides data to LogicModules.
| Module Name | AppliesTo |
| Kubernetes_ KSM_Watchdog | system.devicetype == “8” && system.collector == “true” && hasCategory(“KubernetesKSM”) |
| Kubernetes_Summary_Watchdog | system.collector == “true” && hasCategory(“KubernetesKSM”) |
For more information on AppliesTo, see AppliesTo Scripting Overview.
Consumer LogicModules
Kubernetes-related LogicModules utilize the data which is collected by Kubernetes Watchdog. For example, Kubernetes_KSM_Pods, Kubernetes_KSM_Nodes are collected by Watchdog.
Requirements for Monitoring using KSM
- Ensure to add all the Kubernetes modules under LM Exchange in the Kubernetes package.
- Ensure that Kubernetes_ KSM_Watchdog and Kubernetes_Summary_Watchdog modules are installed.
Installing KSM
You do not need any separate installation on your server to use kube-state-metrics (KSM). If the value of kube-state-metrics.enabled property is set to true in the lm-container helm values.yaml file, KSM installs automatically. In addition, you can configure KSM while installing or upgrading LM Container Helm Charts.
Note:
- If you already have KSM installed and intend to use the same, set the kube-state-metrics.enabled property to false.
- In case the existing KSM service is changed, you must restart the LM Collector Pod.
Installing and Upgrading KSM with LM Container Helm Charts
Install LM Container Charts. For more information, see Installing the LM Container Helm Chart.
To upgrade the existing cluster to the latest version, see Upgrading LM Container Charts.
Installing and Upgrading KSM without LM Container Helm Charts
Install Argus. For more information, see Argus Installation.
To upgrade the existing cluster to the latest version, see Upgrading Kubernetes Monitoring Applications.
Running the PropertySource
To set the existing cluster for monitoring, you must run the addCategory_KubernetesKSM property source by completing the following steps:
- In LogicMonitor, navigate to Settings > PropertySources > addCategory_KubernetesKSM.
- In the PropertySouce window, click the More options.
- Run PropertySource.
Updating Dashboards
Dashboards can help you visualize the information in a meaningful manner that is retrieved by the modules. It does not affect the usability of the modules.
Requirements
Download the Dashboards from the LogicMonitor repo.
Procedure
- Log into your LogicMonitor portal.
- On the left panel, navigate to Dashboards and click the expand icon.
- On the Dashboards panel, click Add.
- From the Add drop-down list, select From File option.
- Click Browse, to add the dashboard file downloaded from the portal.
- Click Submit.
You can see the required dashboard added to the Dashboard page.
