
Customizing AWS CloudWatch DataSources
Last updated - 24 July, 2025
You can customize the CloudWatch DataSources if you cannot find the desired metrics via LogicMonitor’s CloudWatch coverage and LogicMonitor’s Collector. Some of the ways you can customize CloudWatch DataSources include:
- Adding or modifying dimensions for the metrics collected: You can easily add the dimensions to the metric paths for existing DataSource definitions. In some cases, where dimension values are dynamic and not static, an Active Discovery method is the most efficient way to “discover” the dimension values as instances and monitor the associated metrics. For more information, see What is Active Discovery?
- Adding new metrics to be collected: If you publish your custom metrics to AWS CloudWatch, you can quickly modify existing LogicMonitor AWS DataSources or create new AWS DataSources to collect these metrics.
Prerequisites
- An AWS account that is integrated with LogicMonitor. For more information, see AWS environment to LogicMonitor.
Customizing AWS CloudWatch DataSources
To add dimensions to a new or an existing DataSource, complete the following steps:
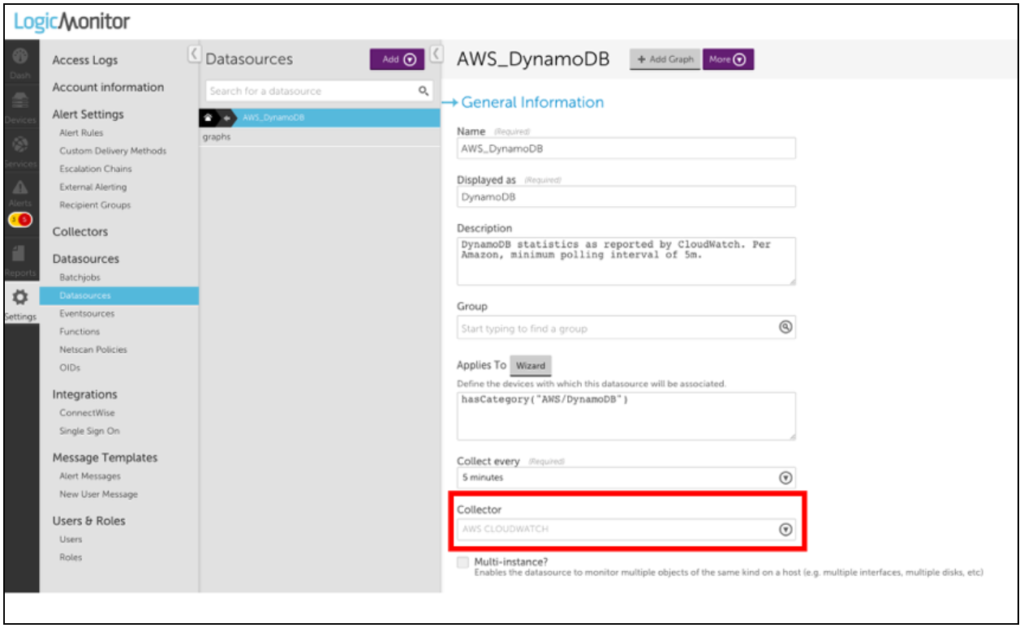
1. Navigate to Settings > LogicModules > DataSources and search for AWS Datasources.
Note: Most of LogicMonitor’s AWS Datasources are already configured to query the CloudWatch API. If the Collector field has a value of AWS CLOUDWATCH, then you can easily modify or clone it to collect your custom metrics.
2. Select the datapoint for which you want to collect the custom data.
Note: You must select Normal datapoints to add dimensions.
3. Click the Settings icon, next to the selected datapoint.
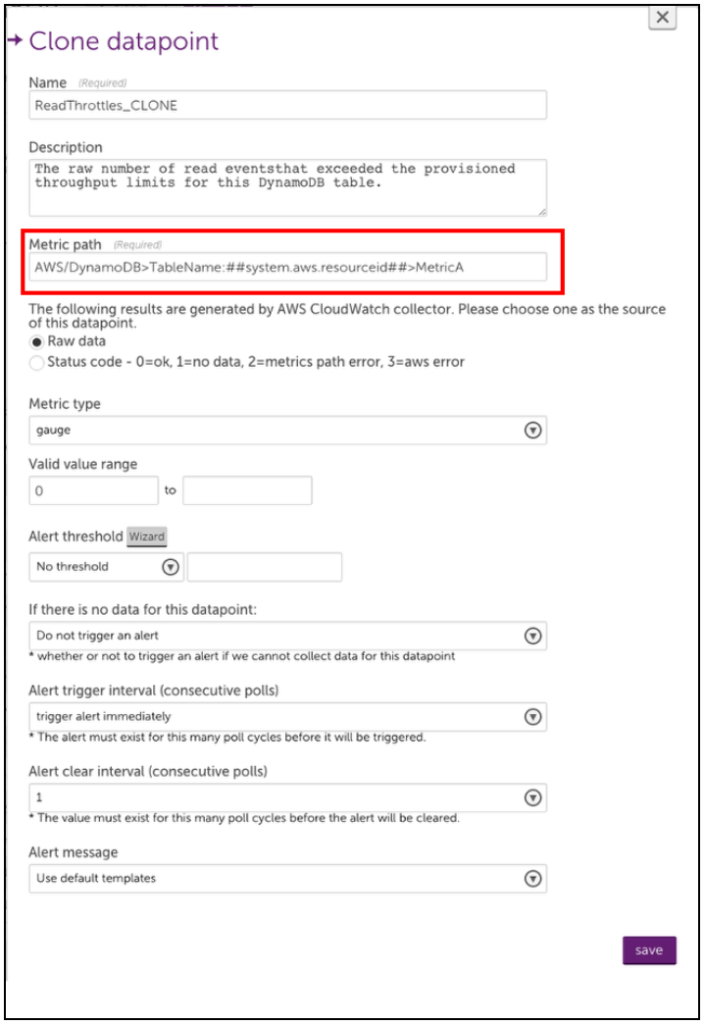
4. On the Edit Normal Datapoint dialog box, click Clone.
5. Rename the cloned datapoint and edit the metric path.
The syntax for the Metric path is:
Namespace>Dimensions>Metric>AggregationMethod
Where Dimensions should be one or more key-value pairs in this format:
DimensionName1:DimensionValue1>DimensionName2:DimensionValue2
Note: Because spaces are allowed in CloudWatch metric names, white spaces in the metric path will be interpreted by LogicMonitor as a space in the specified name. Avoid using spaces where they aren’t included in your CloudWatch metrics. Also, some metrics may not have an aggregation method or may only expose certain aggregation methods. The easiest way to ensure that you construct the metric path correctly is to use an AWS tool such as the AWS CLI to list metrics. After doing so, you can edit the Metric Path for a cloned or new datapoint.
Note: You can use an equal sign “=” to delimit the key-value pairs when the metric path in AWS CloudWatch contains a colon “:”.
For example, you can define the metric path for an AWS SES datasource with:
AWS/SES>ses:configuration-set=##system.aws.resourceid##>Send>Average
6. Save your new datapoint and then save the DataSource. LogicMonitor will automatically begin collecting this data for any AWS device that the edited DataSource is applied to.
Note: You can define custom AWS Cloudwatch metrics that include “greater than” and “less than” characters in the metric path. But because the “>” character is interpreted as a dimension separator, you need to substitute the “” characters with “[[” and “]]” respectively. For example, the metric path cloudwatch>path should be entered as cloudwatch]]path within LogicMonitor.
Example 1
The following example illustrates adding a datapoint to the AWS_Route53 DataSource to monitor SSLHandshake Time. This is not a custom CloudWatch metric, this was recently introduced by AWS and will be added automatically to the AWS_Route53 DataSource. However, the process for editing or adding the datapoints to AWS DataSources is illustrated.
A list-metrics with the AWS CLI displays the following:
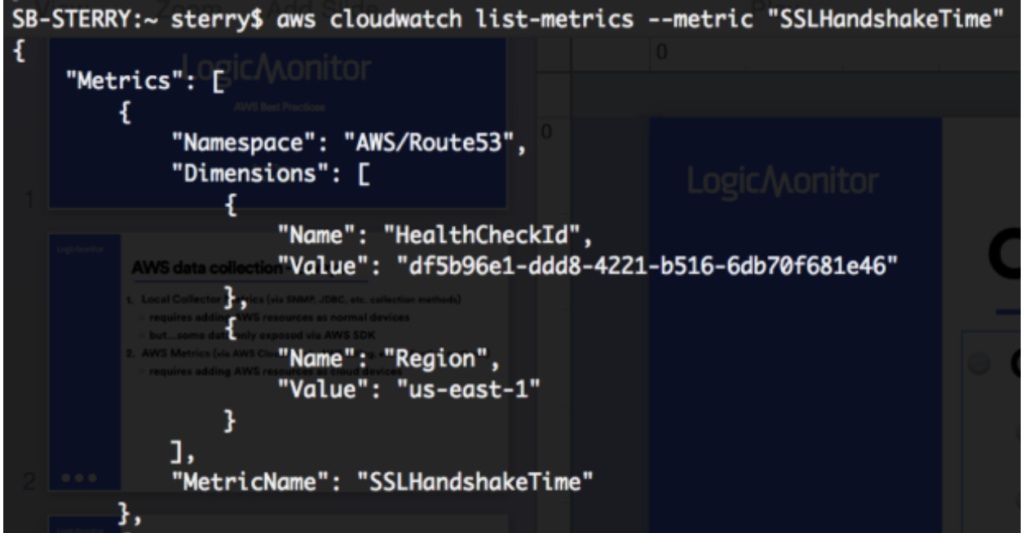
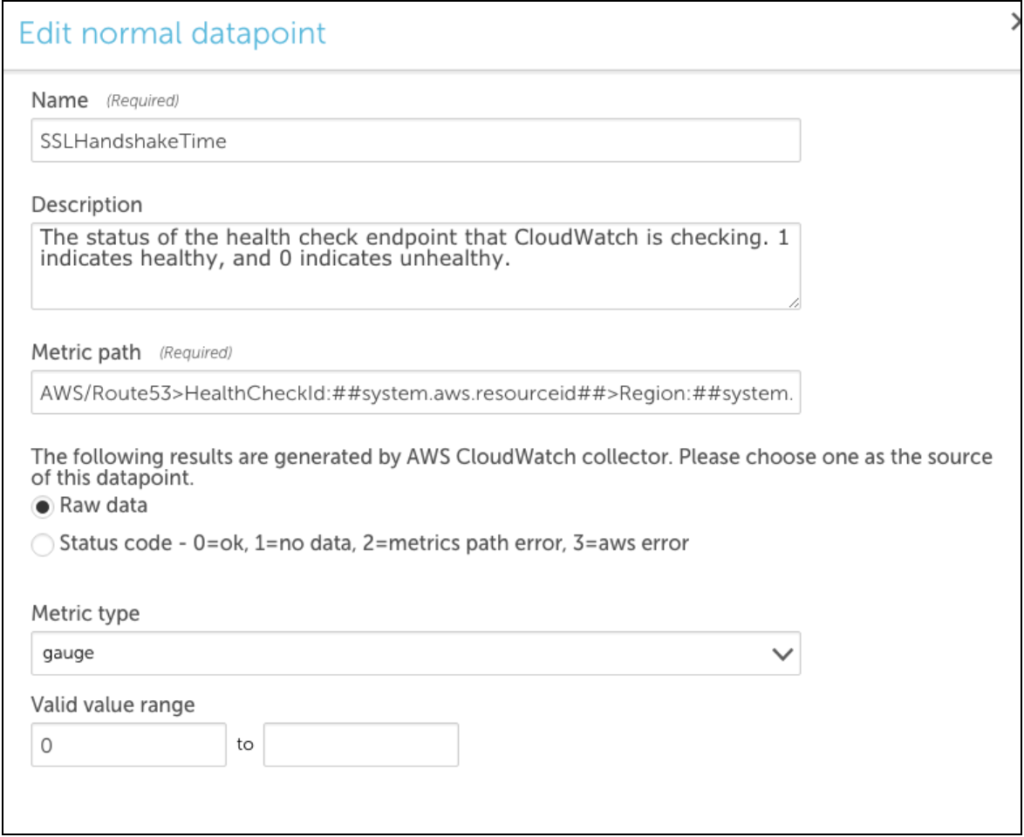
You can clone an existing datapoint for the AWS_Route53 DataSource and change the metric path to the following:
AWS/Route53>HealthCheckId:##system.aws.resourceId##>Region:##system.aws.region##>SSLHandshakeTime>Average
Example 2
The following example illustrates how to create a multi-dimensional DataSource using the Active Discovery method. Two dimensions are required, viz the device dimensions and the instance dimensions.
The device dimension specifies under which device the instances are displayed in LogicMonitor.
For example: If you are creating a multi-dimensional S3 bucket DataSource. You must enter BucketName and ##system.aws.resourceid## for Device Dimension Name and Device Dimension Value fields respectively.
The instance dimension discovers instances and will always contain ##wildvalue## value in the metric path. So, for S3 bucket DataSource example, you will enter StorageType in the Instance Dimension Value field.
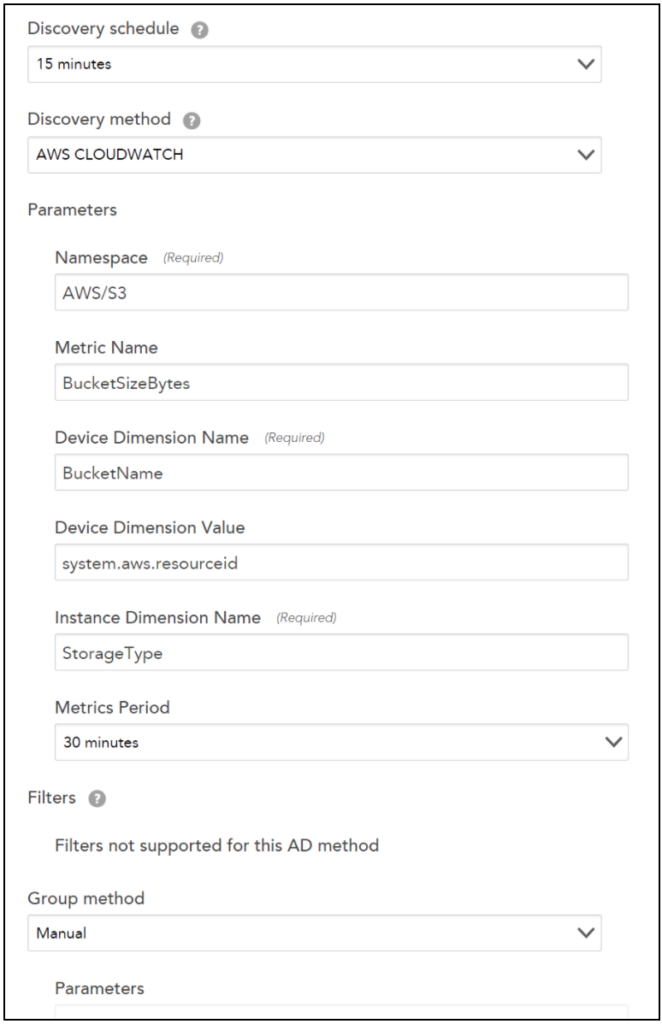
Note: For editing the metric paths for datapoints that are using the Active Discovery method, a standard metric path is followed for Cloudwatch in LogicMonitor:
Namespace>Dimensions>Metric>AggregationMethod
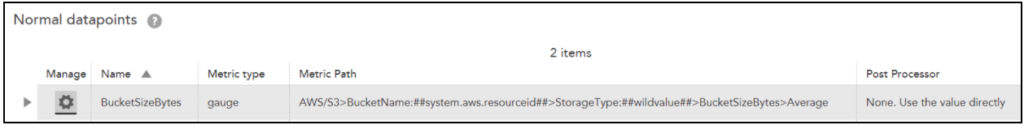
Let’s continue with the S3 bucket DataSource example. Following will be the metric path:
AWS/S3>BucketName:##system.aws.resourceid##>StorageType:##wildvalue##>BucketSizeBytes>Average
Troubleshooting
Typically, issues arise because of the following:
1. Incorrect Metric Path Syntax. Consider using a tool like the AWS CLI to confirm the syntax is correct.
Note: You can use the AWS CLI to verify the names of the metrics, dimensions, and aggregation types. For more information, see AWS services that publish CloudWatch metrics.
2. Incorrect Aggregation Method. Is the aggregation method you are trying to use valid for the desired Metric?
3. Insufficient Permissions. Sometimes, custom CloudWatch metrics can require permissions beyond what you may have provisioned to your LogicMonitor user.
You can identify which specific issue is occurring with the Poll Now functionality for your DataSource – you can find the Poll Now option on the Raw Data tab. On the Raw Data tab, the request that LogicMonitor makes to AWS for your DataSource, as well as any errors AWS returns is displayed.
