
LM Cloud Monitoring Overview
Last updated – 24 July, 2025
LM Cloud provides seamless setup and API-based monitoring of AWS, GCP, and Microsoft Azure environments. It also supports business-critical SaaS applications, such as Office 365, Salesforce, Zoom, or any supported by Atlassian Statuspage.io. It includes a fast, three-step setup wizard that automatically discovers, applies, and scales monitoring for your entire Cloud ecosystem. LM Cloud offers executive-level dashboards and deep-dive technical insights into AWS, GCP, and Microsoft Azure together with other infrastructure on one unified platform.
Cloud Monitoring Strategy
The Cloud monitoring strategy includes the following components critical to measuring the overall health and performance of your Cloud infrastructure.
| Component | Description |
| Resource Performance and Events | Performance data, such as metrics for CloudWatch, Azure Monitor, and LogicMonitor Collector (Application, OS-level, and custom). Event data, such as CloudWatch Events and Azure Activity Log Events. |
| Cloud Provider Availability | Availability data, such as data provided by AWS and Azure status RSS feeds. Data is measured by the LogicMonitor Collector, and scheduled maintenance events. Service Limit Utilization data. |
| Spend and Billing Information | Return On Investment (ROI) metrics, including spend data per region, service, or tag. Reserved instances offer expiration dates. |
Cloud Data Collection
LogicMonitor collects data using the following methods:
- Application program interface (API) offered by the Cloud provider
- LogicMonitor Collector
A LogicMonitor Collector is not required for LM Cloud, but it provides more comprehensive monitoring for your Cloud resources. It offers OS-level, application, and custom metrics for AWS EC2 instances and Azure VMs, which are not available through their monitor APIs. For example, a collector installed within AWS monitors Apache running on any EC2 instance and traditional OS-level metrics such as disk usage and memory usage (not reported with AWS CloudWatch). The collector also offers Cloud provider availability checks. For more information, see About the LogicMonitor Collector.
Cloud Monitoring Setup Wizard
Cloud monitoring begins with a setup wizard that automatically discovers your Cloud account and adds it to your LogicMonitor resources. The wizard collects permissions, services, and billing information about your Cloud account. Once the information you provide is submitted and verified, your Cloud environment is added to the LogicMonitor Resources page. There are setup wizards for:
Cloud Resources
Cloud resources automatically discovered by the setup wizard are displayed on the Resources page. DataSources that are pre-configured to perform API calls and queries are automatically applied to discovered resources. If you have a collector deployed within your Cloud environment, traditional collector DataSources based on SNMP or WMI, are also automatically applied to discovered resources. Cloud resources are displayed in the Resources Tree as follows:
| Resource | Description |
| Cloud Account Group | Top-level group that contains all monitored Cloud resources and services. This group uses the name provided in the setup wizard.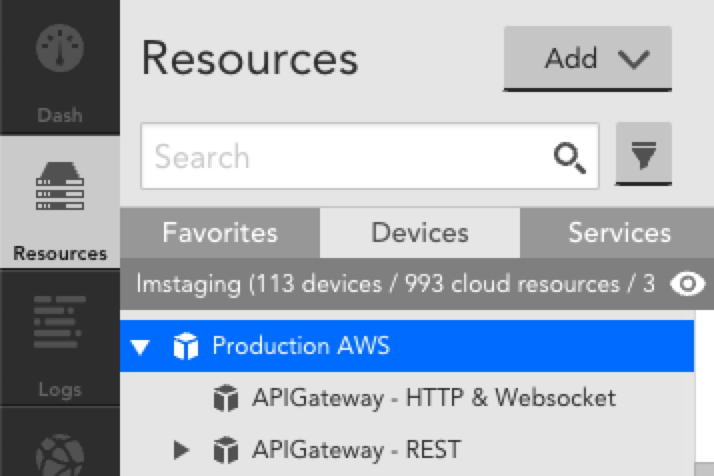 |
| Cloud Service Group | Service-level group that includes all resources for a specific Cloud service. Each service may include: * Resource or resource group * DataSource or DataSource group * Instance or instance group 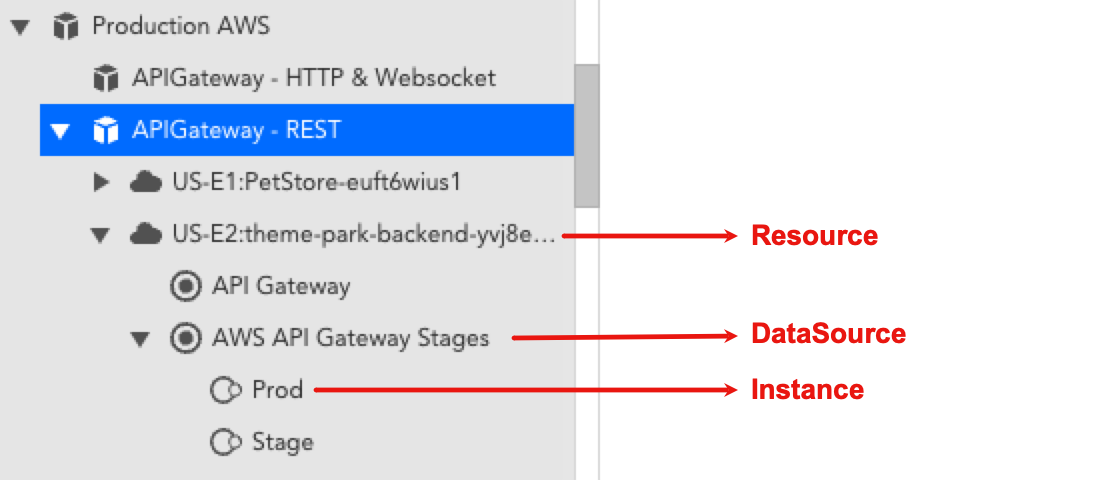 |
| Cloud Account Resource | Account-level resource that displays Cloud account information that is not tied to a specific service. This resource is named based on the name provided in the setup wizard and includes information about: * Account-level health * Service limit utilization * Provider service disruptions or outages 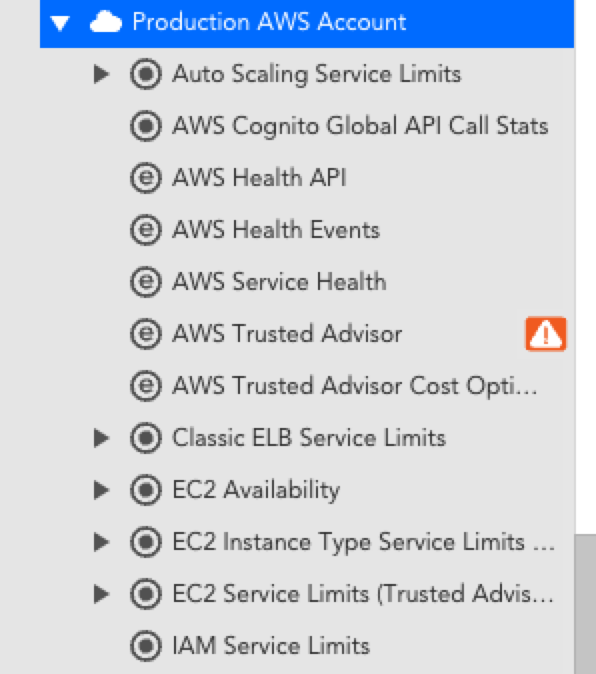 |
Billing Monitoring
You can monitor billing information about your Cloud accounts. For more information:
Dashboards and Reports
LogicMonitor automatically creates dashboards and reports when you add an AWS, Microsoft Azure, or GCP account into monitoring. This provides you with instant visibility into your cloud environments and includes both overview and service-specific views. These dashboards and reports provide a starting point based on best practices, but you can customize them for your specific environment. For more information, see Dashboard Overview.
The following dashboards and reports are auto-generated for AWS, Microsoft Azure, and GCP accounts:
- Cloud environment overview
- Service-specific dashboards for AWS EC2 and EBS
- Service utilization
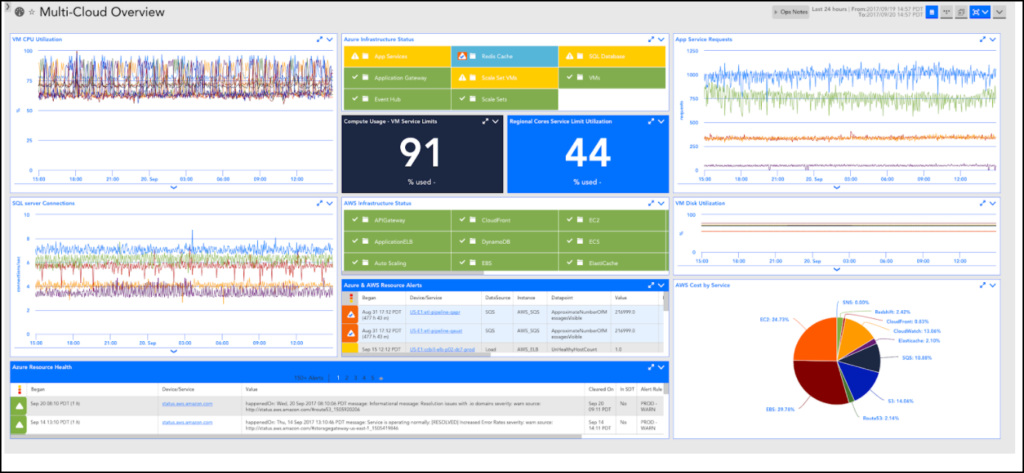
Note: The information displayed depends on the services you select for monitoring. A dashboard group and a report group are automatically generated and added for AWS, Microsoft Azure, or GCP accounts into LogicMonitor. Dashboard and report groups are named based on the name you assigned the AWS, Microsoft Azure, or GCP account in LogicMonitor.
Cloud Resource Tagging and Filtering
Tags are key-value pairs (metadata) that you set in your Cloud provider console (AWS, Azure, GCP). You can use tags to help identify and organize your Cloud resources.
Tags
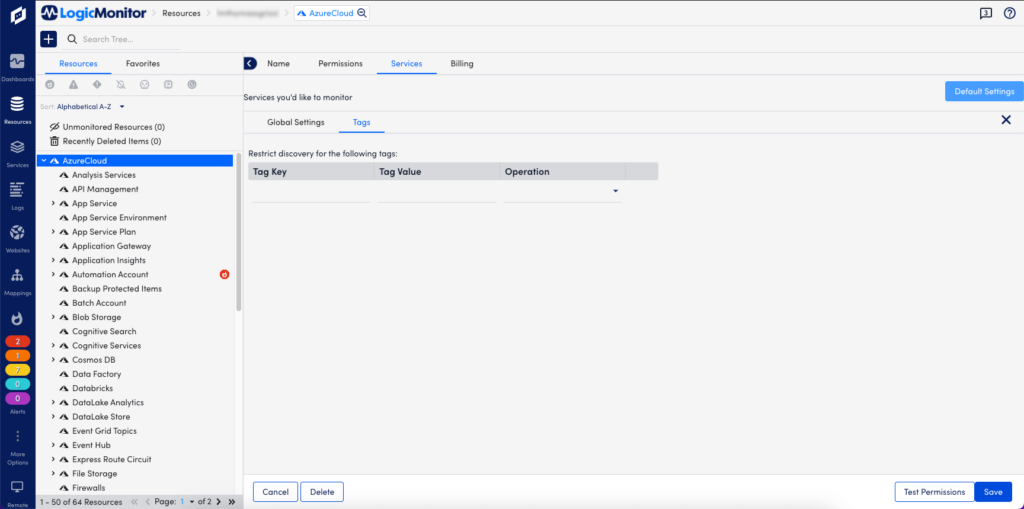
Once resources are discovered and added to LogicMonitor, any tags associated with those resources are added as resource properties. You can access tags in LogicMonitor by navigating to the Cloud resource and selecting Manage > Services > Default Settings > Tags.
Note: Tags are case-sensitive. For more information about tags, refer to the Cloud provider documentation for AWS, Azure, or GCP respectively.
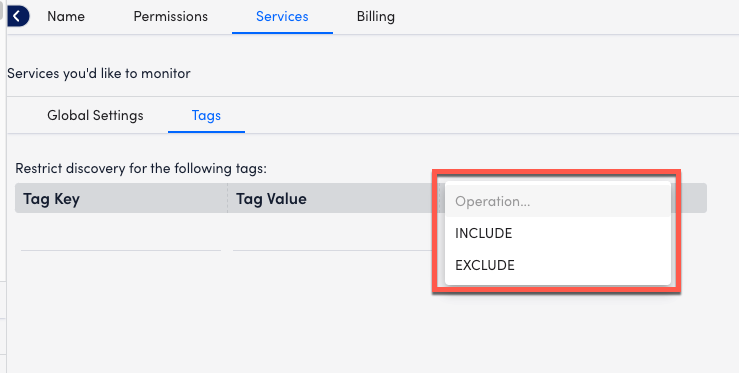
Tag Filters
Using tag filters, you can determine which Cloud resources are auto-discovered by LogicMonitor. You can perform Include or Exclude operations on the Tag Key and Tag Value that you enter. Glob expressions are also supported for tag filtering. For more information, see Using Glob Expressions.
Tag Formatting
Tags are added and displayed as device properties in the following format:system.<cloud-provider-name>.tag.NAME=VALUE
NAME and VALUE refer to the name and value of the tag, respectively. Tag filters are case sensitive. For example, the following table displays how LogicMonitor property names correspond to an AWS tag name:
| LogicMonitor Property Name | AWS Tag Name |
| system.aws.tag.team | team |
| system.aws.tag.aws:cloudformation:stack-name | aws:cloudformation:stack-name |
Tag Referencing
You can reference tags throughout your LogicMonitor account. For example, to create a dynamic group of AWS resources that have a specific tag, you could use the following AppliesTo (custom query):
system.aws.tag.NAME=~“VALUE”
Note: If a tag name or value contains special characters, you will need to use the getPropValue function in the AppliesTo field. For more information, see AppliesTo Scripting Overview.
Monitored Locations
Locations, also referred to as regions or zones depending on the Cloud provider, are the geographical locations of data centers or hubs where Cloud resources reside. These are displayed on the Locations tab on your Resources page. LM Cloud includes the following locations.
Note: For information about monitored services, see Cloud Services and Resource Units.
AWS Locations
| Code | Location |
| af-south-1 | Africa (Cape Town) |
| ap-east-1 | Asia Pacific (Hong Kong) |
| ap-northeast-1 | Asia Pacific (Tokyo) |
| ap-northeast-2 | Asia Pacific (Seoul) |
| ap-south-1 | Asia Pacific (Mumbai) |
| ap-southeast-1 | Asia Pacific (Singapore) |
| ap-southeast-2 | Asia Pacific (Sydney) |
| ap-southeast-3 | Asia Pacific (Jakarta) |
| ca-central-1 | Canada (Central) |
| eu-central-1 | Europe (Frankfurt) |
| eu-north-1 | Europe (Stockholm) |
| eu-south-1 | Europe (Milan) |
| eu-west-1 | Europe (Ireland) |
| eu-west-2 | Europe (London) |
| eu-west-3 | Europe (Paris) |
| me-south-1 | Middle East (Bahrain) |
| sa-east-1 | South America (São Paulo) |
| us-east-1 | US East (N. Virginia) |
| us-east-2 | US East (Ohio) |
| us-west-1 | US West (N. California) |
| us-west-2 | US West (Oregon) |
For more information, refer to the AWS documentation for Regions and Zones.
Azure Locations
| Code | Location |
| australiacentral | Australia (Canberra) |
| australiacentral2 | Australia (Canberra) |
| australiaeast | Australia (New South Wales) |
| australiasoutheast | Australia (Victoria) |
| brazilsouth | Brazil (São Paulo State) |
| canadacentral | Canada (Toronto) |
| canadaeast | Canada (Quebec City) |
| centralindia | India (Pune) |
| centralus | US (Iowa) |
| chinaeast | China (Shanghai) |
| chinaeast2 | China (Shanghai) |
| chinaeast3 | China (Shanghai) |
| chinanorth | China (Beijing) |
| chinanorth2 | China (Beijing) |
| chinanorth3 | China (Hebei) |
| eastasia | Asia (Hong Kong) |
| eastus | US (Virginia) |
| eastus2 | US (Virginia) |
| francecentral | France (Paris) |
| germanycentral | Germany (Frankfurt) |
| japaneast | Japan (Tokyo) |
| japanwest | Japan (Osaka) |
| koreacentral | Korea (Seoul) |
| northcentralus | US (Illinois) |
| northeurope | Europe (Ireland) |
| norwayeast | Norway (Oslo) |
| southafricanorth | South Africa (Johannesburg) |
| southcentralus | US (Texas) |
| southeastasia | Southeast Asia (Singapore) |
| southindia | India (Chennai) |
| switzerlandnorth | Switzerland (Zürich) |
| uaenorth | UAE (Dubai) |
| uksouth | UK (London) |
| ukwest | UK (Cardiff) |
| westcentralus | US (Wyoming) |
| westeurope | Europe (Netherlands) |
| westus | US (California) |
| westus2 | US (Washington) |
| westus3 | US (Arizona) |
For more information, refer to the Azure documentation for Azure geographies.
GCP Locations
| Code | Location |
| africa-south | Africa (Johannesburg) |
| asia-east1 | Asia (Taiwan) |
| asia-east2 | Asia (Hong Kong) |
| asia-northeast1 | Asia (Tokyo) |
| asia-northeast2 | Asia (Osaka) |
| asia-northeast3 | Asia (Seoul) |
| asia-south1 | Asia (Mumbai) |
| asia-south2 | Asia (Delhi) |
| asia-southeast1 | Asia (Singapore) |
| asia-southeast2 | Asia (Jakarta) |
| australia-southeast1 | Australia (Sydney) |
| australia-southeast2 | Australia (Melbourne) |
| europe-central2 | Europe (Warsaw) |
| europe-north1 | Europe (Hamina) |
| europe-west1 | Europe (St. Ghislain) |
| europe-west2 | Europe (London) |
| europe-west3 | Europe (Frankfurt) |
| europe-west4 | Europe (Eemshaven) |
| europe-west6 | Europe (Zurich) |
| europe-west8 | Europe (Milan) |
| europe-west9 | Europe (Paris) |
| europe-west10 | Europe (Berlin) |
| europe-west12 | Europe (Turin) |
| europe-southwest1 | Europe (Madrid) |
| me-central1 | Middle East (Doha) |
| me-central2 | Middle East (Dammam) |
| me-west1 | Middle East (Tel Aviv) |
| northamerica-northeast1 | North America (Montréal) |
| northamerica-northeast2 | North America (Toronto) |
| southamerica-east1 | South America (Osasco) |
| southamerica-west1 | South America (Santiago) |
| us-central1 | US (Iowa) |
| us-east1 | US (South Carolina) |
| us-east4 | US (Virginia) |
| us-east5 | US (Columbus) |
| us-west1 | US (Oregon) |
| us-west2 | US (California) |
| us-west3 | US (Utah) |
| us-west4 | US (Nevada) |
| us-south1 | US (Dallas) |
For more information, refer to the GCP documentation for Regions and zones.
