
Adding Resources
Last updated - 11 August, 2022
Resources can be added to your LogicMonitor account for monitoring using several different methods. Once a resource has been added and communication with that resource is established, LogicMonitor adds the resource to the Resources page of your LogicMonitor account. Resource information is stored as system properties which are visible on the resource’s Info tab. You can manually add properties to specify login credentials and custom port settings for that device. For more information, see Defining Authentication Credentials. DataSources and other LogicModules are automatically applied to the resource based on the information discovered.
Manually Adding Resources
You can choose between the wizard and expert mode when manually adding a resource. Wizard mode will verify that your resource is correctly configured for monitoring, while expert mode will assume you are providing correct device configuration.
Wizard Mode
From the Resources page, select the Add button and click Resource (Wizard). Use the wizard to do the following:
- Enter the IP address or DNS name of your resource.
- Select a resource group.
- Select the primary Collector for the resource you are adding. This Collector will establish communication with the resource using standard monitoring protocols.
- Click Next: Discovery.
LogicMonitor attempts to communicate with the resource using standard monitoring protocols. - If LogicMonitor cannot establish communication, you are prompted for more information regarding the resource type. You may also need to provide any passwords set for the monitoring protocols that apply to your resource, such as the rocommunity for a Linux server.
Note: You can use this area of the wizard to set and test your SNMPv3 credentials, including User Security Name, Authentication Key, Authentication Protocol, Privacy Key, and Privacy Protocol. The wizard does not currently support setting/testing SNMPv3 AuthNoPriv (no encryption) or NoAuthNoPriv (no password and no encryption), but SNMPv3 related resource properties can still be manually set for these methods. See Defining Authentication Credentials.
- If communication isn’t able to be established after providing additional information, you can choose to add the resource without credentials (minimal monitoring).
After completing the resource wizard, you can configure additional settings for the resource including: adding a resource URL, disabling alert generation, enabling NetFlow analysis, adding the resource to a resource group. To configure additional settings for the resource, locate the resource in the Resource tree and click the Manage button to open the Manage Resource dialog.
Expert Mode
If you already know which properties are needed to establish communication with your resource, or know that these properties are configured at the group level, the expert mode is an easy way to quickly add resources to your LogicMonitor account.
From the Resources page, select the Plus button and click Resource (Expert). You can use the Add Resource page to configure the following:
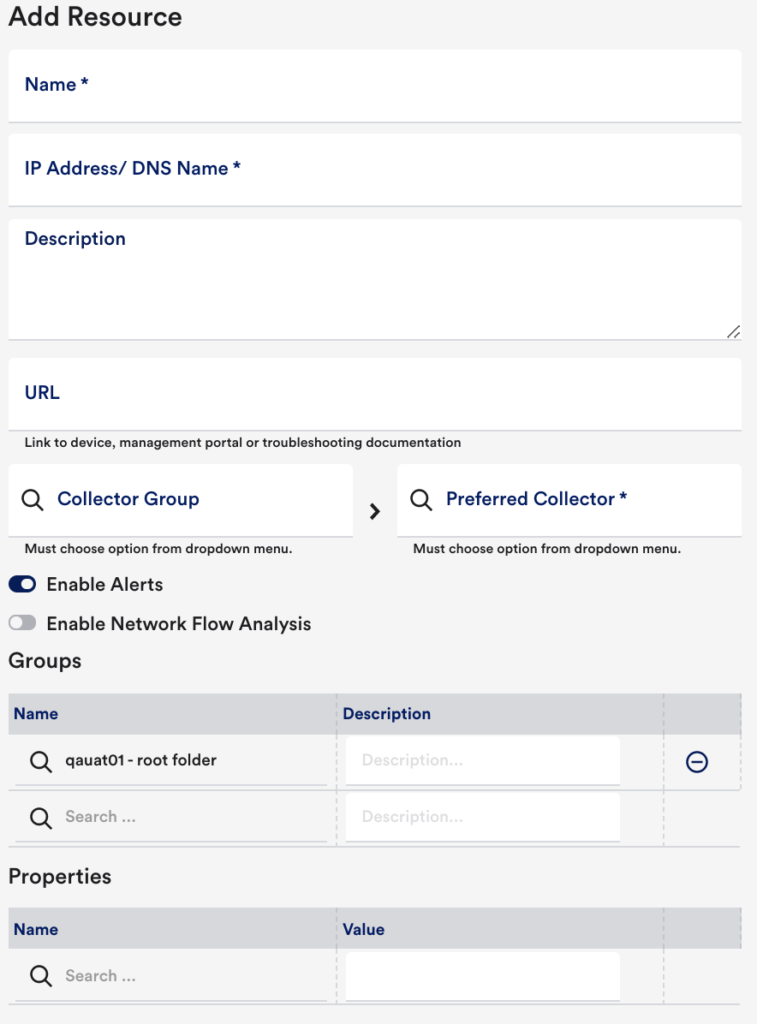
IP Address/DNS Name
Enter the IP Address or DNS Name of your resource into the IP Address/DNS name field. This is used by the Collector to establish communication.
Note: Resources with duplicate IPs can be added as long as they are monitored with distinct Collectors and have unique display names.
Name
In the Name field, enter a display name for the resource. Resource display names cannot include the operators and comparison functions listed as part of LogicMonitor’s datapoint expression syntax.
Description
In the Description field, enter a description for the resource. This description creates a system.description property. This can be used within resource searching functionality and for dynamic groups.
Link to a URL
In the Link to a URL field, enter the resource URL if one exists. You can use this to provide a link to management portals, websites, or troubleshooting documentation. An icon will display next to the device name in the header of the device detail page. When the icon is clicked, a new browser tab opens to the URL.
Enable Alerting
The Enable Alerts switch is toggled by default. If disabled, resource data will be collected but no alerts will be generated. You may want to disable this option if datapoint alert thresholds need to be adjusted prior to alert generation.
Enable Network Flow Analysis
Network Traffic Flow Analysis (NetFlow) data can be monitored for any resource with sflow, jflow, or netflow information. When the Enable Network Flow Analysis switch is toggled, you must select a Collector for NetFlow data. You must also enable NetFlow data collection on the resource itself. See Configuring Monitoring for NetFlow.
Collectors
In the Collectors section, use the Collector Group field to filter the list of available Collectors that can be assigned as the preferred Collector from the Preferred Collector field. The preferred Collector is the primary Collector responsible for collecting data from the resource. Backup Collectors are automatically assigned if the preferred Collector fails over.
Groups
In the Groups section, you can assign your resource to one or more resource groups. If you have anything selected in the Resources tree at the time you began adding this new device, LogicMonitor automatically assigns the group, if any, that encompasses whatever is currently selected. Grouping your resources in LogicMonitor can make management significantly easier and save you time when configuring alert thresholds, dashboards, reports, alert routing, and device properties. See Device Groups Overview.
Properties
In the Properties section, you can assign properties to your resource, including authentication and custom information. See Resource and Instance Properties.
Adding Resources via NetScans
You can configure LogicMonitor Collectors to scan an IP range periodically and add discovered resources into the system automatically. See Creating NetScans.
Adding Resources via LogicMonitor’s API
Adding resources via the API can be extremely useful, particularly if you are looking to do a bulk upload or want to automatically add a resource to monitoring as it’s spun up by a configuration management tool such as Puppet or Ansible. See Using LogicMonitor’s REST API.
