
Usage Reporting for APM Synthetics
Last updated – 17 March, 2026
You can leverage Usage Reporting to view the usage metrics for APM Synthetics directly in your LogicMonitor portal. LogicMonitor displays the metrics using invocations as an overall cumulative usage metric.
Billing and Usage Calculations for APM Synthetics
APM Synthetics billing is based on the total number of synthetic check invocations executed during the selected billing period. In Usage Reporting, LogicMonitor displays APM Synthetics usage as a cumulative metric using invocations. The following table explains how APM Synthetics usage is measured and applied to billing.
| Usage Element | Description | How it Affects Billing |
| Invocation | A single execution of a synthetic check | Each invocation counts as one unit toward usage |
| Synthetic Check | A configured synthetic test (for example, an HTTP or browser-based check) | One or more invocations are generated based on execution frequency |
| Execution Frequency | How often a synthetic check runs | Higher frequencies increase the number of invocations |
| Monthly Invocation Total | Total number of synthetic check invocations executed during the selected month | Used for billing calculations |
| Cumulative Usage | Aggregated invocation usage displayed over time | Reflects the invocation total applied to billing |
Note: Billing is calculated using the total number of invocations executed during the month, regardless of how synthetic checks are grouped or displayed in Usage Reporting.
Requirements for Viewing Usage Data for LM Logs
To view usage data for APM Synthetics in Usage Reporting, you must subscribe to APM Synthetics.
Viewing Usage Data for APM Synthetics
- Navigate to Settings > Usage.
- From the Products option, select “APM Synthetics.”
- To interact with the Usage Contributors table, select “All Child Accounts” from Contributor Type.
Note: APM Synthetics does not support tenant.id at this time.
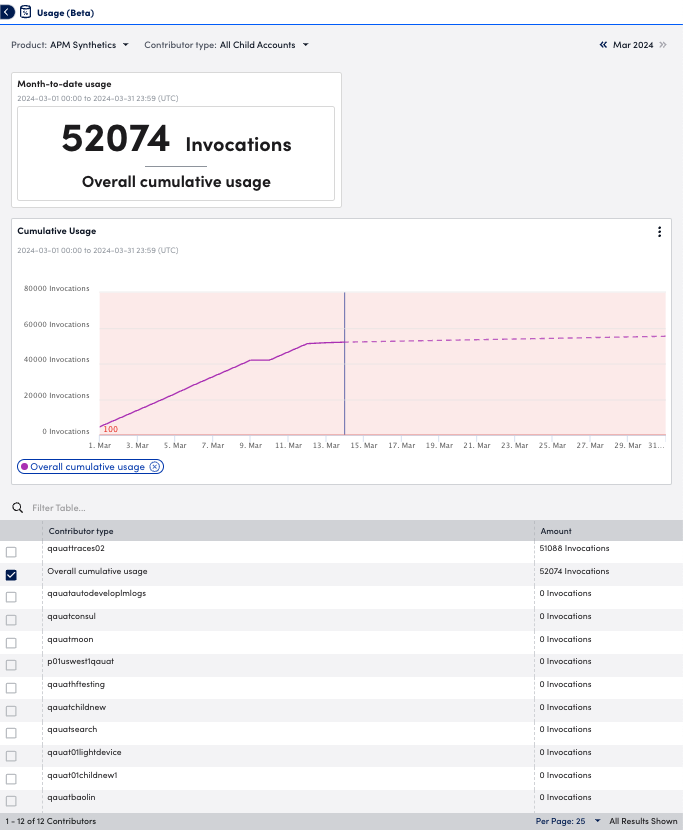
- Select the month you want to view usage for.
- To view usage in a sparkline or bar graph format in the Cumulative Usage graph, select the type of graph from the Options menu of the Cumulative Usage graph.
Note: If “All Child Accounts” is selected from Contributor Type, you must select a contributor from the Contributor Type table to display data in the Cumulative Usage graph.
