
Enabling Digital Experience in LogicMonitor
Last updated – 05 June, 2026
Digital Experience in LogicMonitor, powered by Catchpoint, enables synthetic web performance testing directly within the LogicMonitor platform to measure application performance from an end-user perspective.
Important: Catchpoint’s synthetics and digital experience monitoring capabilities are more comprehensive and are expected to replace similar existing functionality in LogicMonitor.
Integrating Catchpoint-powered Digital Experience in LogicMonitor includes the following benefits:
- End-to-end visibility—Monitors your application performance from infrastructure to real user experience
- On-demand testing—Runs web performance tests instantly from within LogicMonitor
- Faster troubleshooting—Correlates performance issues with alerts and monitored resources
You can access Digital Experience from the following pages:
- Navigation Panel—Select the
 Digital Experience icon to view the self-serve page to run and check your website performance manually
 - Resource Explorer—Select a resource group or individual resource and run a test directly from its details panel
- Resource Tree—Navigate through the hierarchy to locate a resource group or a specific resource and initiate testing
- Alerts—Open an alert tied to a resource and run a test to evaluate user impact during an incident
General Requirements for Digital Experience in LogicMonitor
To enable Digital Experience for resources, you need the following:
- Resources have a defined
lm.application-urlproperty added to support automatic test initiation. For Uptime or Website resources, automatic test initiation is supported by default. - Access is enabled from Resource Explorer and alert notifications to initiate contextual testing.
Running Digital Experience Tests from Resource Explorer
From Resource Explorer, you can navigate to a specific resource or a resource group and run a Digital Experience test to evaluate its user impact and performance.
- In LogicMonitor, navigate to Resource Explorer.
- To evaluate user impact at the different levels, do the following:
- Select the resource group, which then displays the Filtered resources details panel, and select either the Resources or Alerts tab.
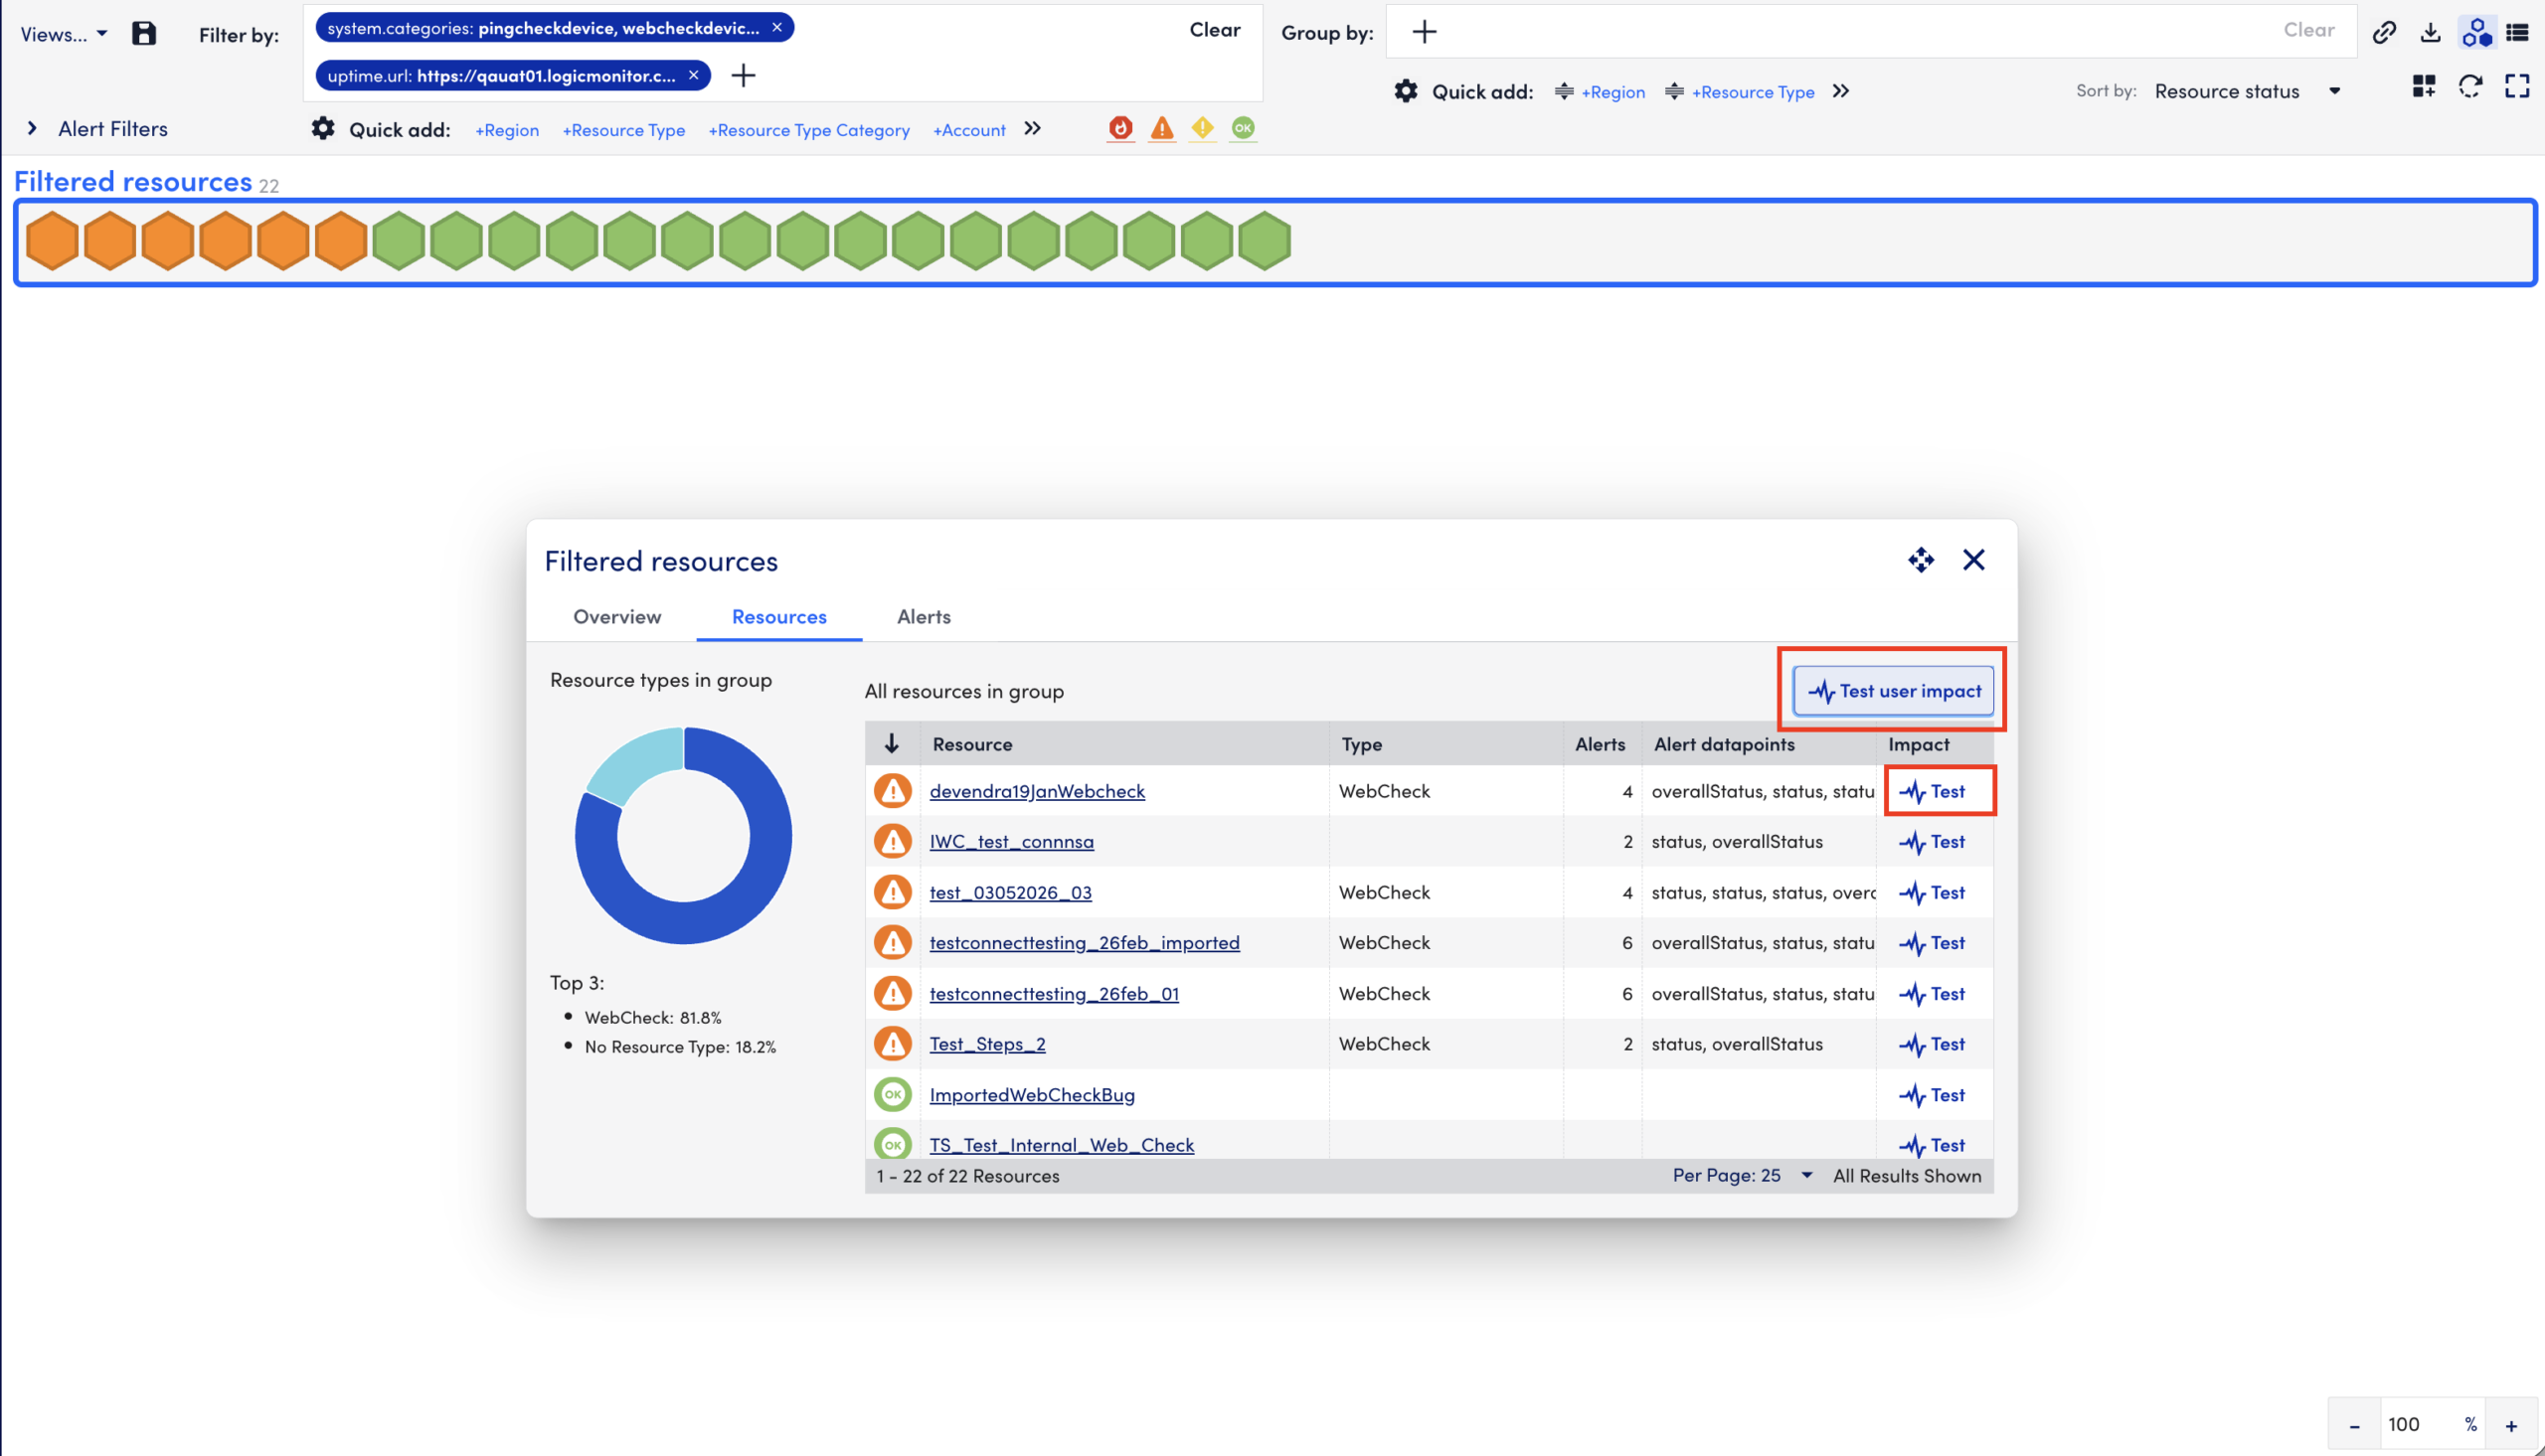
- Select the resource for which you want to evaluate user impact.
You can use the filters to locate your resource.
A panel displays summary information about the resource.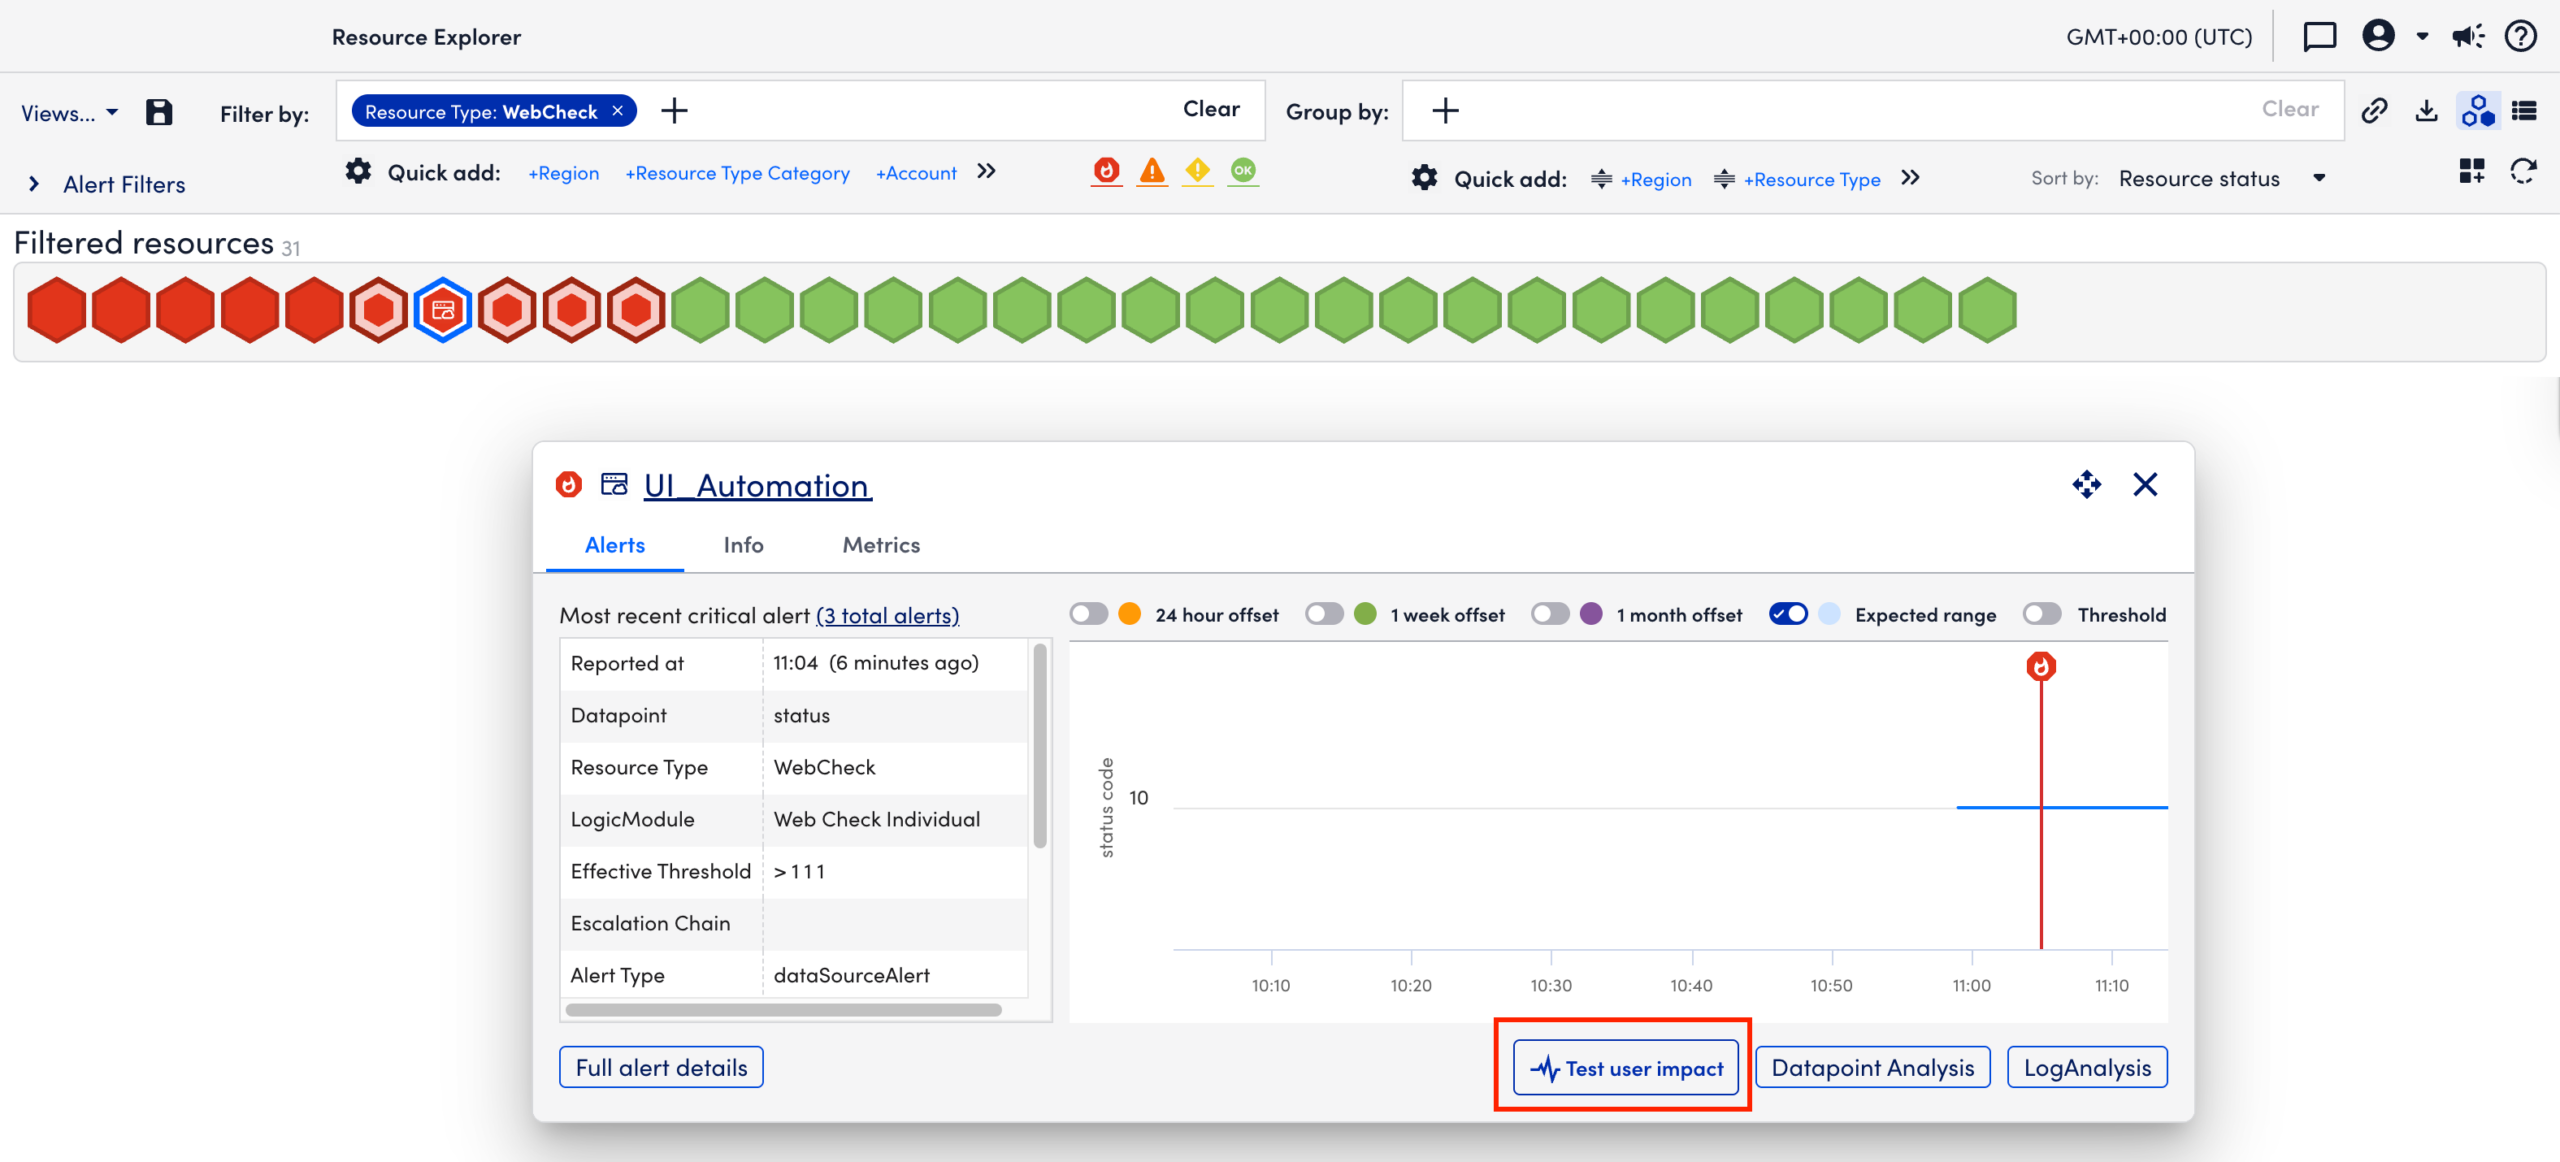
- Select the resource group, which then displays the Filtered resources details panel, and select either the Resources or Alerts tab.
Important: For Uptime or Website resources, automatic test initiation is supported by default. If you want to run a user test for non-website resources, then that resource must have lm.application_url property.
- Select Test user impact.
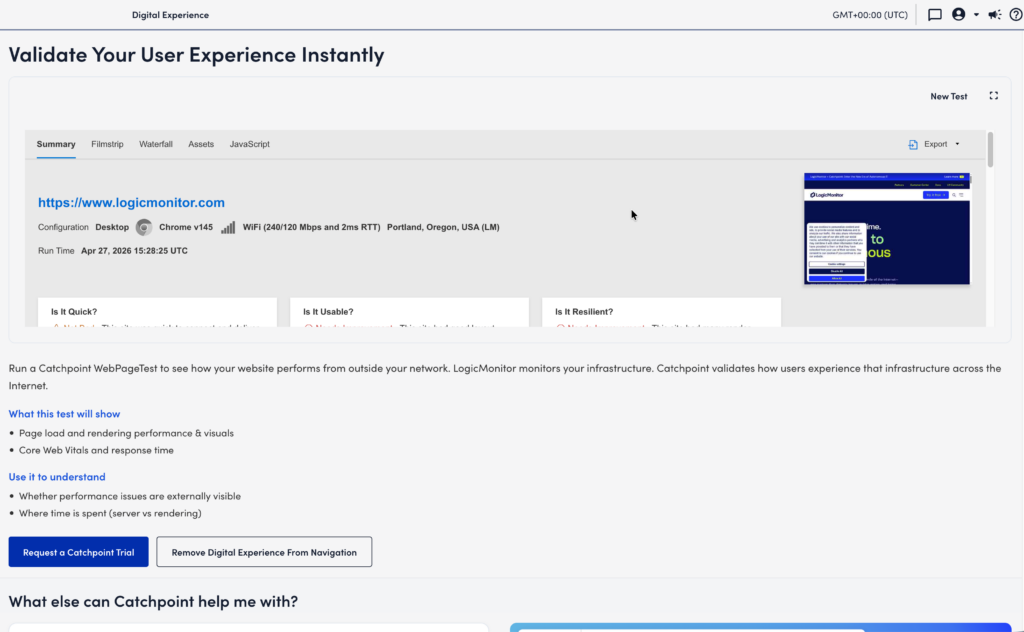
You are redirected to the Digital Experience page, where your test runs and then displays detailed information such as page performance, real usage metrics, individual runs, and so on.
Note: The results of the user impact test may take a few minutes to display on the Digital Experience page.
Running Digital Experience Tests from Resource Tree
From the Resource Tree, you can navigate through your resource hierarchy and run a Digital Experience test to evaluate user impact and performance for a selected resource or resource group.
- In LogicMonitor, navigate to Resource Tree.
- Browse or search for the resource or resource group for which you want to evaluate user impact.
You can use the filters to locate your resource.
Important: For Uptime or Website resources, automatic test initiation is supported by default. If you want to run a user test for non-website resources, then that resource must have lm.application_url property.
- You can run the user impact test in the following ways:
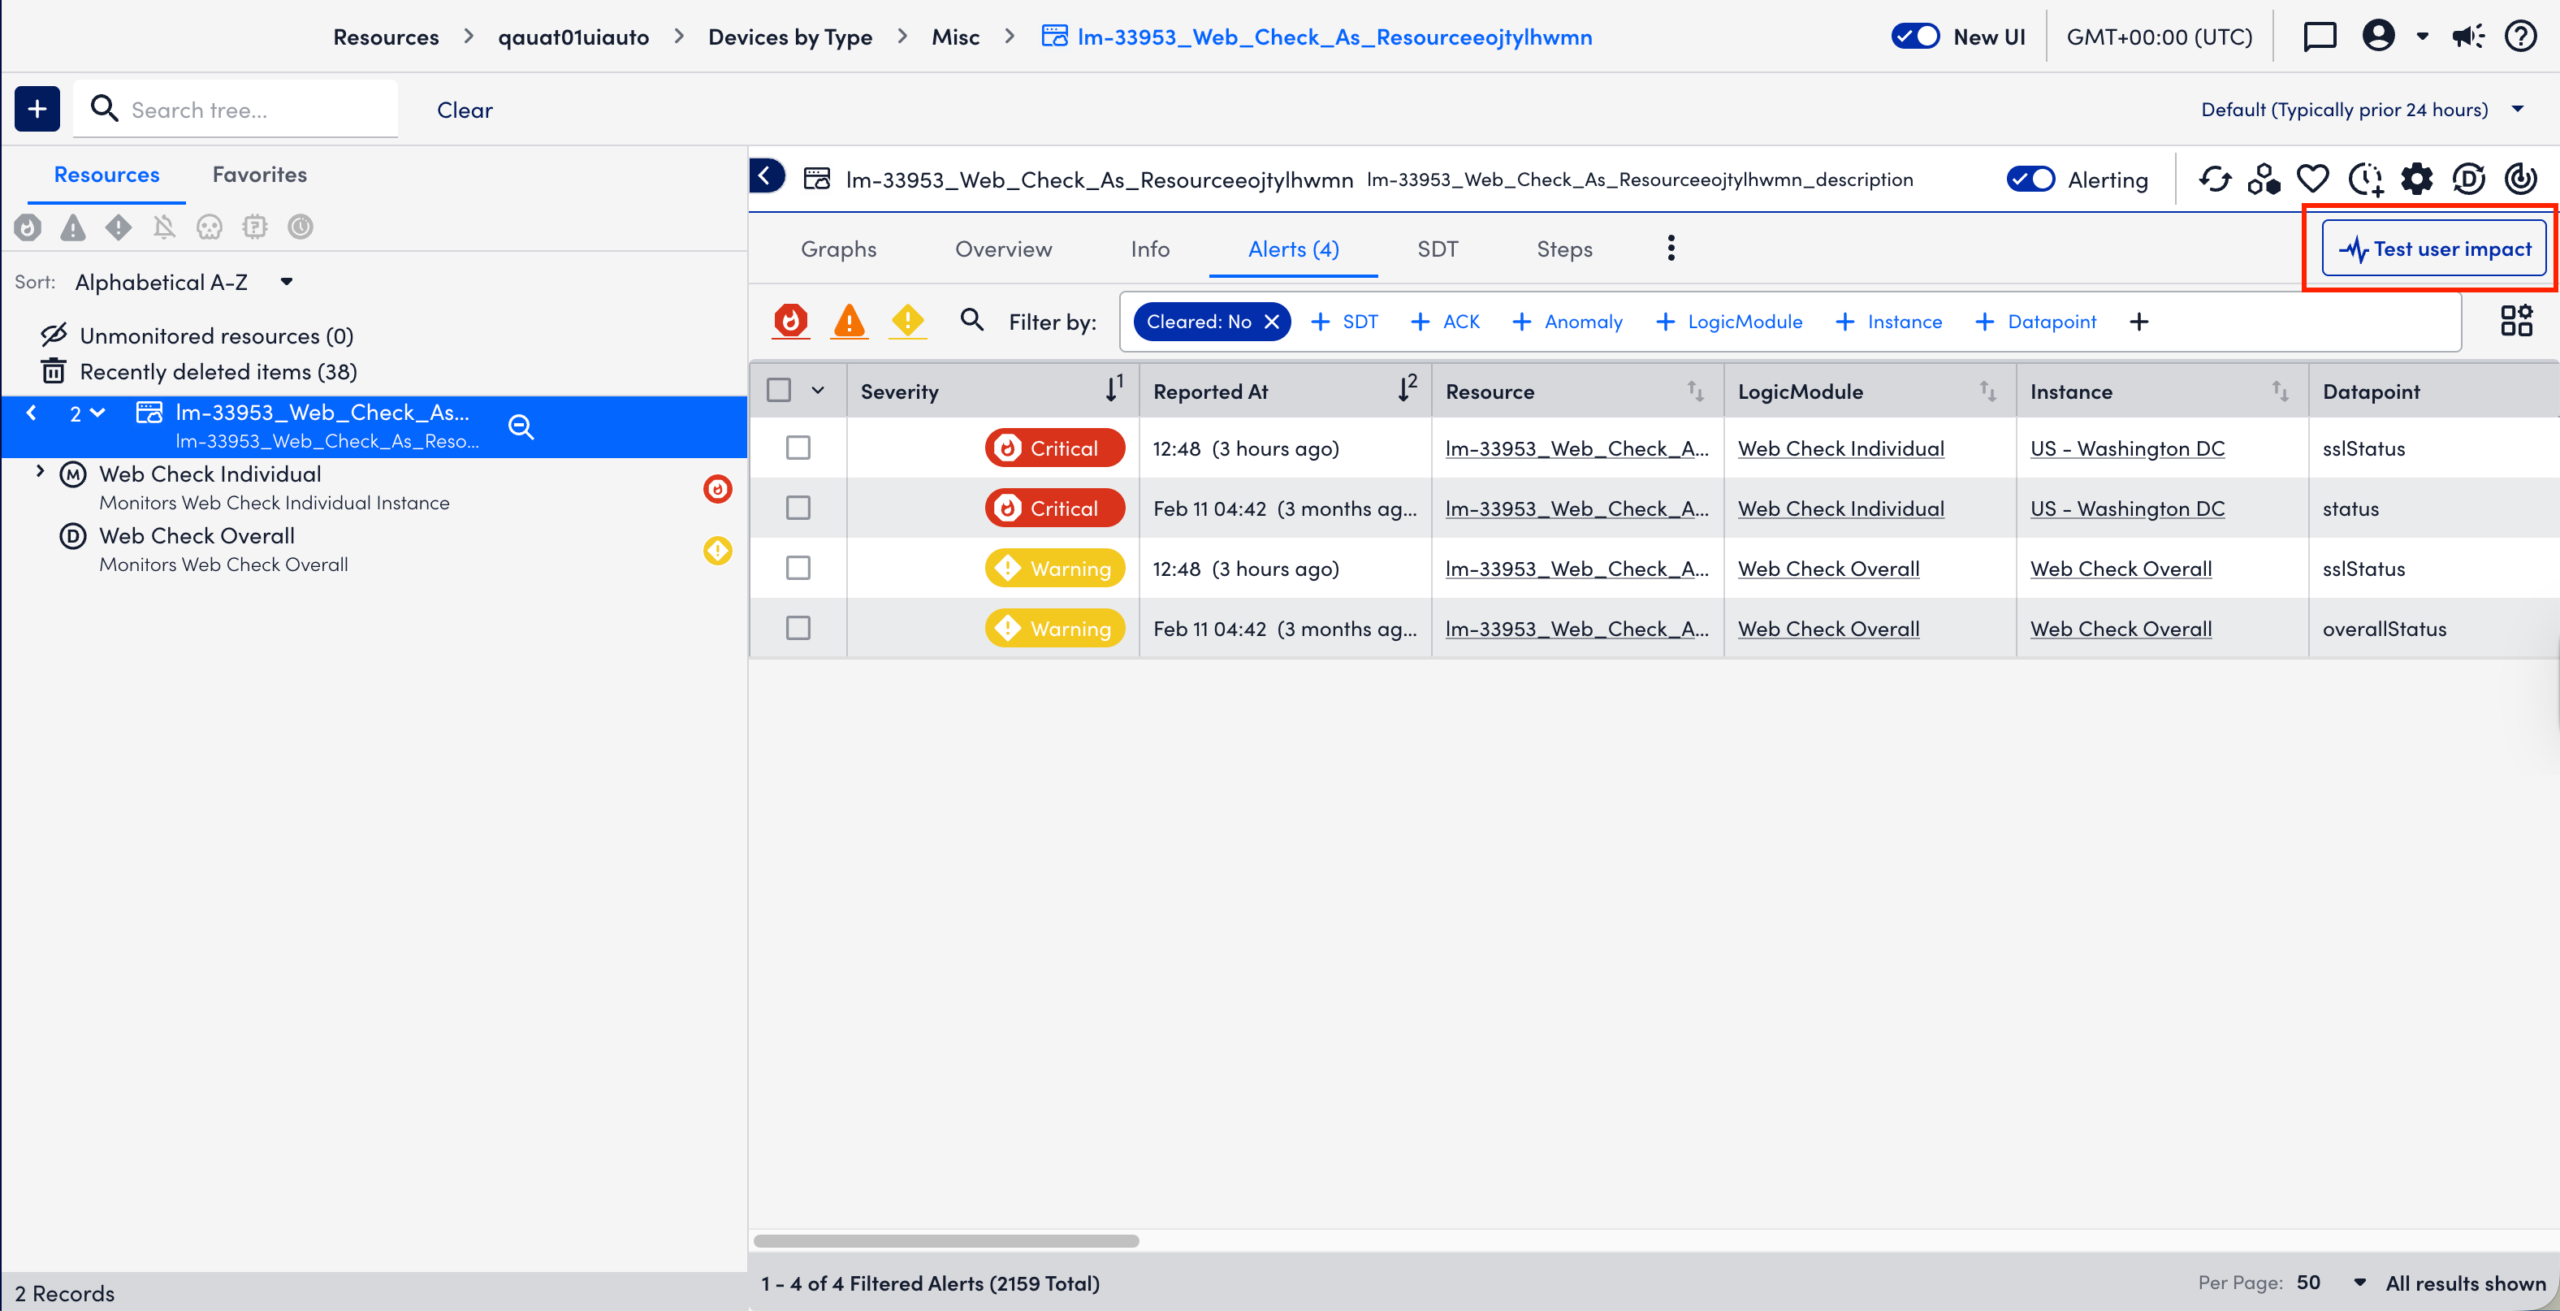
- Select Test user impact at resource-level.
- In the Alerts tab, select the alert for which you want to evaluate user impact and then select Test user impact from the Overview tab.
- Select Test user impact at resource-level.
You are redirected to the Digital Experience page, where your test runs and then displays detailed information such as page performance, real usage metrics, individual runs, and so on.
Note: The results of the user impact test may take a few minutes to display on the Digital Experience page.
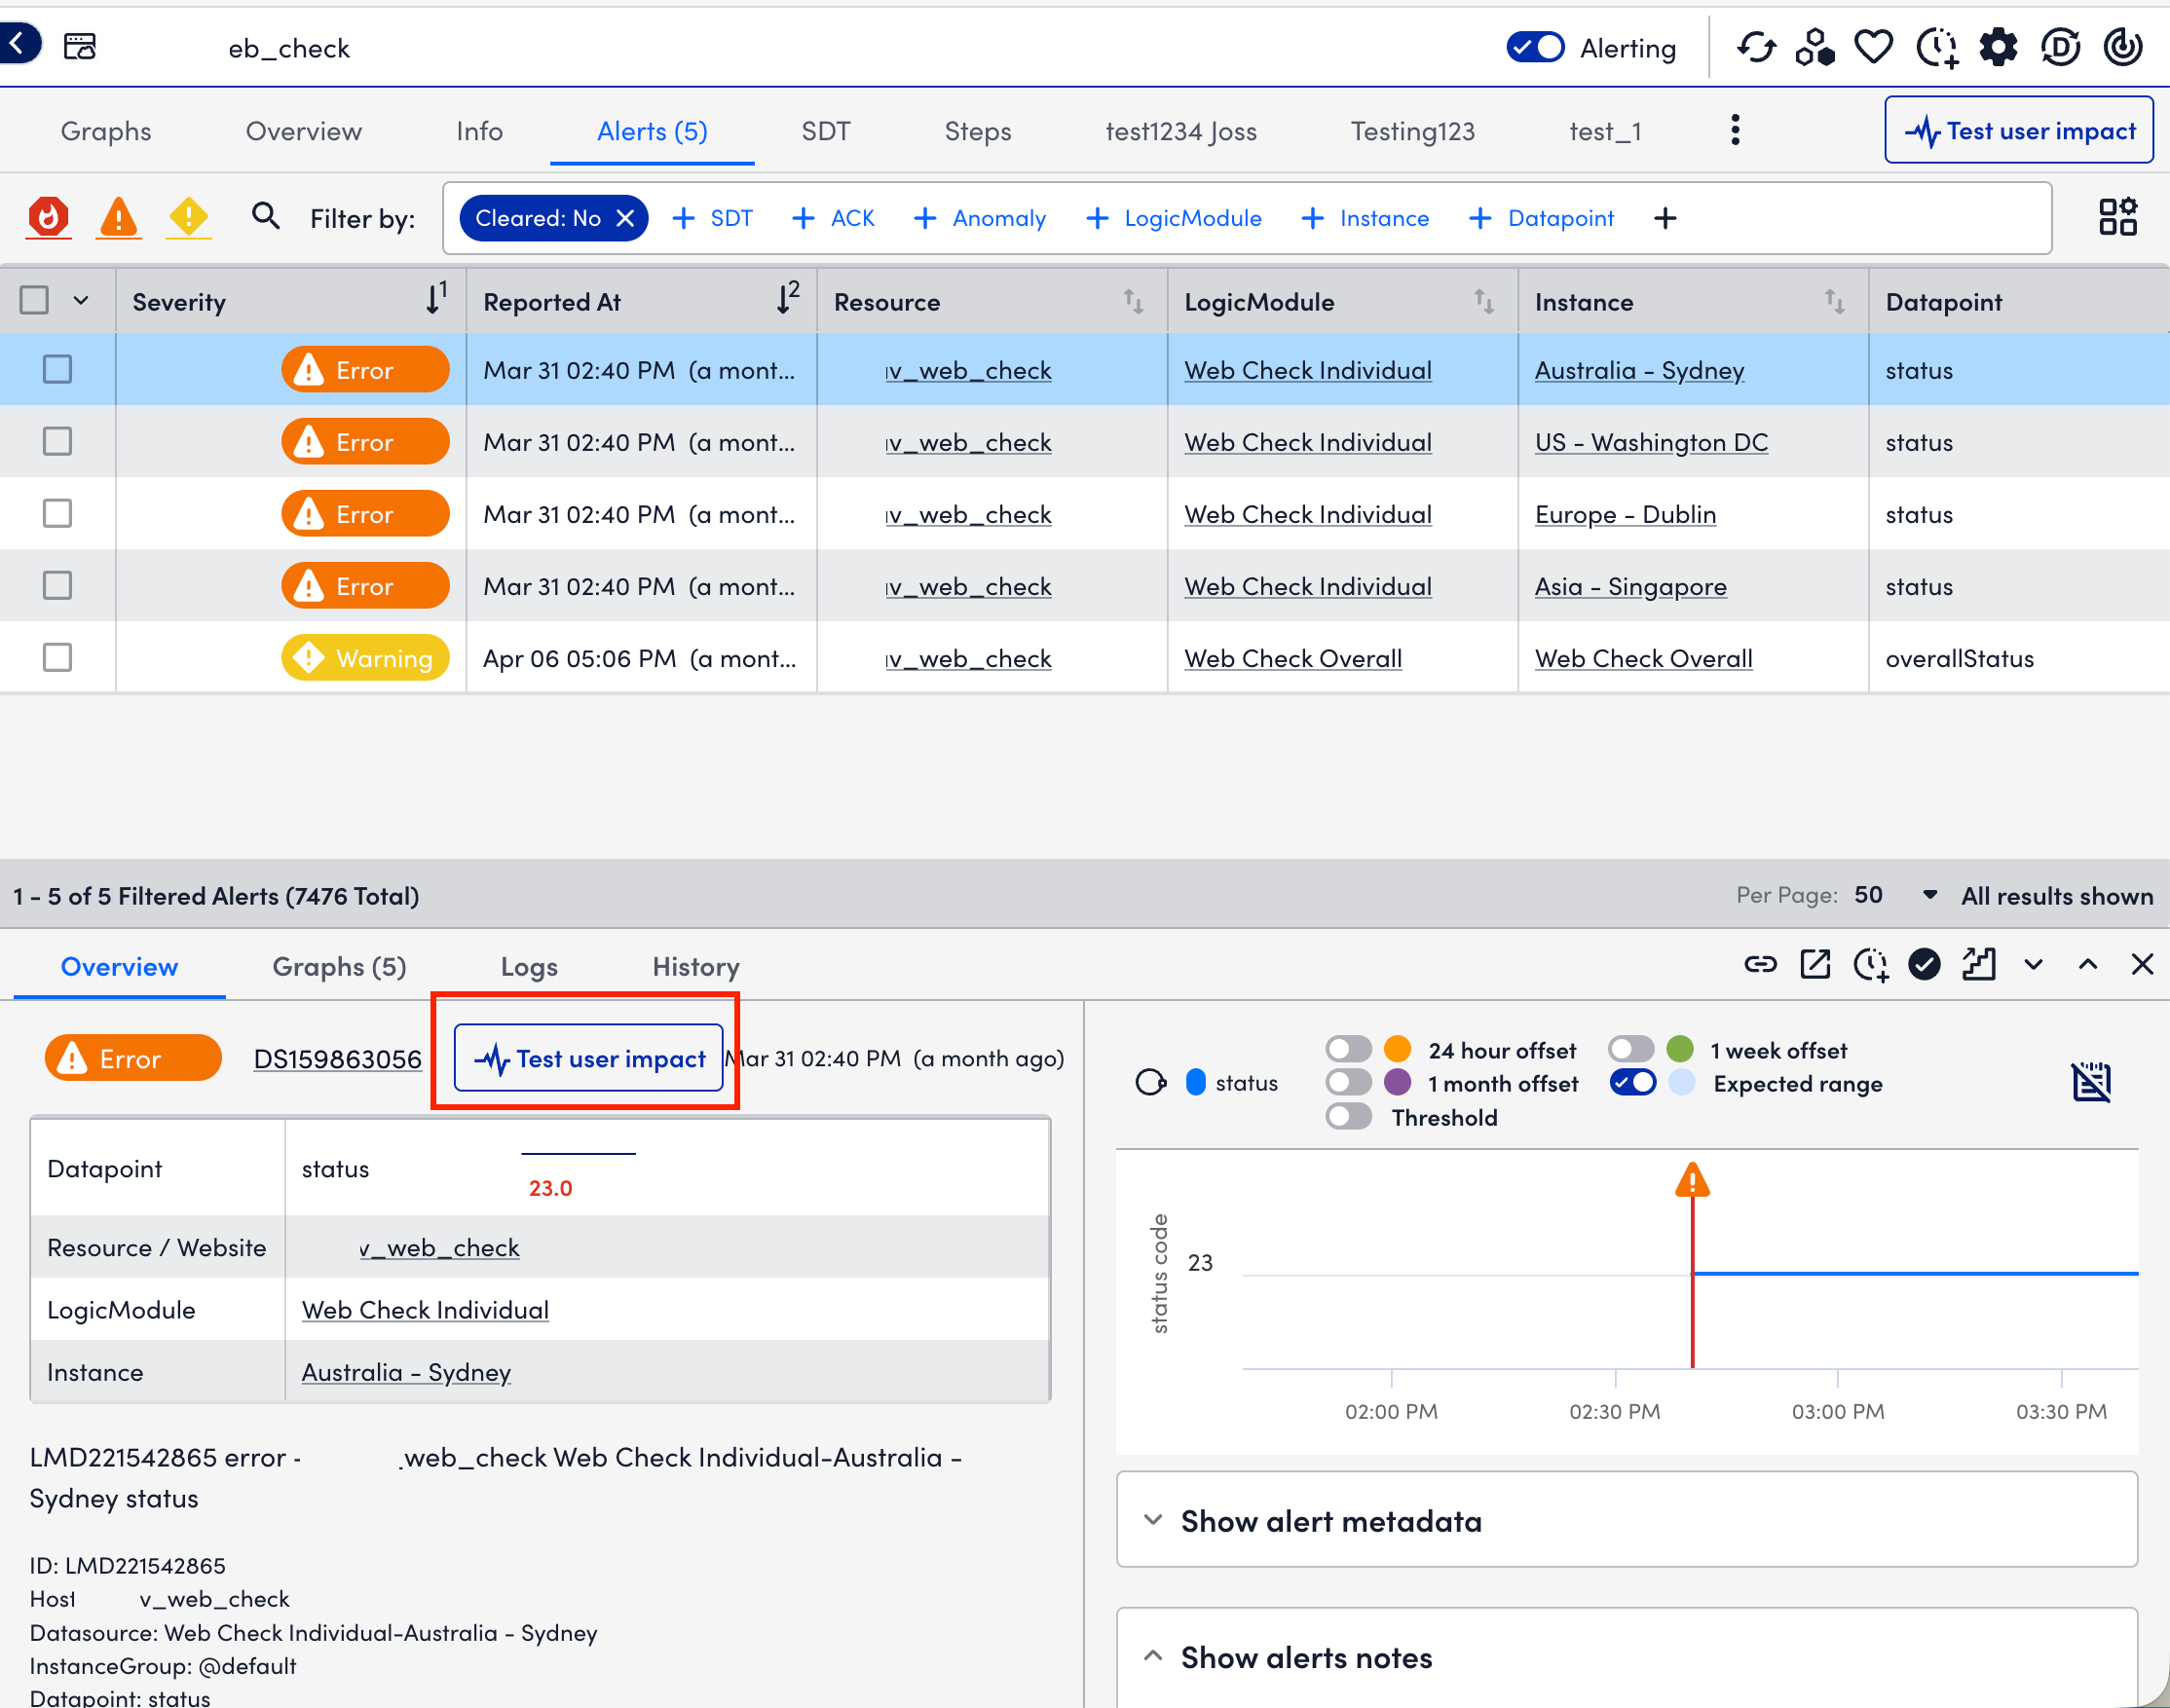
Running Digital Experience Tests from Alerts
From Alerts, you can open an alert tied to a resource and run a Digital Experience test to evaluate user impact and performance during an incident.
- In LogicMonitor, navigate to Alerts.
- Select the alert tied resource for which you want to evaluate user impact.
You can use the filters to locate your resource.
A panel displays summary information about the resource or group.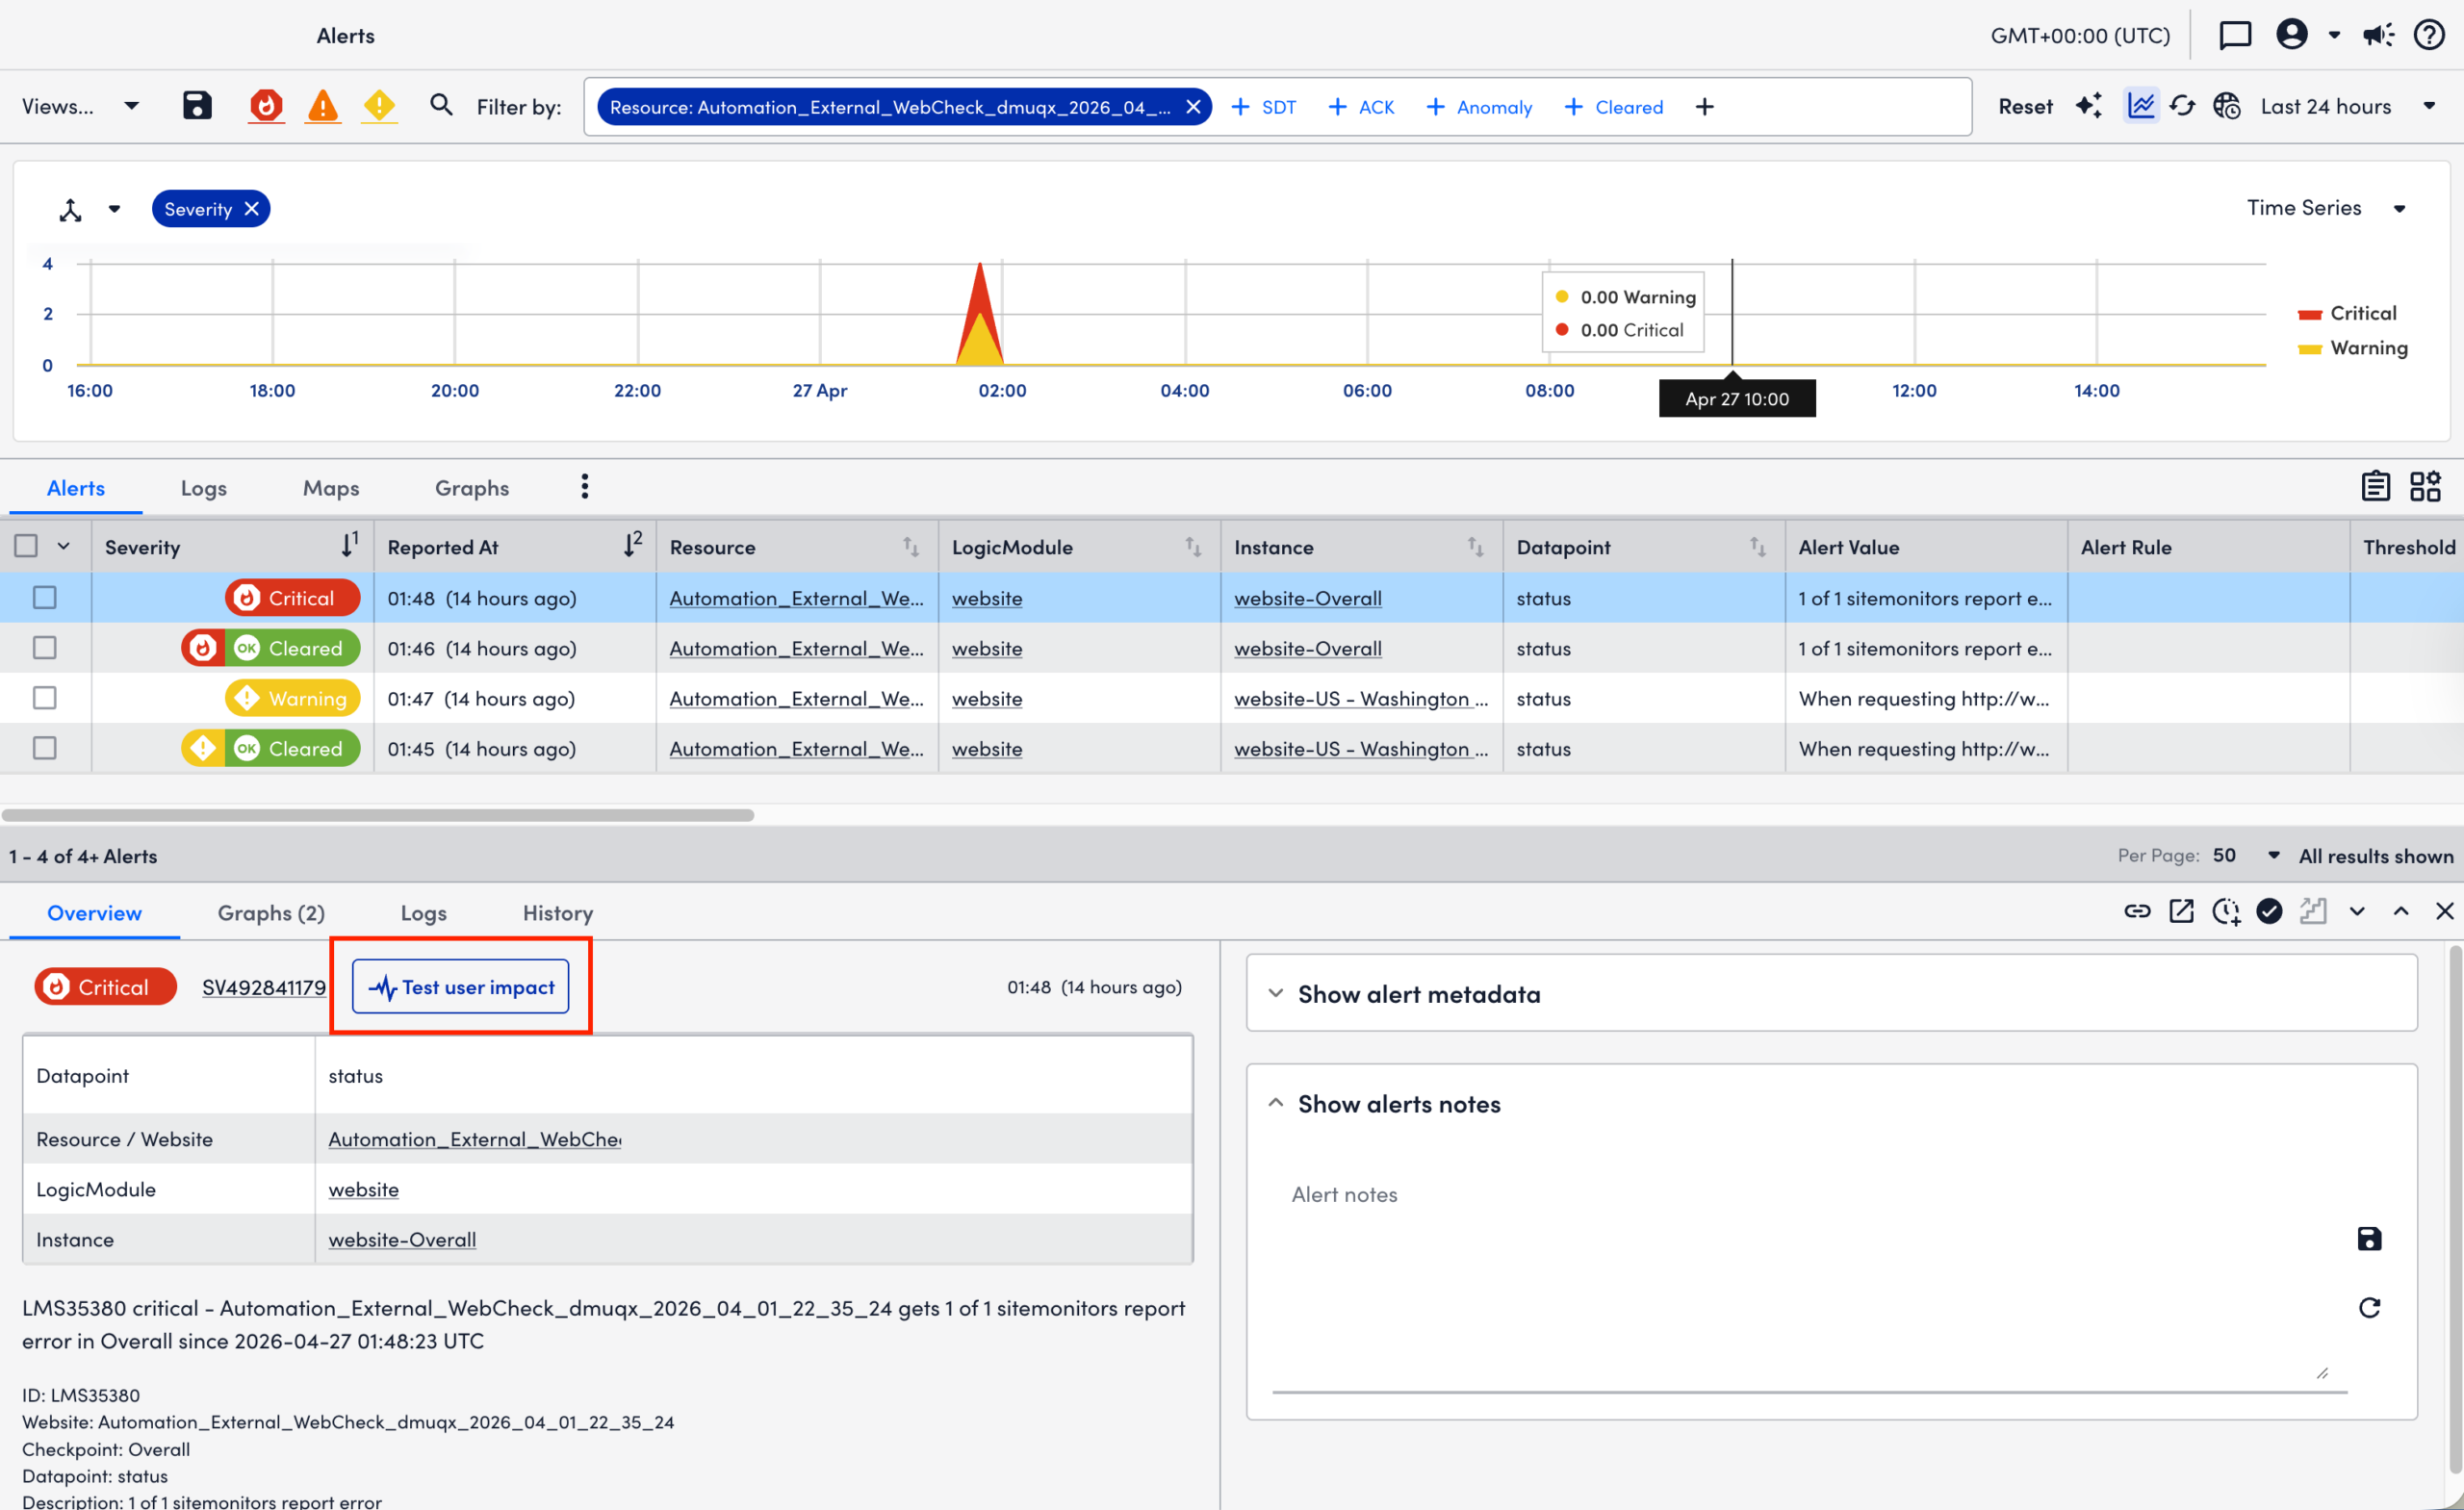
- Select Test user impact.
You are redirected to the Digital Experience page, where your test runs and then displays detailed information such as page performance, real usage metrics, individual runs, and so on.
Note: The results of the user impact test may take a few minutes to display on the Digital Experience page.
Related Information for Digital Experience in LogicMonitor
For more information on Resource Explorer, see Resource Explorer Overview.
For more information on Resource Tree, see Navigating the Resources Page.
For more information on Alerts, see Managing Alerts from the Alerts Page.
