
Edwin AI Problem Management
Last updated - 02 July, 2026
Edwin AI’s Problem Management provides a consolidated view of recurring operation problems detected across insights over time. This page flags problems to help you identify patterns where similar issues repeatedly occur, understand their frequency and impact, and asses how long those problems have persisted.
Edwin AI analyzes historical data to identify insights that are considered similar and have occurred multiple times within a defined time window.
The following are characteristics of a problem:
- Problems are created based on the event names contained within an Insight
- Related events are grouped using similar logic as Similar Insights
- The process is fully automated with minimal configuration
Edwin AI performs recurrence analysis using a 90-day window, meaning insight analysis evaluates results from the past 90 days. If there is a high overlap of event names across insights, they are then grouped into a recurring problem.
Note: Problem management cannot expand beyond a 90-day window as this time.
Requirements for Viewing Problem Management
To use the problem management page, you must have an Edwin AI account with the Recurrence Processing action rule enabled. For more information, see Edwin AI Rules.
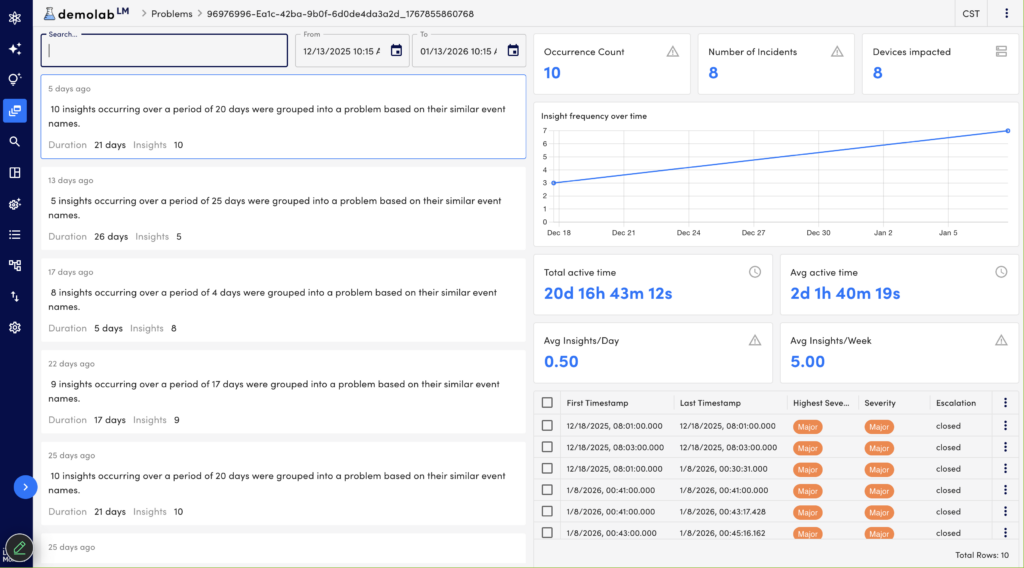
Visual Components on the Problem Management Page
The Problem Management page displays a list of detected recurring problems along with summary metrics. You can search and view problem data, but cannot take actions.
The Problem Management page contains the following visual components:
- Search bar—Filters problems using fields available at the insight level (for example, name or description) and from the date range selected.

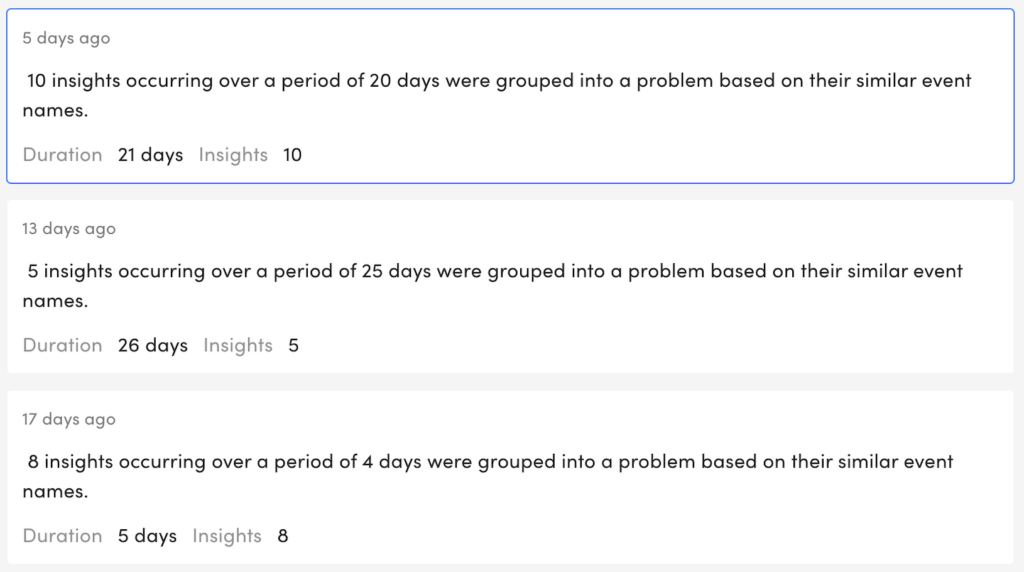
- Problem List—Displays all detected recurring problems. Gives information on number of insights identified as part of the problem and length of time this has been an issue.
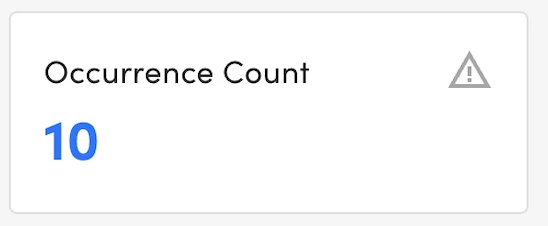
- Occurrence Count—Displays how many times the problem occurred within the time window.
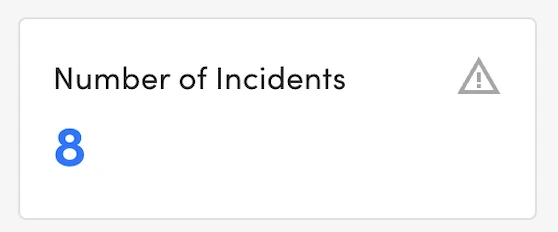
- Number of Incidents—Displays the count of associated incidents.
- Devices impacted— Displays the total number of impacted configuration items (CIs), or devices.
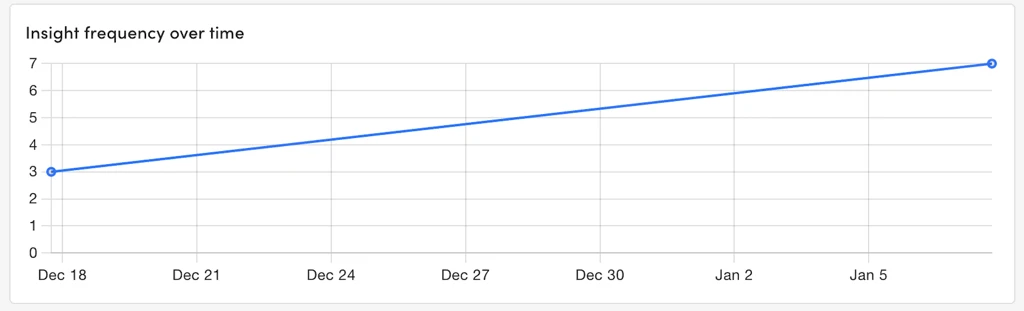
- Insights Frequency Over Time—A line graph that shows how often insights associated with a recurring problem occur over time within the selected window.
- Total active time—Displays the total time span between the first and most recent occurrence.
- Avg active time—Indicates how long Insight is open on average per week.

- Avg Insights/Day—Displays how often the problem occurs on average per day.
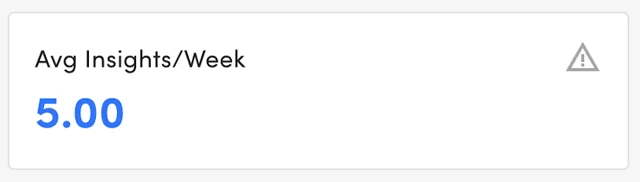
- Avg Insights/Week—Displays how often the problem occurs on average per week.
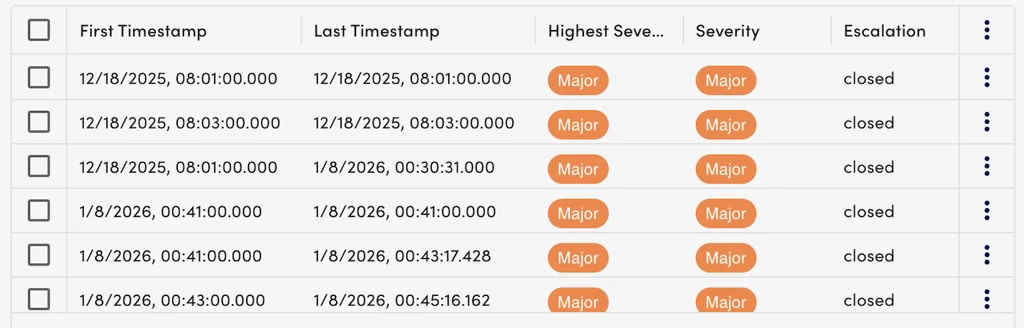
- Insights table—Displays all detected recurring insights and gives detailed information on first time the problem occurred, the most recent time, the hight severity of alert, escalation, and field name.
Viewing Problem Management in Edwin AI
- In LogicMonitor, navigate to Edwin AI > select Problems for the sidebar navigation panel.
- To view problems for a specific time period, use the search bar and date range dropdown menu.
- To learn more about a problem, use the visual components provided.
