
LogicMonitor vs. Dynatrace
LogicMonitor delivers AI-first enterprise observability purpose-built to reduce cost volatility, minimize operational overhead, and eliminate blind spots across hybrid, multi-cloud, and internet-dependent environments. Built for global scale and fast time-to-value, LogicMonitor provides a single, trusted view of service and application health across the whole organization. Combining data from real user experience, synthetic testing, and global internet performance with the infrastructure, network, and application telemetry inside the firewall it so teams can pinpoint issues quickly, cut alert noise, and resolve incidents before customers are impacted.

Why leading IT teams choose LogicMonitor

LogicMonitor

LogicMonitor

Dynatrace
See why teams choose LogicMonitor over Dynatrace




Trusted by IT Teams Everywhere
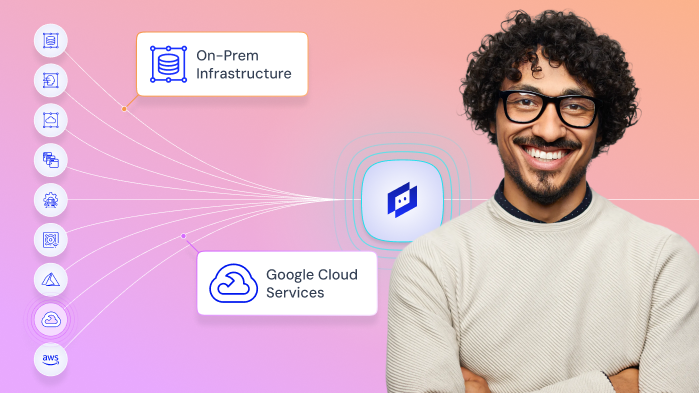
LogicMonitor empowers operations, SRE, and platform teams to move beyond isolated application insights toward full hybrid visibility, reducing alert fatigue, accelerating root cause analysis, and scaling confidently across infrastructure, cloud, network, and Internet dependencies with a complete view of service health and digital experience.

Don’t just take our word for it
Hear from our customers
LogicMonitor customers reduce alert noise, accelerate incident resolution, and simplify observability while gaining visibility into internet and external dependencies that modular monitoring approaches often miss.
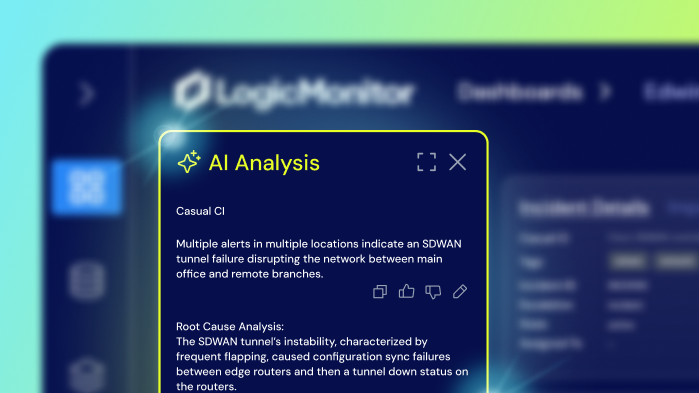
“Edwin AI cut noise by 90% & ITSM incidents by 76%, enabling better customer service.”

“LogicMonitor is a valuable partner, constantly innovating and adapting to our business needs.”

“Edwin AI delivered value within and hour of implementation”

FAQs
Our team can help you compare options, walk through a live demo, or guide your transition to LogicMonitor.
How difficult is it to transition from Dynatrace to LogicMonitor?
Most teams find the transition straightforward. LogicMonitor’s collector based architecture, automated discovery, and API driven onboarding simplify migration, while our onboarding team ensures operational continuity as you consolidate tools and workflows. Teams can also leverage the pre built Dynatrace integration to stream existing Dynatrace data directly into Edwin AI for correlation, deduplication, and noise reduction on day one, delivering immediate incident intelligence while you expand full stack visibility across your infrastructure using LogicMonitor’s collector based approach.
Does LogicMonitor offer a free trial?
Yes. LogicMonitor offers a 15-day free trial.
What differentiates LogicMonitor from Dynatrace?
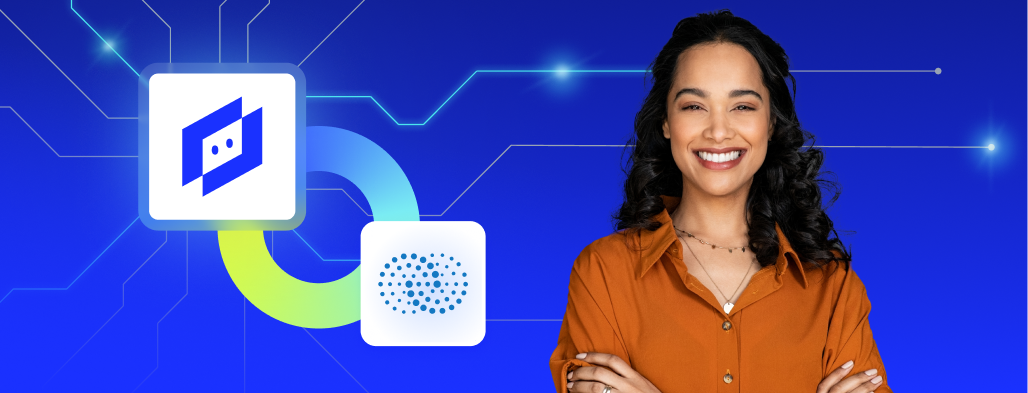
LogicMonitor delivers broader hybrid observability across infrastructure, network, cloud, logs, and digital experience in a single SaaS platform, enhanced by native Internet performance visibility through Catchpoint. While Dynatrace is known for deep application instrumentation, LogicMonitor provides more comprehensive coverage across hybrid infrastructure and external dependencies, enabling teams to see both internal systems and the Internet services that impact real user experience.
Can LogicMonitor scale as environments grow?
Yes. LogicMonitor is built for enterprise scale across hybrid, cloud, and distributed environments, while maintaining SaaS simplicity and scalable architecture across distributed environments.
How does LogicMonitor reduce alert noise?
LogicMonitor uses topology-aware correlation, dynamic thresholds, and AI-driven insights to suppress redundant alerts. Customers commonly report 95–97% reductions in alert noise when consolidating fragmented monitoring environments, supported by topology-aware alerting and Edwin AI insights.
Simple, transparent pricing that scales with your environment
Try any plan free for 15 days.

All third-party trademarks are the property of their respective owners and used for identification purposes only.
