
LogPilot
Last updated - 13 January, 2026
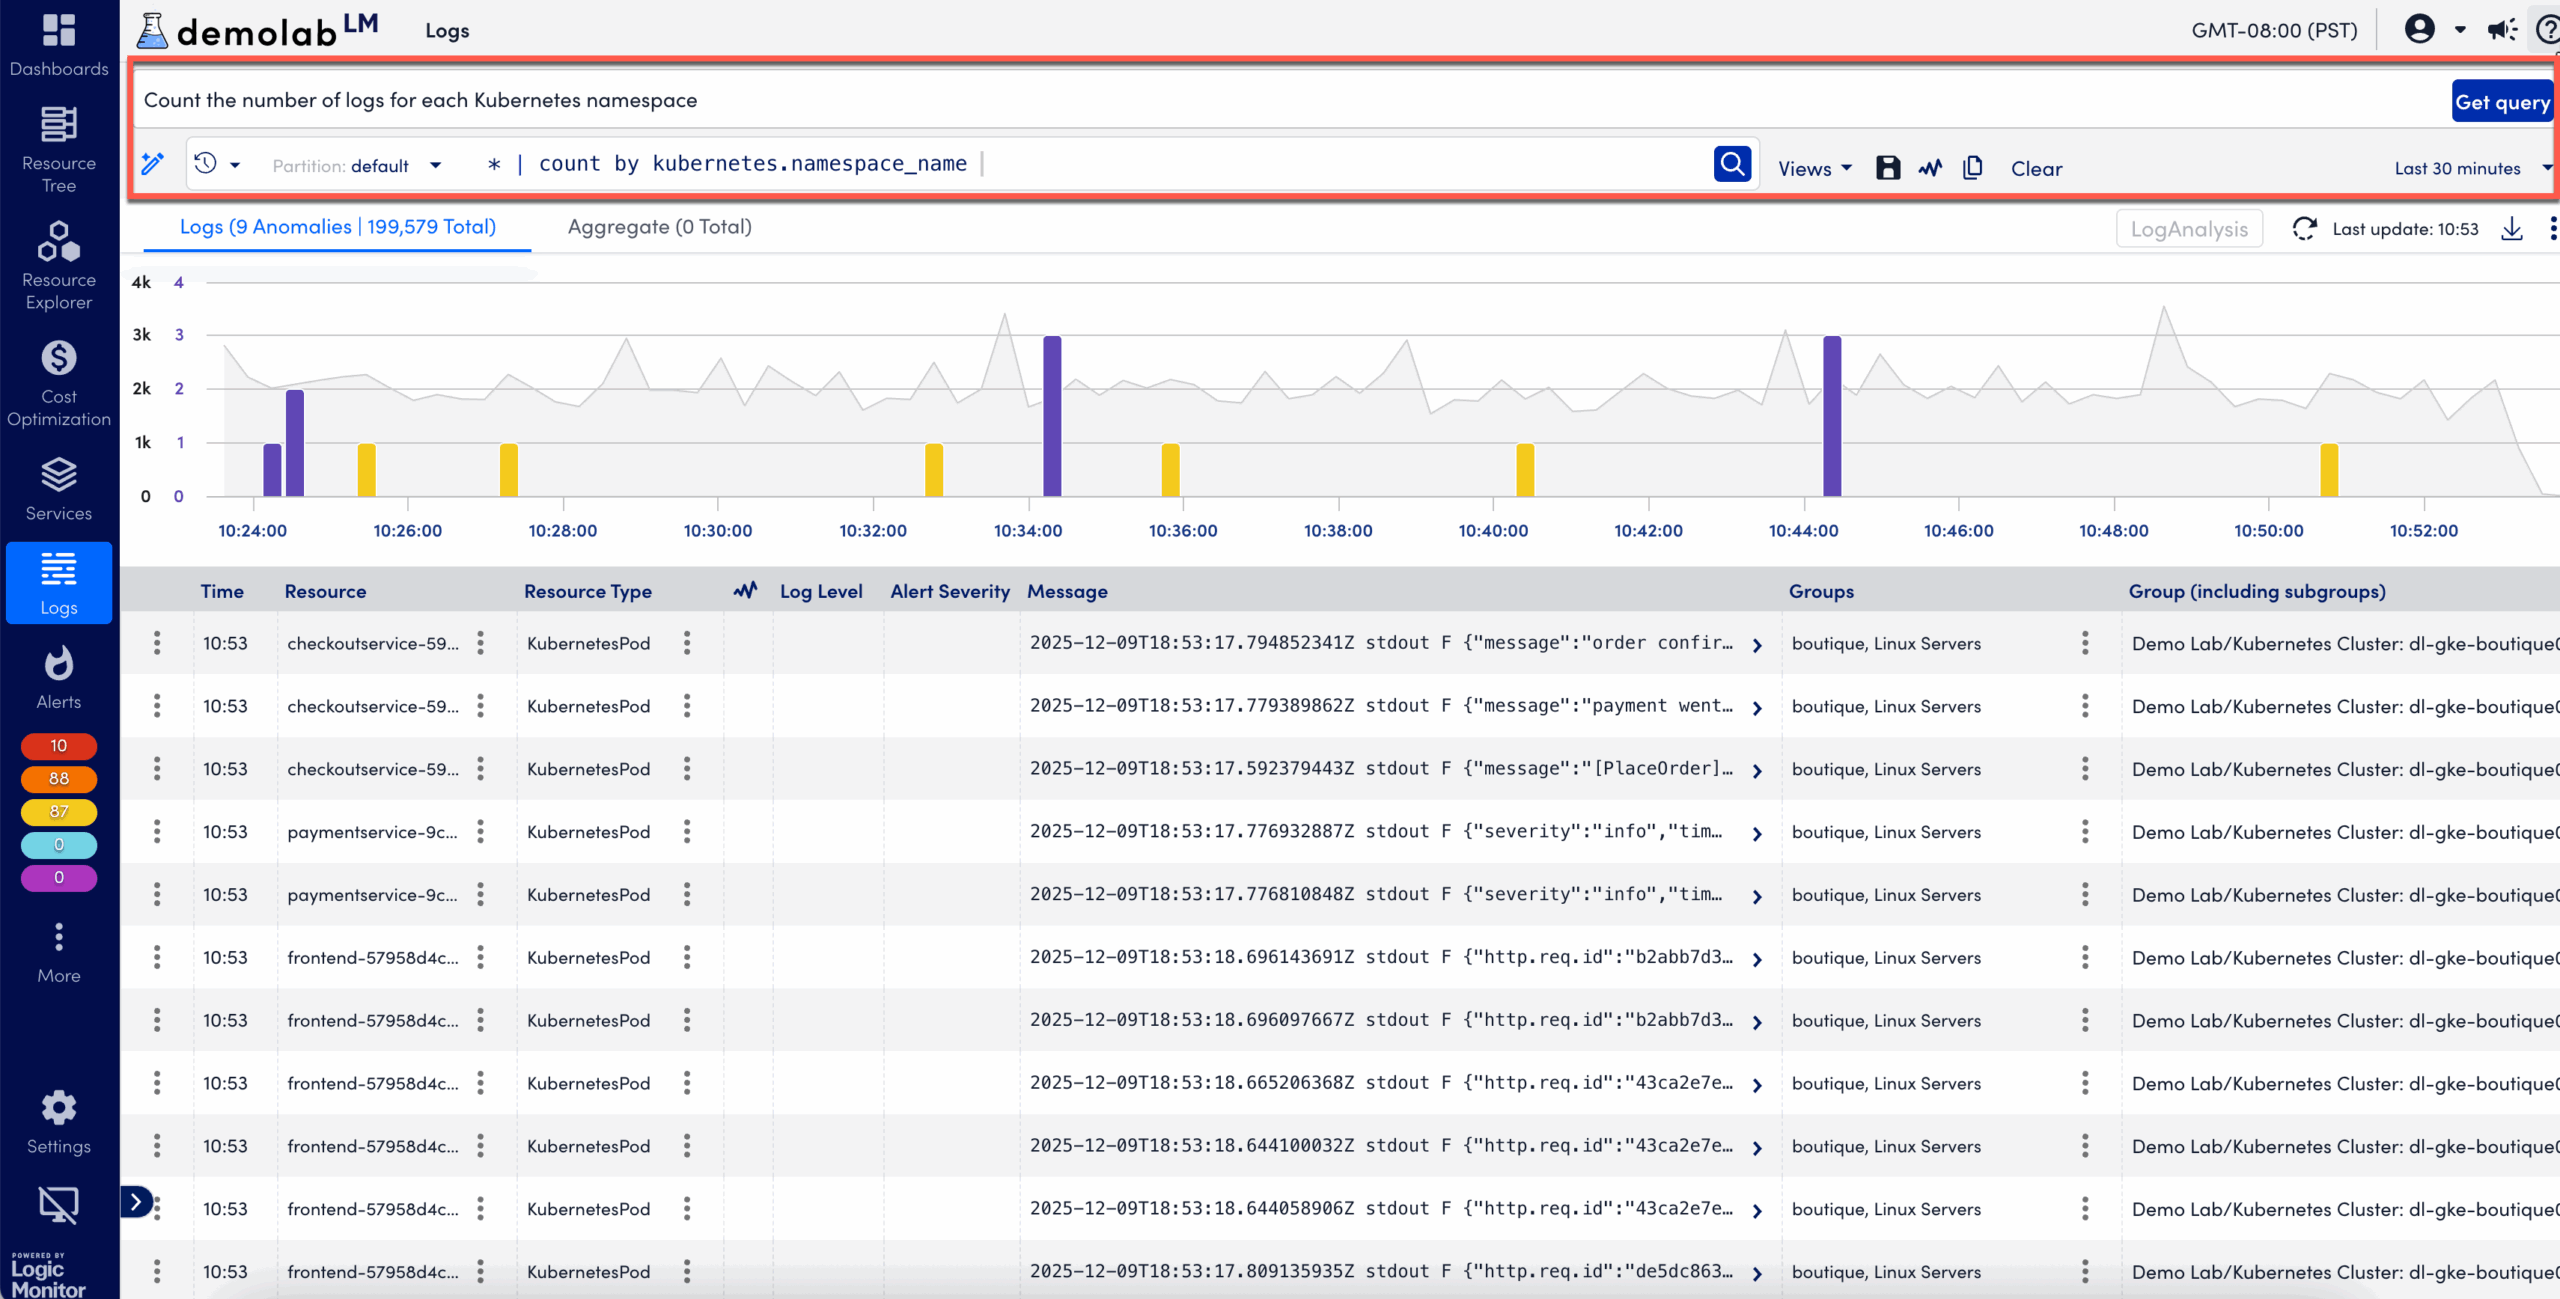
LogPilot is a generative AI–powered feature in LM Logs that enables log search using natural language queries. It removes the need to write LogicMonitor Observatory Query Language (LMOQL) or regular expressions. You can use LogPilot to explore log data quickly, especially during time-sensitive scenarios like incident response or root cause analysis.
With LogPilot, you can do the following:
- Use plain language prompts to search logs
- Automatically generate and run log queries
- Analyze logs without field-level or regex expertise
This helps accelerate triage, lower the barrier to log analytics for non-experts, and reduce time-to-insight.
Important: LogPilot uses strict data isolation. Your logs remain within your tenant and are not shared with other customers or combined into a cross-tenant dataset. Prompts you enter, along with any associated log data, are not used to train models across portals, and other users do not gain insight into your data.
Guidelines for LogPilot Prompts
LogPilot works best with clear, specific natural language prompts. Use the following guidelines to generate accurate queries and more relevant results:
| Guideline | Description | Example Input Text | Generated Query |
| Automatic field mapping | LogPilot recognizes commonly used LM Logs fields and maps natural language phrases to their corresponding log field names. | Show logs for resource group Resourcegroupname01 | _resource.group.name = "Resourcegroupname01" |
| User-Provided Values | LogPilot automatically recognizes field names, but you must still provide the corresponding field values. It does not infer or generate values for you. | Show logs for device name app-web-01 | resource.name = “app-web-01” |
| Log samples for parsing and aggregation | You can paste a sample log line and instruct LogPilot to extract fields or apply aggregation using pattern matching. | From the following log message, extract UserID and count the number of logs by UserID. Log message – Task initiated by UserID user1 at 10:00:20 IST. | oql_message ~ "Task initiated by UserID"| parse /Task initiated by UserID (.+?) at/ as UserID| count by UserID |
Time-Based Filtering with LogPilot
Time ranges cannot be expressed in natural language input. LogPilot cannot interpret phrases such as “last 10 minutes” or “past hour.” You must use the Time Picker to define the time range before or after submitting the query.
The following type of inputs are not interpreted as time filters and are not supported by LogPilot:
Get logs from the last 10 minutesGet logs for log-process in the last 10 minutes
Example Queries
| Natural Language Inputs | Generated Log Query |
| Find anomalies for resource name billing-server | _resource.name = “billing-server” and _anomaly.type = “never_before_seen” |
| Count the number of logs for each Kubernetes namespace. | * | count by kubernetes.namespace_name |
| Sum and average the log sizes for each resource in group ID 987 | _resource.group.id = 987 | sum(_size), avg(_size) by _resource.name |
| Extract response times and URLs from webserver logs, compute the average and max response time for each URL, and sort by the highest max response time. | _resource.name = “webserver” AND _message ~ “response time” | parse /Response time: (\d+)ms for URL: (.+)/ as response_time, url | avg(response_time), max(response_time) as max_time by url | sort by max_time desc |
| Find bad anomalies and count them by resource id | _anomaly.type=”never_before_seen” and (_message ~ “error” or _message ~ “fail” or _message ~ “fatal” or _message ~ “terminate” or _message ~ “kill” or _message ~ “exception” or _message ~ “timeout”) | count by _resource.id |
| Find logs of the resource having container name “log-write” from namespace “p01-us-east-1-demo”. The message should contain “flushing chunks” and “b69278”. The results are then grouped into 1-hour time buckets, counting the number of log entries in each bucket. Finally, the results are sorted in descending order based on time, showing the most recent bucket first. | kubernetes.namespace_name = “p01-us-east-1-demo” and kubernetes.container_name = “log-write” and “flushing” and “b69278” | bucket(span=1h) | count by _bucket | sort by _bucket desc |
| Find logs for container log-process | kubernetes.container_name = “log-process” |
| Find all error logs and count them by resource id | _message ~ “error” | count by _resource.id |
| From logs extract processingTime and find max processingTime | _message ~ /sql db took (\d+)ms for query ‘(.+?)’/ | parse /sql db took (\d+)ms for query ‘(.+?)’/ as response_time, query | num(response_time) as numeric_response_time | avg(numeric_response_time) by query |
| From the following log extract db response time and query, count average resposne time per query. log message – INFO: sql db took 20ms for query ‘select count(*) from admins’ | * | parse /processingTime=(\d+)/ as processingTime | num(processingTime) as numeric_processingTime | max(numeric_processingTime) |
| logs usage by size of each resource id for each hour. | * | bucket(span=1h) | sum(_size) by _resource.id |
| parse ip address from the logs and count by ipaddress. | * | parse /(\d+\.\d+\.\d+\.\d+)/ as ip_address | count by ip_address |
