
JMX Active Discovery
Last updated – 23 April, 2026
JMX Active Discovery is a LogicMonitor feature that automatically detects and monitors Java Management Extensions (JMX) objects on a device.
It can identify the following:
- All instances of a specified MBean.
- Instances filtered by specific attributes of a fully defined MBean.
- Multiple Java instances running on different ports. For each instance, it enumerates the available MBean objects.
This results in a structured array of discovered JMX objects across one or more Java Virtual Machines (JVMs), enabling streamlined monitoring in complex Java environments.
Note: LogicMonitor uses the device properties jmx.user and jmx.pass for authentication. These properties store the username and password needed to access the JMX interface of the monitored Java application.
Requirements for Configuring JMX Active Discovery
To configure JMX Active Discovery, toggle the Enable Active Discovery switch.
This enables LogicMonitor to automatically find the DataSource’s instances and the resources they apply to. For more information, see Active Discovery.
Parameters for JMX Active Discovery
You need to define key parameters that determine how LogicMonitor identifies and connects to JMX objects.
| Parameter Name | Description |
| JMX Path | Specifies the location of the MBean or MBean attribute to be discovered. The path must include the JMX domain and object name. Example: Catalina:type=Manager,host=localhost,path=* |
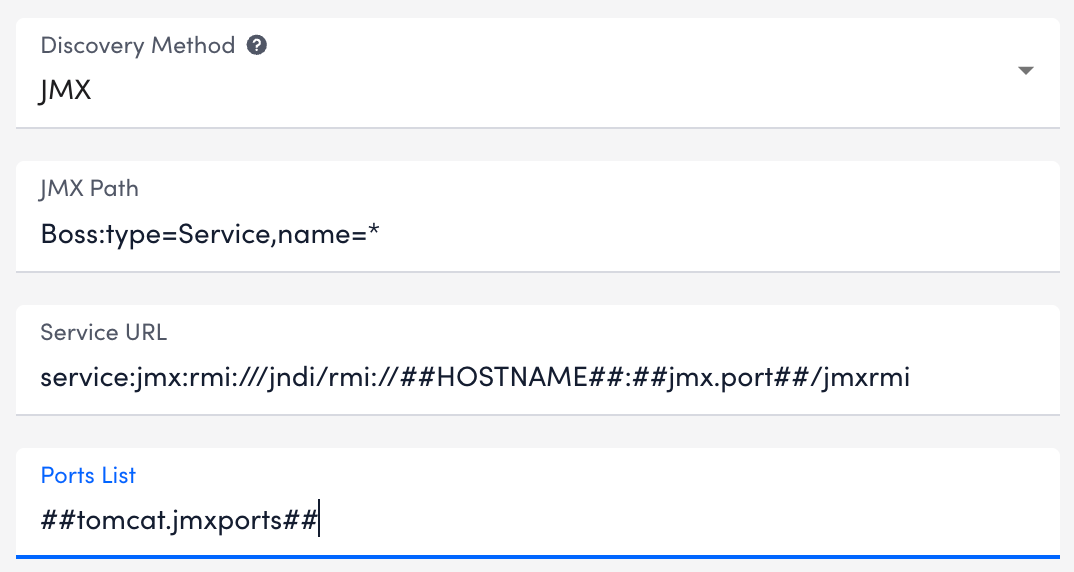
| Service URL | (Optional) Defines the JMX service URL. If not provided, LogicMonitor uses the port defined at the device level using the jmx.port property. In that case, the default value is: service:jmx:rmi:///jndi/rmi://##HOSTNAME##:##jmx.port##/jmxrmiYou can also use the ##PORT## token within the Service URL to iterate over multiple ports defined in the Ports List field. |
| Ports List | Lists the ports LogicMonitor should check for JMX objects. Use a comma-separated list, typically populated by the ##jmx.ports## token. This enables flexible, per-device or per-group port configuration. |
Configuring JMX Active Discovery
- In LogicMonitor, navigate to
 More > Modules > My Module Toolbox.
 - Select
 Add > DataSource.
 - In the Info tab, provide the basic information.
For more information, see DataSource Configuration. - In the Summary section, provide the following information:
- Collection Method—Select “JMX” from the dropdown menu. This defines how data is collected for the DataSource.
- Collection Schedule—Select an interval based on how frequently the monitored data updates. Use shorter intervals (for example, 1 minute) for rapidly changing or critical metrics. Longer intervals reduce system load on both the monitored resource and the Collector.
- Multi-Instance—Toggle the Multi-Instance switch to enable monitoring of multiple instances of an object. For example, multiple disks or volumes on a server.
- ERI Discovery—An optional script that runs once for each instance to assign external resource identifiers (ERIs).
- Enable Active Discovery—Toggle the Enable Active Discovery switch to enable LogicMonitor to automatically detect instances.
Note: This option is available only when Multi-Instance switch is enabled.
- Select Access Groups to assign access to the DataSource.
For more information, see Access Groups for Modules. - In the AppliesTo field, enter AppliesTo scripting to determine which resources are associated with this DataSource. For more information, see AppliesTo Scripting Overview.
- In the Active Discovery section, provide the following information:
- Discovery Schedule—Select an option from the discovery schedule dropdown menu. Configure Active Discovery to run on a set schedule (for example, every 15 minutes, every hour, or once a day), or to run only when the host or DataSource is first applied to a resource or updated.
- Group Method—Select how instances are grouped after discovery using the Group Method dropdown menu.
- Manual—Manually organize instances into groups after discovery, or leave them permanently ungrouped.
- Regular Expression—Group instances based on pattern matching using regular expressions.
- Instance level property—Automatically create instance groups based on unique values of the selected instance-level property (ILP).
For information, see Instance Groups.
- (Optional) Disable Discovered Instances—Toggle the Disable Discovered Instances switch to place newly discovered instances in a disabled state by default. These instances move to the dynamic Unmonitored group and are not monitored until you enable them. This option is useful when you want to fine-tune datapoint thresholds before enabling monitoring to avoid unnecessary alerts.For more information, see Instance Groups.
- Automatically Delete Instances—Toggle the Automatically Delete Instances switch to remove instances from monitoring when Active Discovery no longer detects them. You can delete the instance immediately or retain its history for 30 days.
Recommendation: Keep this option disabled if you want to continue receiving alerts for missing instances. - Select “JMX” from the Discovery Method dropdown.
- In the JMX Path field, enter the path to the MBean object or attribute you want to discover.
The structure and type of the attribute specified in the JMX Path determines how instances are discovered:- Primitive type (string or integer) — The attribute’s value is returned as both the alias and the instance value.
- Array — The array index is used as the alias, and each element is returned as a separate instance.
- Map — The keys are used as aliases, and the values are returned as instance values.
For example: To return theserverInfovalue from theCatalina:type=ServerMBean, use the following format:Catalina:type=Server:serverInfo
This would return an instance value such as:Apache Tomcat/5.5.25
You can use this value in filtering.
- (Optional)In the Service URL field, enter the URL of the JMX server.
- In the Ports List field, enter a comma-separated list of ports to scan for JMX objects.
Note:- Use
##WILDVALUE##to represent the discovered MBean object. - Use ##WILDVALUE2## to represent the discovered attribute value if port discovery is also in use.
- Use
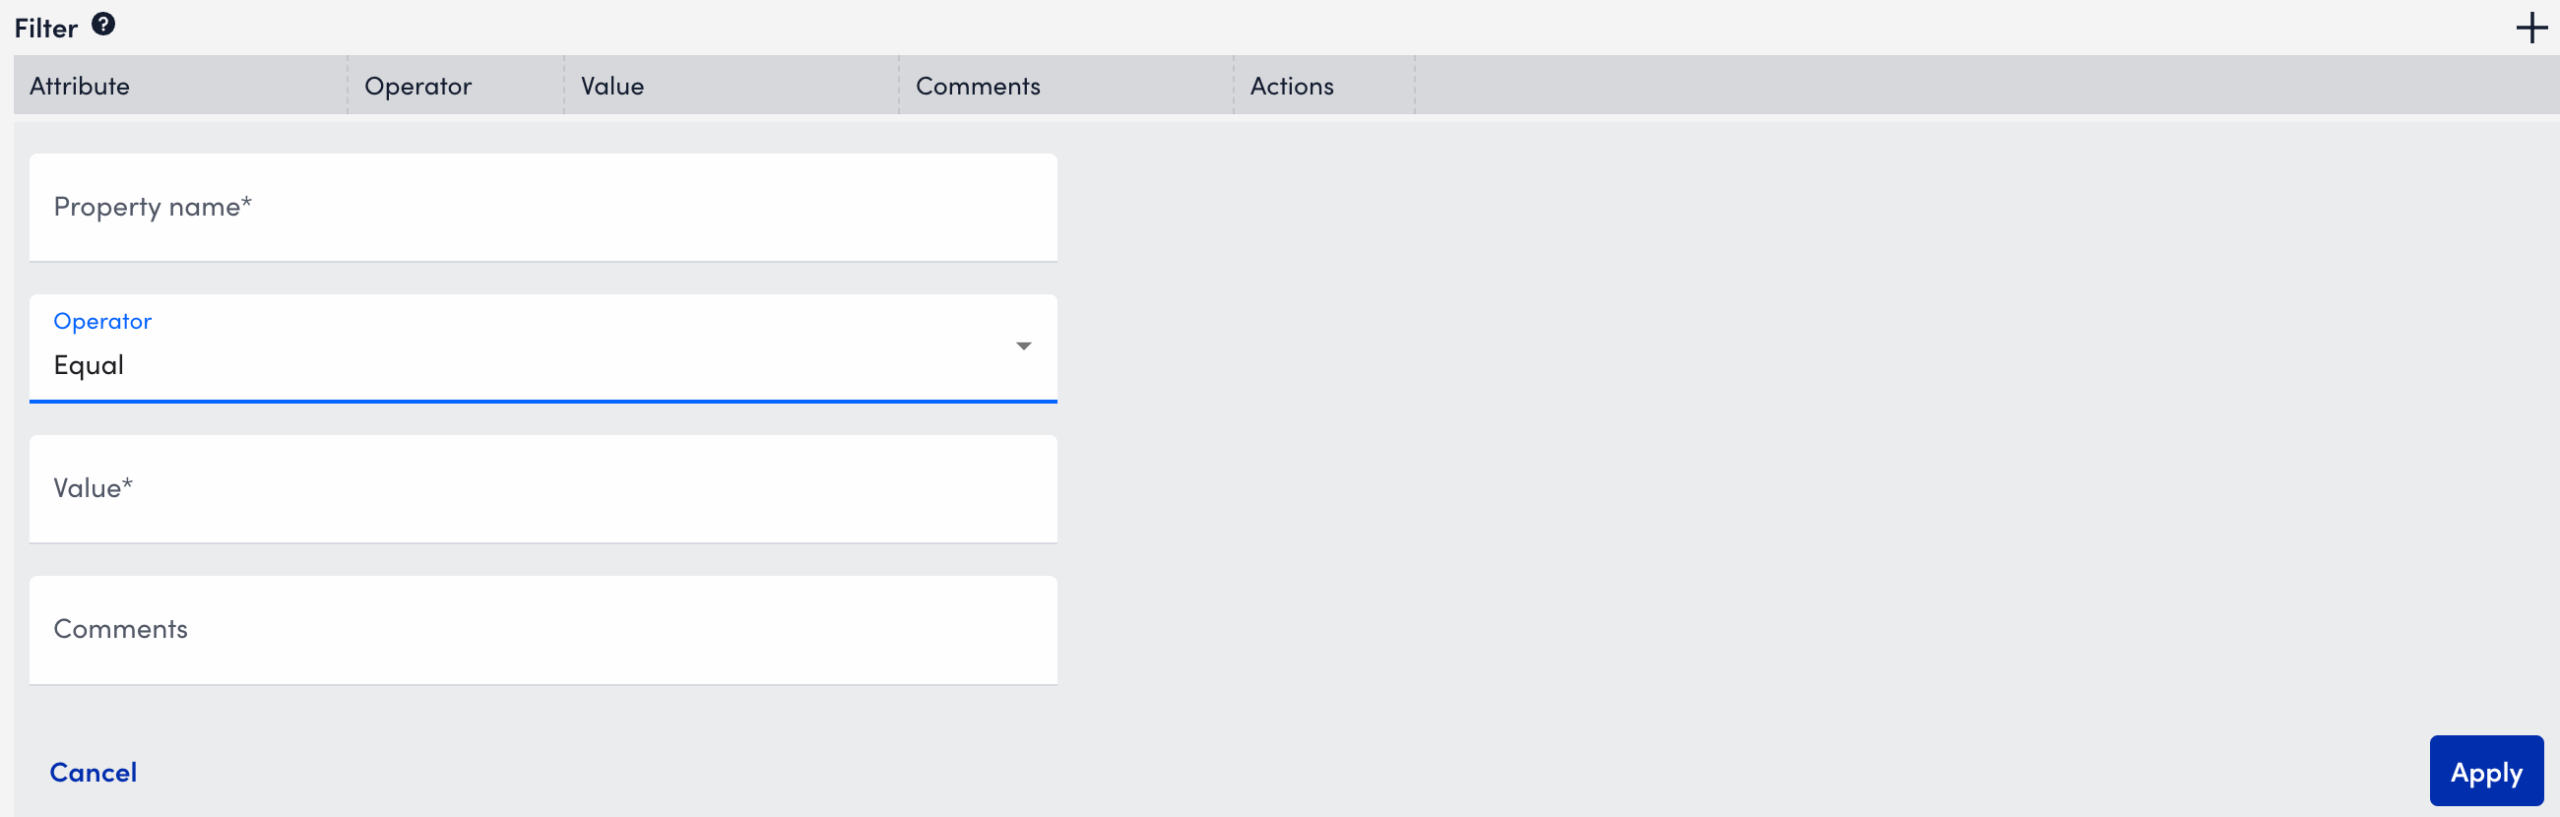
- You can filter discovered instances based on ports, MBean paths, or attribute values. To add a filter do the following:
- Select Add Filter.
- In the Property Name field, enter
##WILDVALUE##or##WILDVALUE2##if using port-based discovery. - Select an Operator from the dropdown list.
- In the Value field, enter the value to filter against.
- (Optional) Enter a Comment to describe the filter purpose.
- Select Apply to save the filter.
- Select Save.
LogicMonitor now automatically discovers JMX objects across the specified Java instances, enabling monitoring of key performance metrics without manual setup.
