
Migration from Websites to LM Uptime
Last updated - 13 October, 2025
LogicMonitor leverages LM Uptime to continuously monitor websites, servers, and networking hardware from multiple locations.
If you are using the Website Monitoring, you can migrate to LM Uptime for the following reasons:
- Dynamic Thresholds—Supported only for LM Uptime and not for Websites
- Dashboard Widgets—Only a few widgets apply to Websites (for example, Website Status widget). LM Uptime supports all widgets, and Website Status can be displayed using Custom Graphs.
- Alert Support—Alerts are applied on limited datapoints on Websites, while LM Uptime extends alerting to all datapoints
- Reporting—Websites emphasize predefined, instance-level availability and downtime reporting (for example, Website Overview Report), while LM Uptime provides highly configurable, performance-oriented reports with custom datapoints (for example, Resource Metric Trends Report, Uptime Resource Overview Report, and so on)
Considerations for Migrating from Websites to LM Uptime
To migrate from Websites to LM Uptime, you need to consider the following:
- Only the configuration is migrated to LM Uptime, data migration is not included in this process.
- The properties key is only migrated if it exists in the Web Check. Due to sensitivity, property values are not transferred automatically and must be manually entered by you after migration.
- Website groups (including properties) are not migrated as part of this process. If you are already within a group while importing, that group is applied by default.
- Exported websites have default location and alert settings set to false because website defaults differ from Uptime defaults. These must be adjusted after migration.
Requirements for Migrating from Websites to LM Uptime
To migrate from Websites to LM Uptime, you need the following:
- A user with “Manage” permission for Resource.
For more information, see Resource Role Permissions. - LM Uptime license edition
Migrating from Websites to LM Uptime
- In LogicMonitor, navigate to Websites > select the Web or Ping Check you want to migrate.
- Select
 Manage.
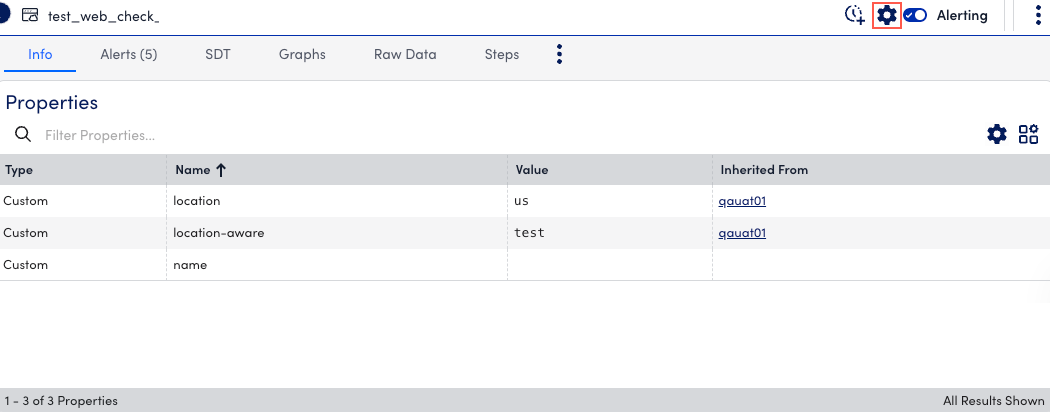
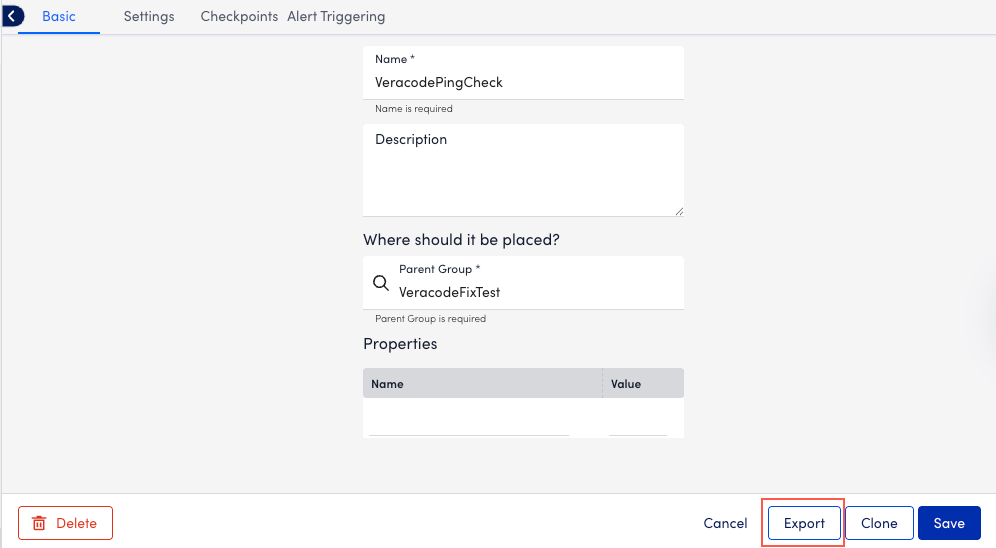
- Select Export to export the website details in JSON format.
A dialog displays confirming all fields that will be exported, excluding scripted fields in scripted Web Checks. In addition, Collector details for internal checks are not exported in the JSON. You need to manually assign the correct collector during the import process.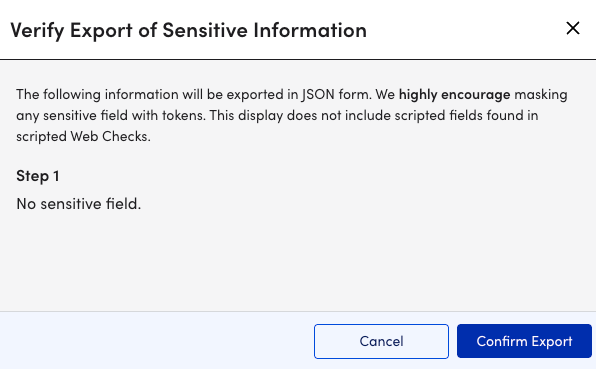
- Select Confirm Export.
The web or ping check is exported to your system in JSON format. - Navigate to Resource Tree >
 .
. - In the Uptime section, select From File.
- In the Import from File modal, select Browse.

- Select the exported JSON format file for the website you want to import.
- Select Import.
Depending on whether the imported file is for a web check or a ping check, most of the fields are automatically populated based on the configuration of the imported JSON file.
In addition, most of the fields are auto populated based on the configuration of the imported JSON file. Not all field data is imported.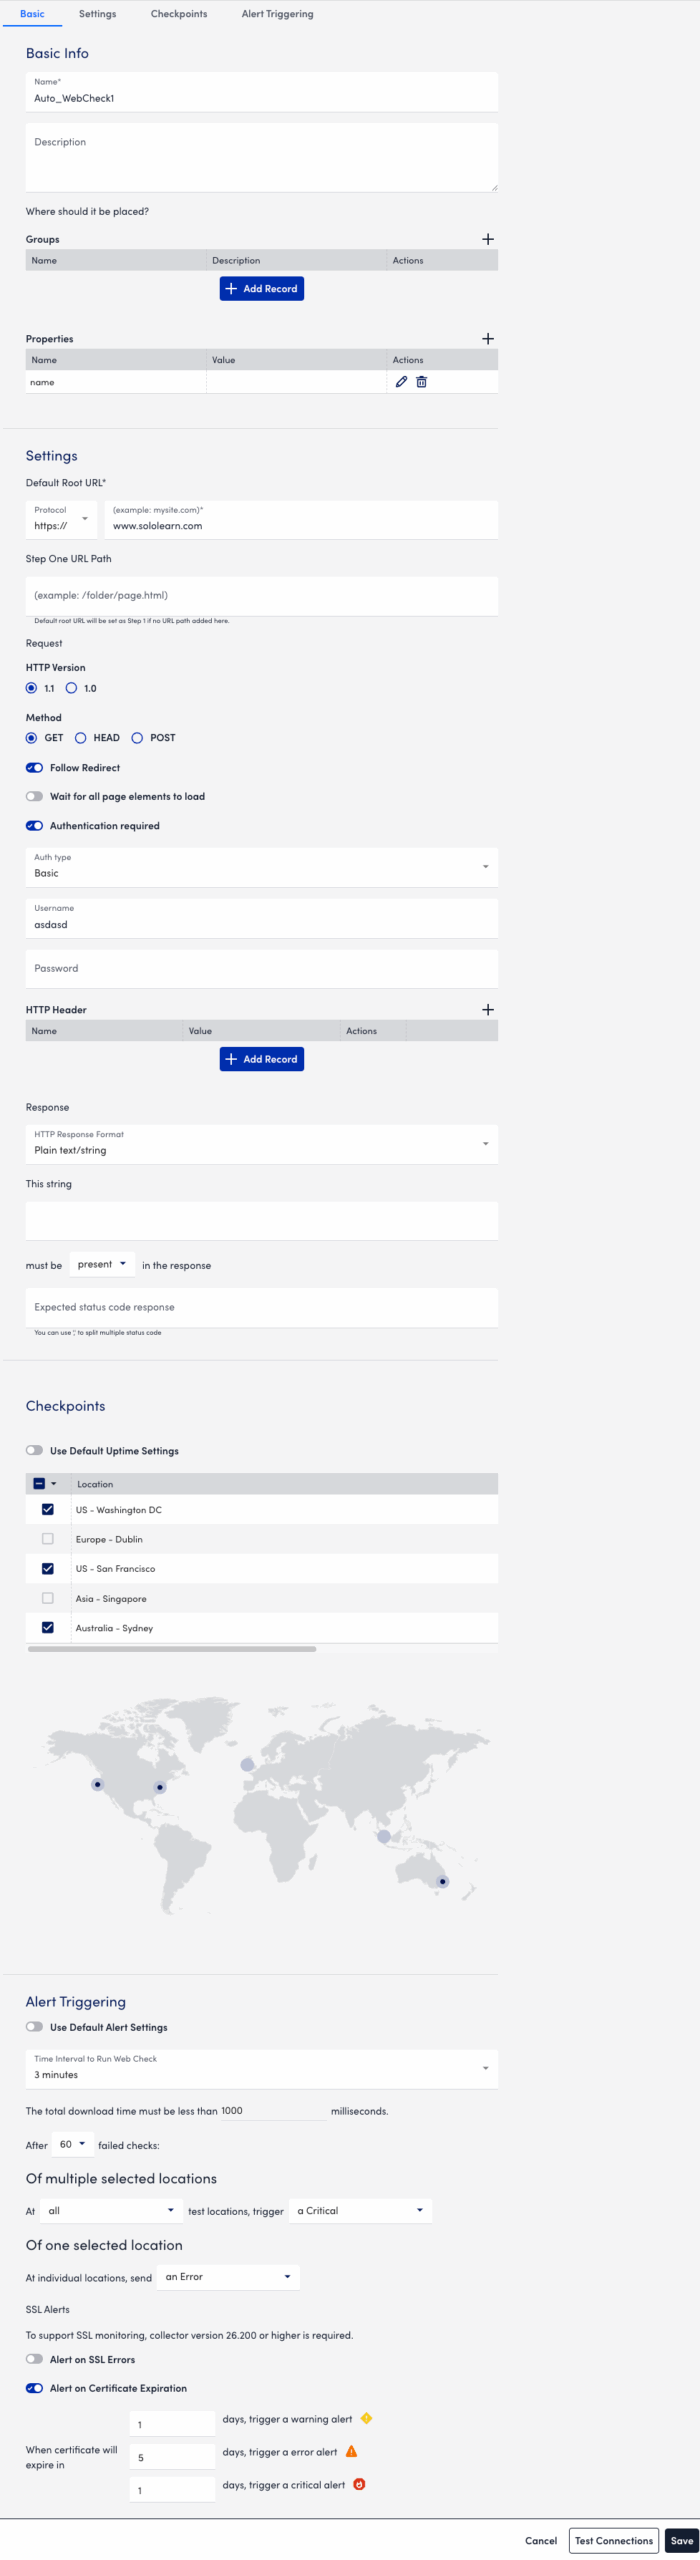
- Select Save.
The web or ping check is added to the resource tree.
For more information about using LM Uptime after you migrate you data, see LM Uptime Overview.
