Kubernetes API Server Monitoring
Last updated – 26 June, 2023
The API server is the front end of the Kubernetes Control Plane. It exposes the HTTP API interface, allowing you, other internal components of Kubernetes, and external components to establish communication. For more information, see Kubernetes API from Kubernetes documentation.
The following are the benefits of using Kubernetes API Server:
- Central Communicator— All the interactions or requests from internal Kubernetes components with the control plane go through this component.
- Central Manager— Used to manage, create, and configure Kubernetes clusters.
Use Case for Monitoring Kubernetes API Server
Consider a cluster comprising of two nodes; Node 1 and Node 2, constituting the cluster’s Control Plane. The Kubernetes API Server plays a crucial role, consistently interacting with several services within the Control Plane. Its primary function is to schedule and monitor the status of workloads and execute the appropriate measures to maintain continuous operation and prevent downtime. If a network or system issue leads to Node 1’s failure, the system autonomously migrate the workloads to Node 2, whilst the affected Node 1 is promptly removed from the cluster. Considering the Kubernetes API Server’s vital role in the cluster, ensuring the operational efficiency of the cluster heavily relies on the robust monitoring of the component.
Requirements for Monitoring Kubernetes API Server
- Ensure you have LM Container enabled.
- You have enabled the Kubernetes_API_server datasource.
Note: This is a multi-instance datasource, with each instance indicating an API server. This datasource is available for download from LM Exchange.
Setting up Kubernetes API Server Monitoring
Installation
You don’t need any separate installation on your server to use the Kubernetes API Server. For more information on LM Container installation, see Installing the LM Container Helm Chart or Installing LM Container Chart using CLI.
Configuration
The Kubernetes API Server is pre-configured for monitoring. No additional configurations are required.
Viewing Kubernetes API Server Details
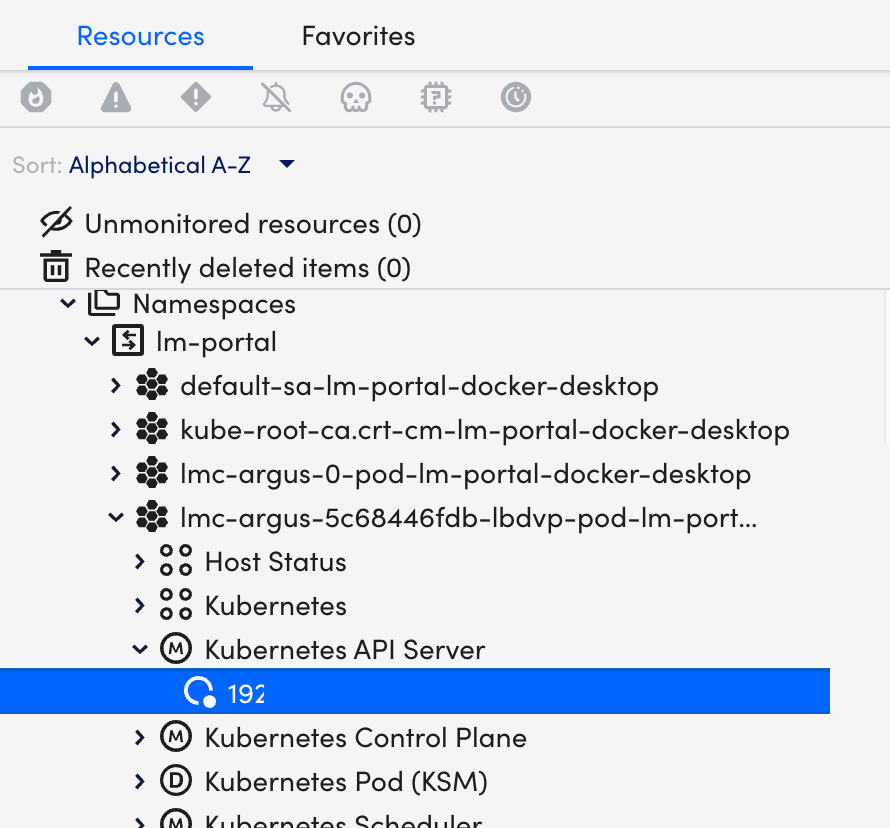
Once you have installed and configured the Kubernetes API Server on your server, you can view all the relevant data on the Resources page.
- In LogicMonitor, navigate to Resources > select the required DataSource resource.
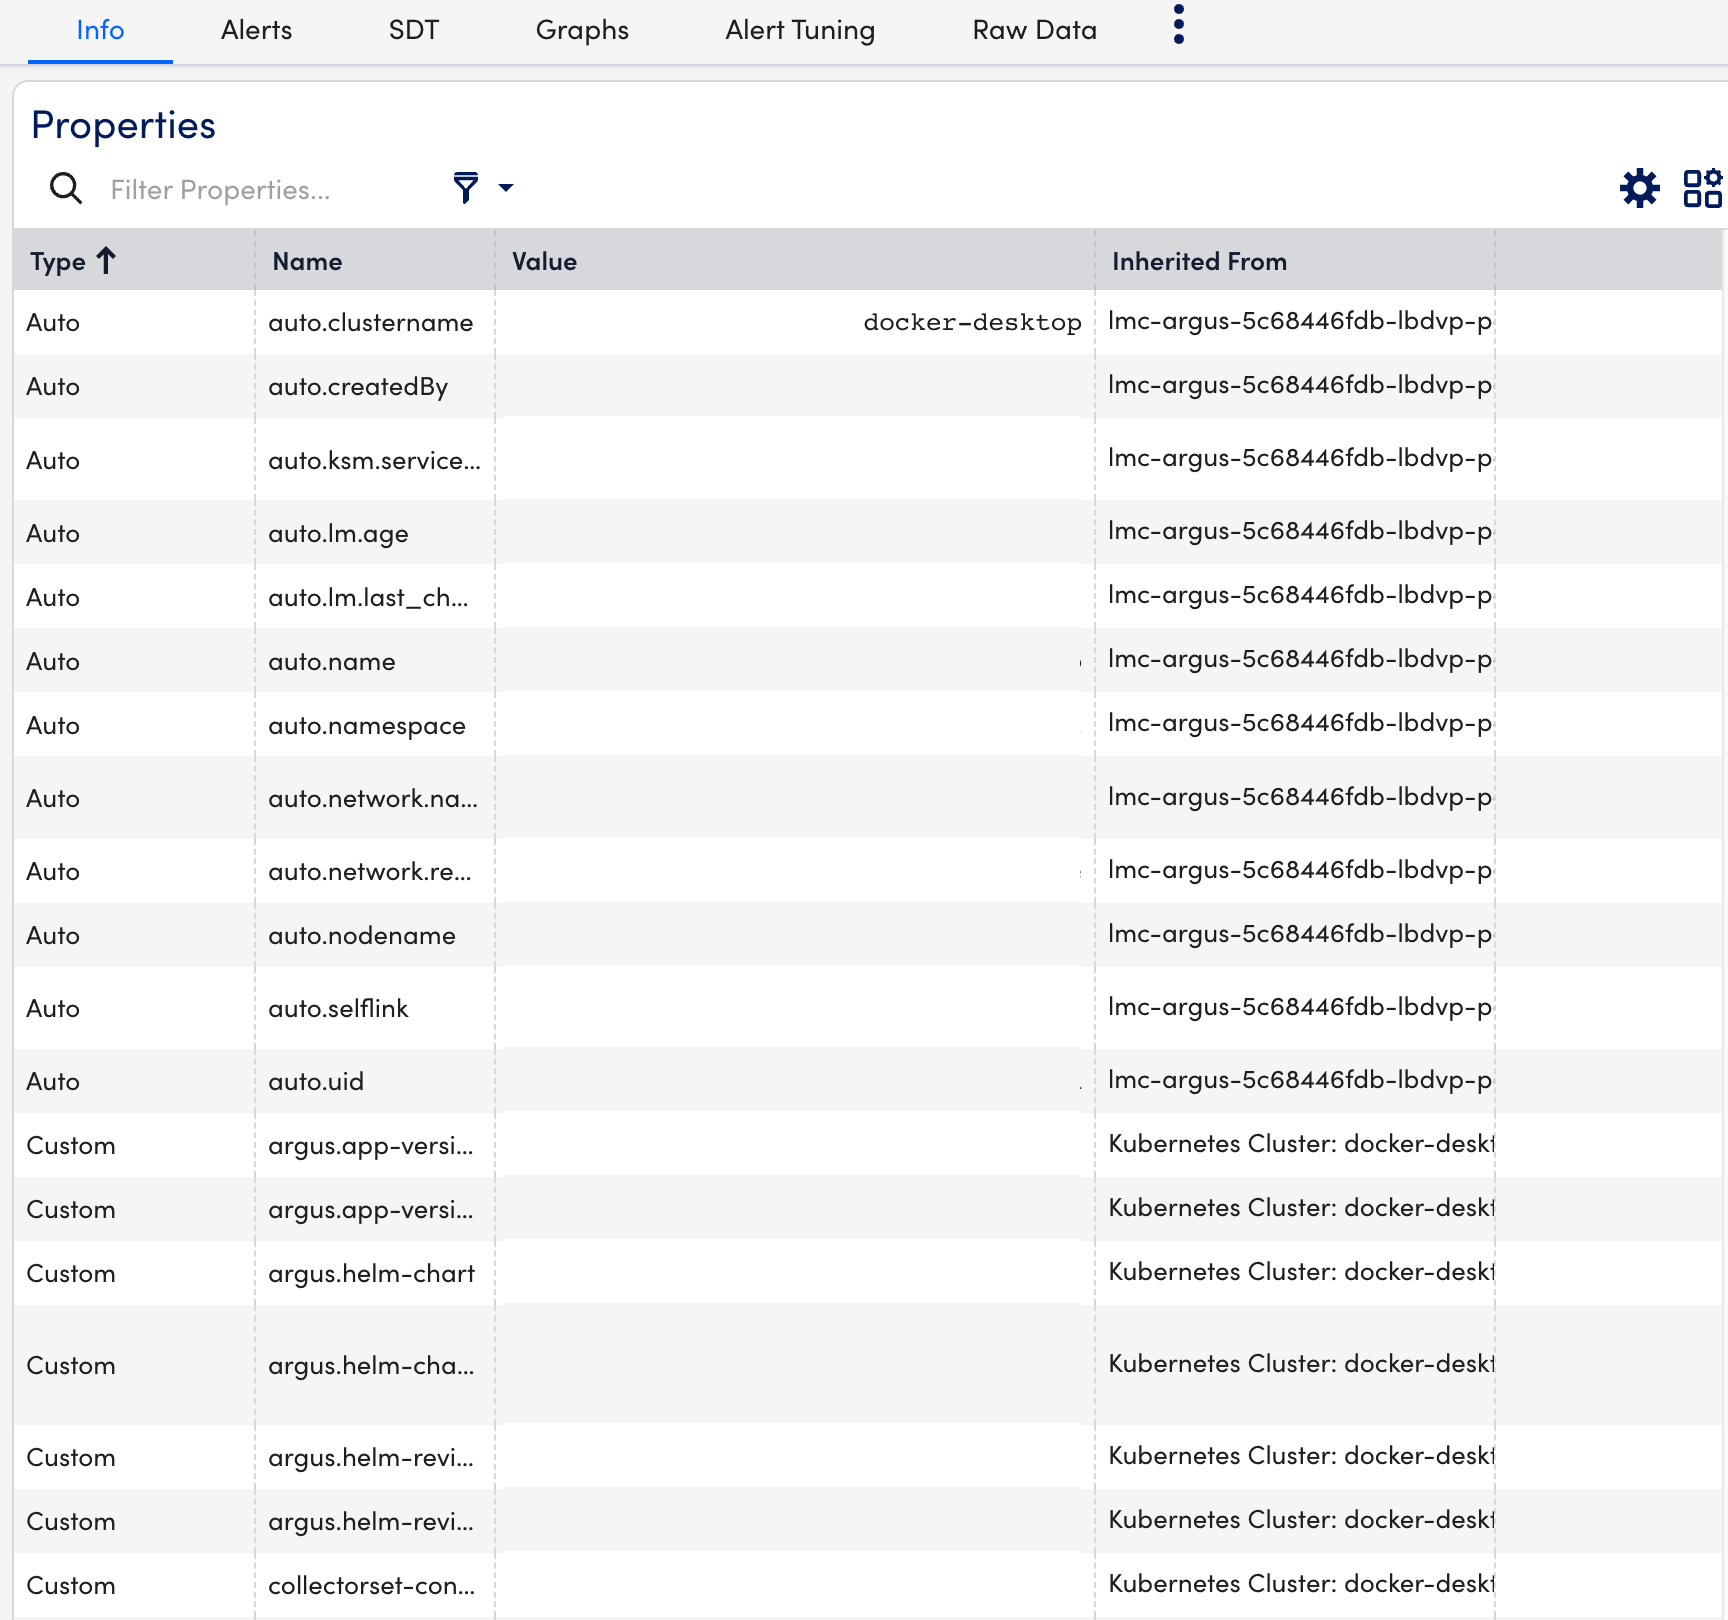
- Select Info tab to view the different properties of the Kubernetes API Server.
- Select Alerts tab to view the alerts generated while checking the status of the Kubernetes API Server resource.
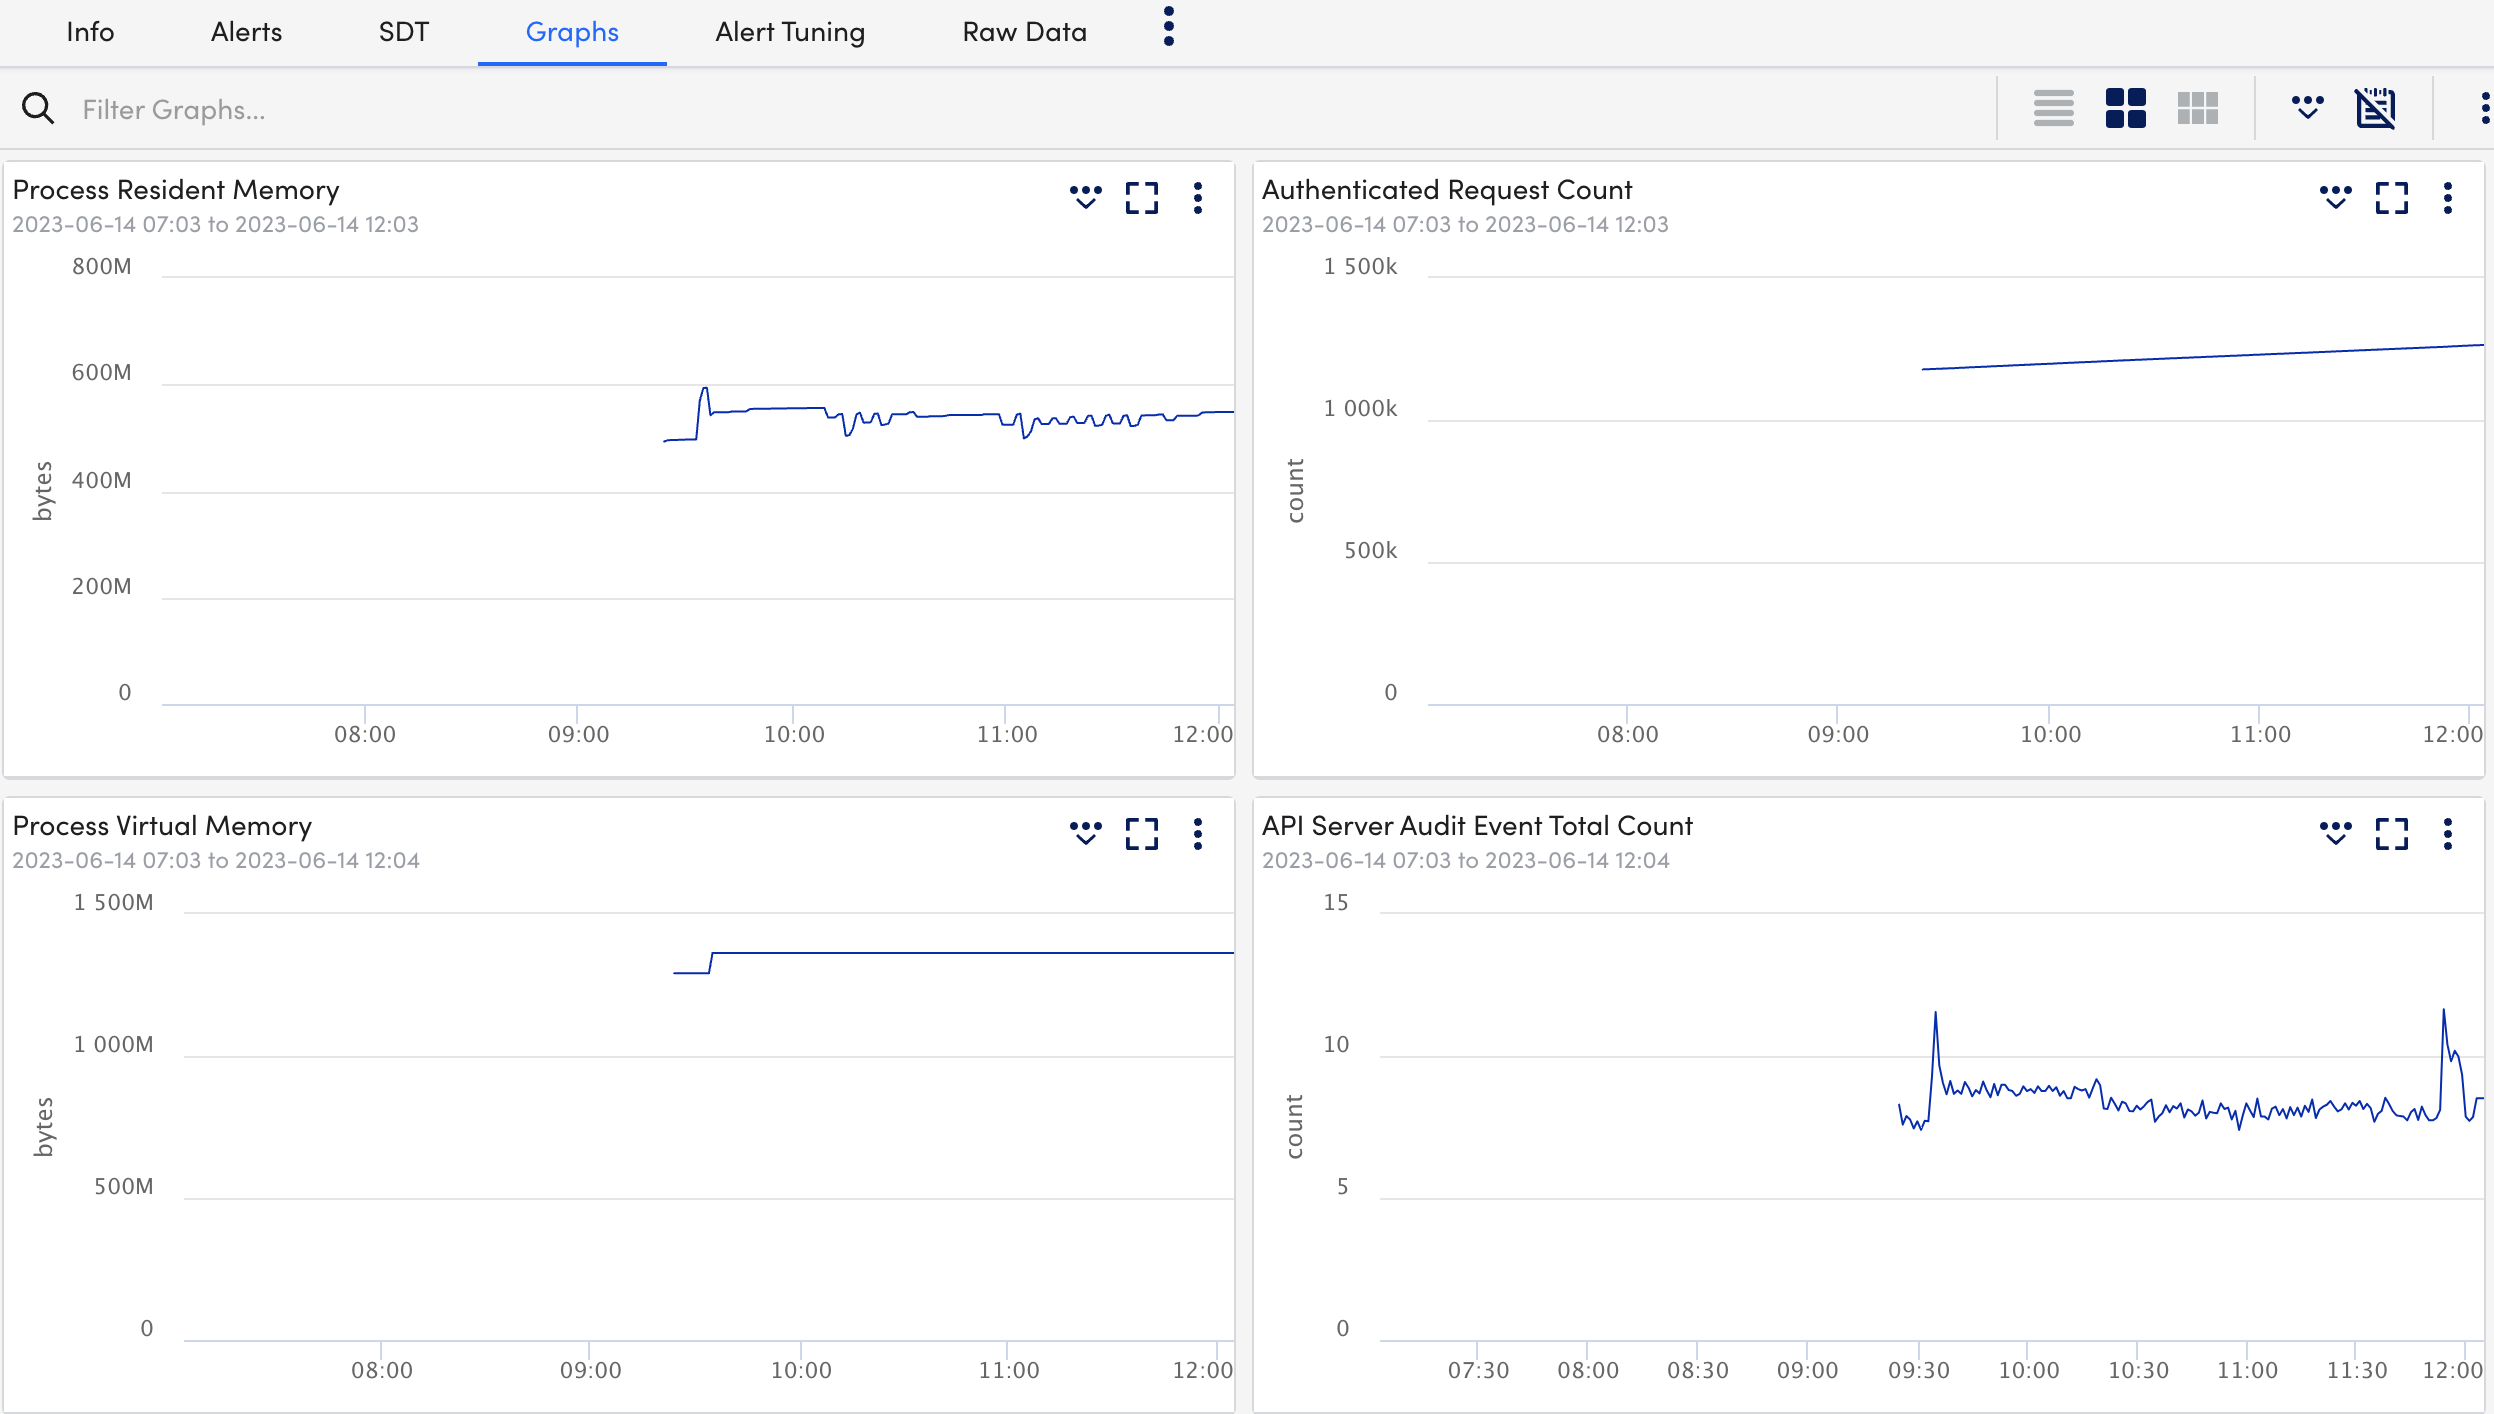
- Select Graphs tab to view the status or the details of the Kubernetes API Server in the graphical format.
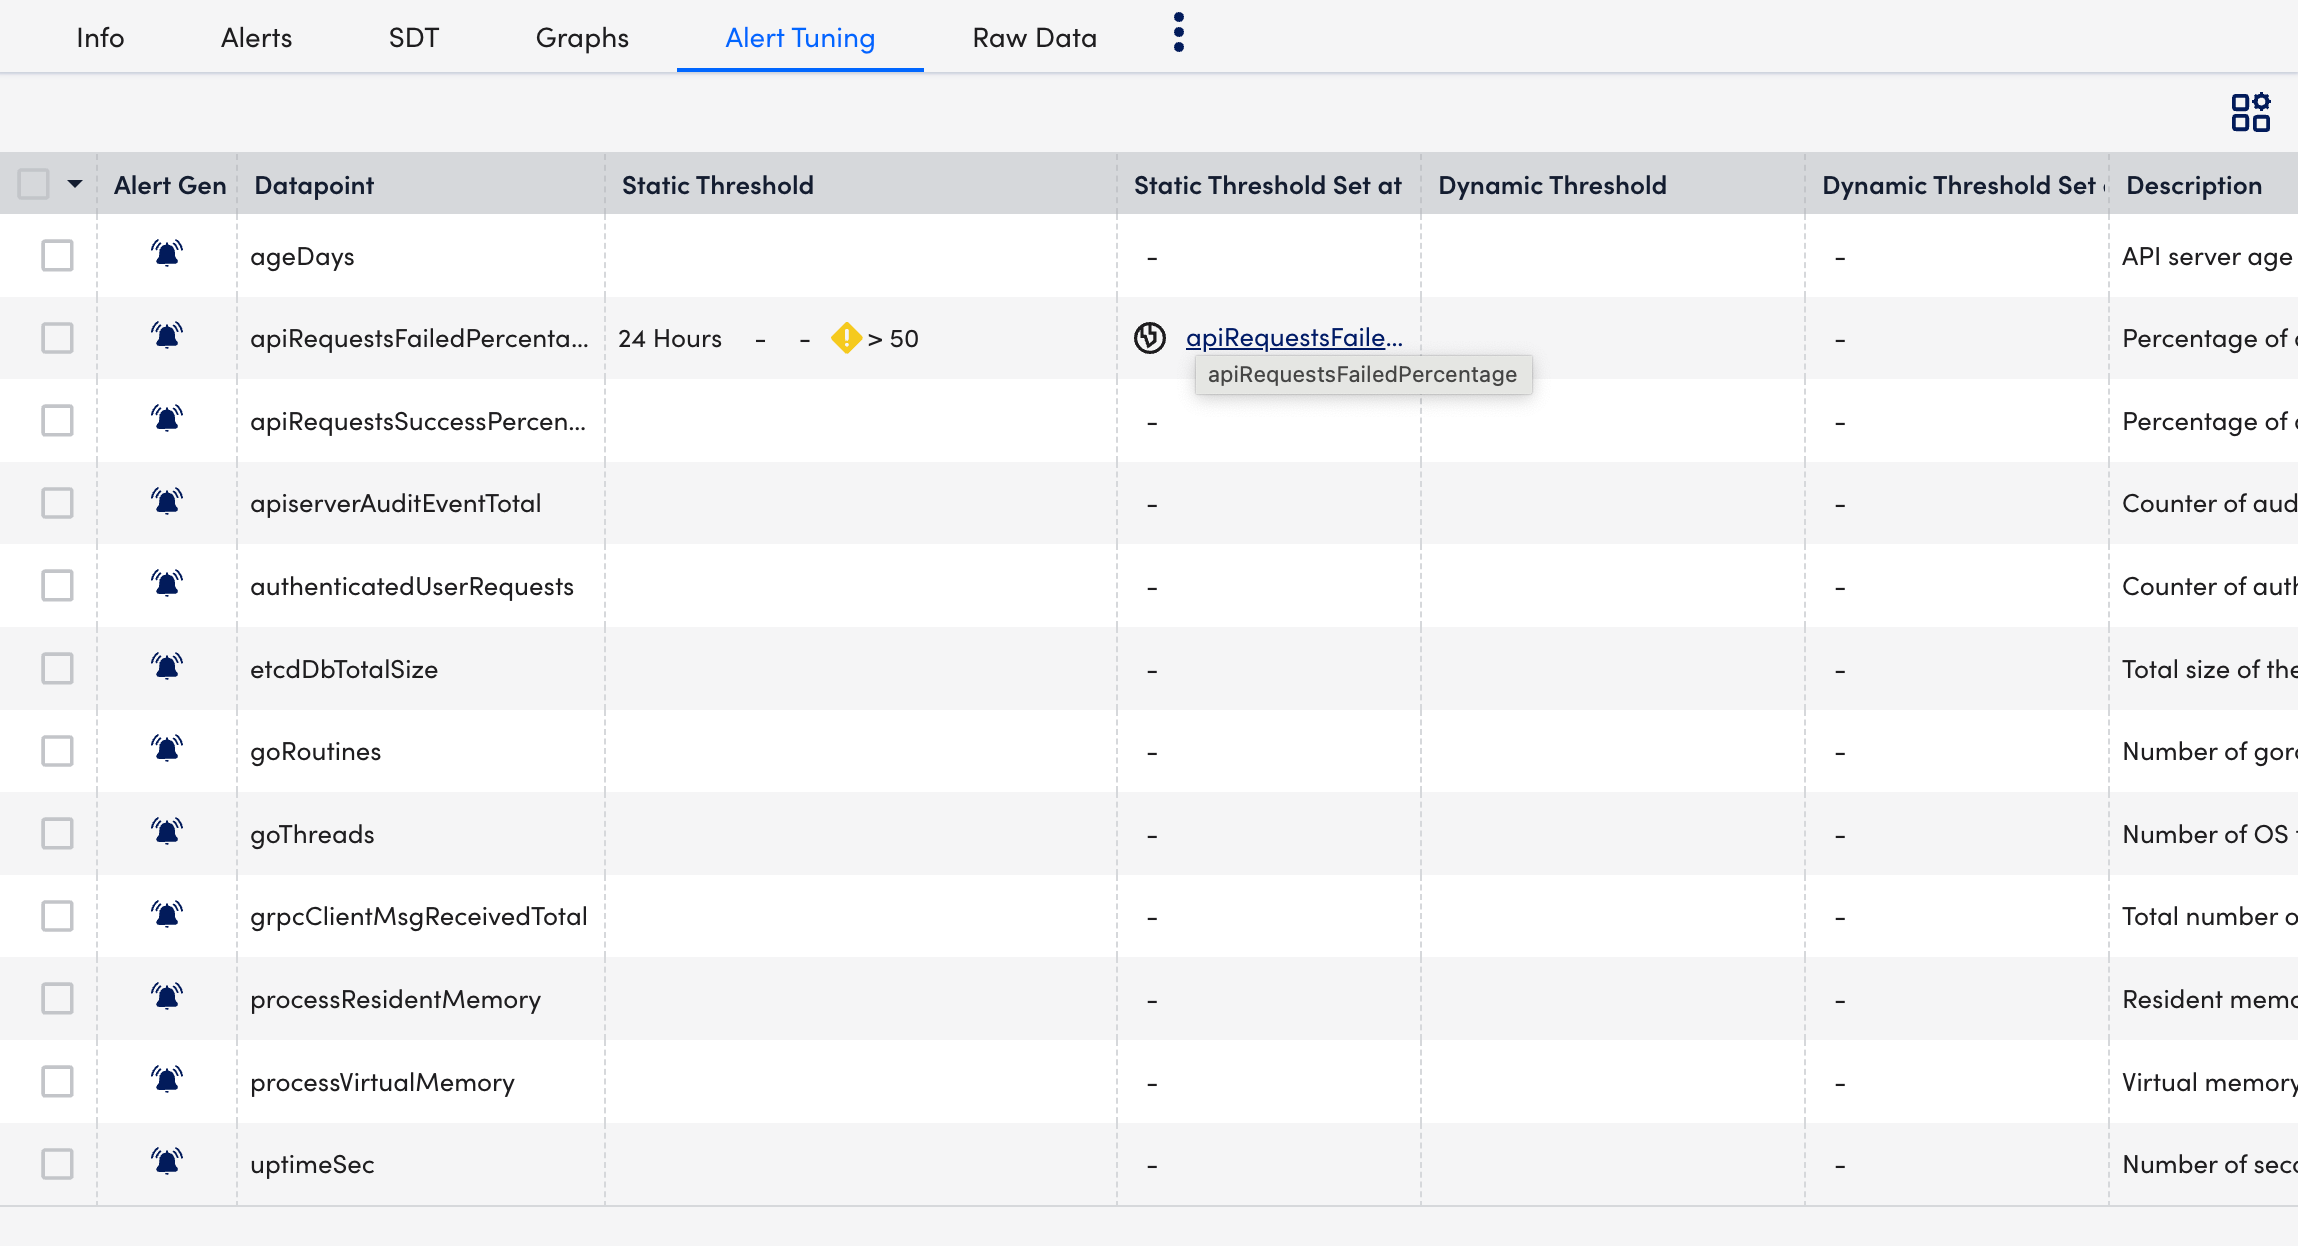
- Select Alert Tuning tab to view the datapoints on which the alerts are generated.
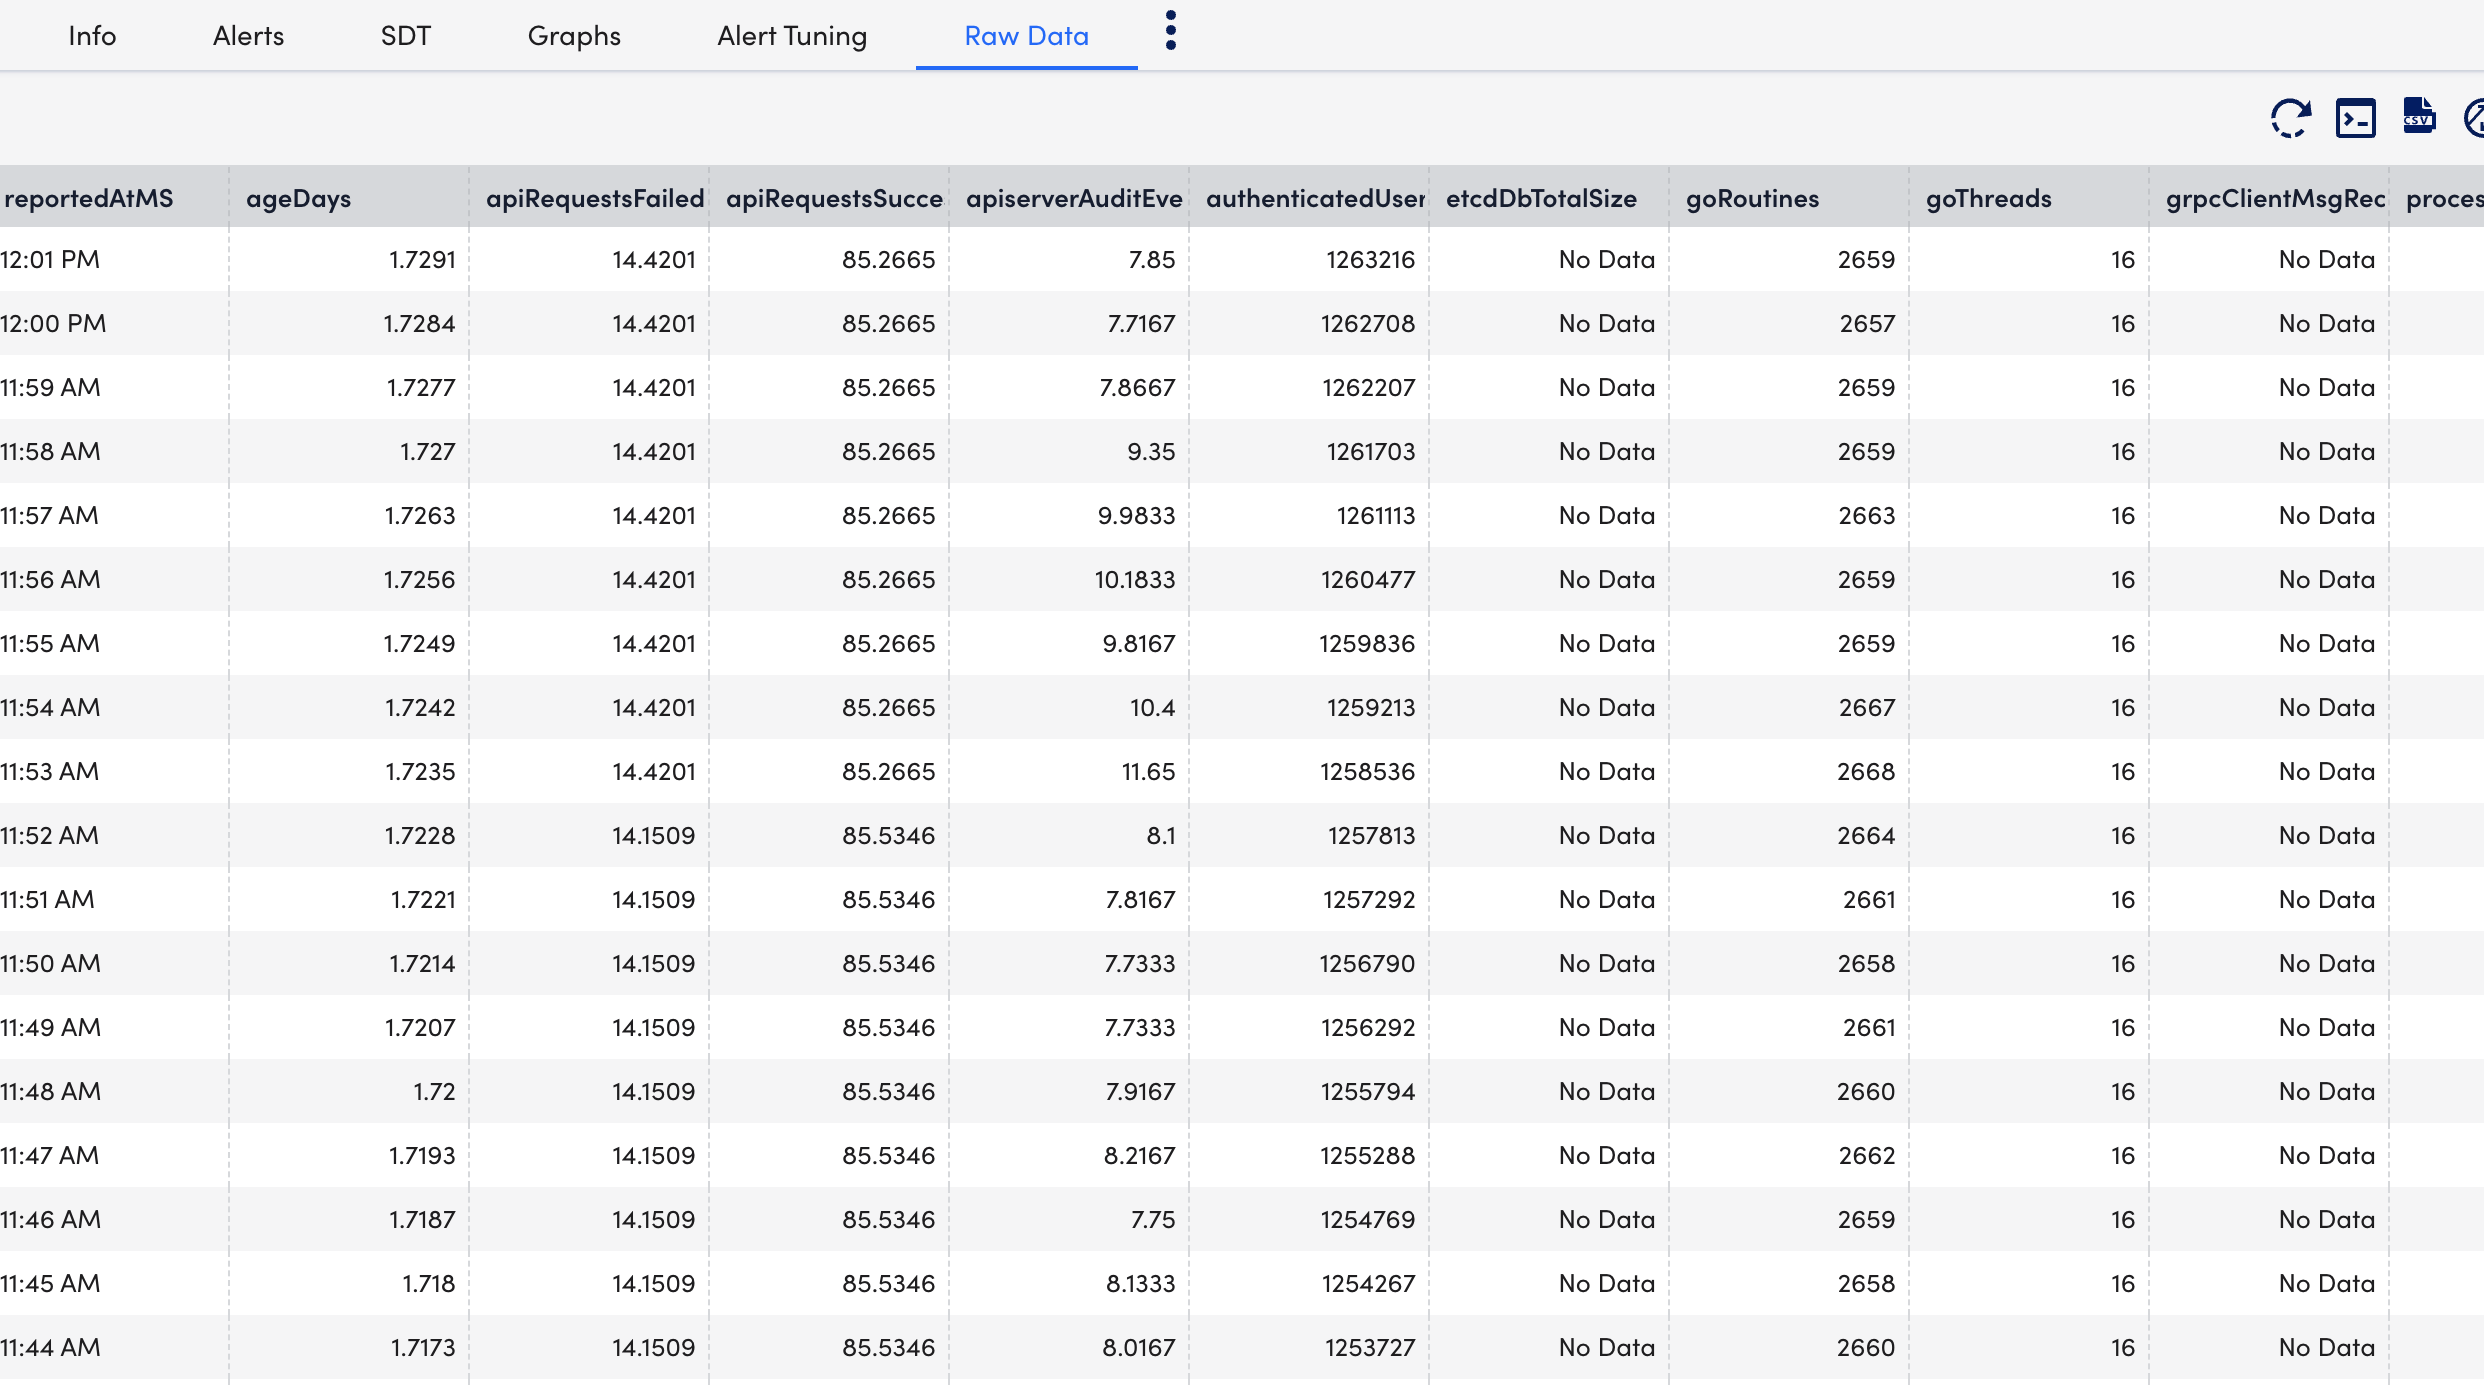
- Select Raw Data tab to view all the data returned for the defined instances.
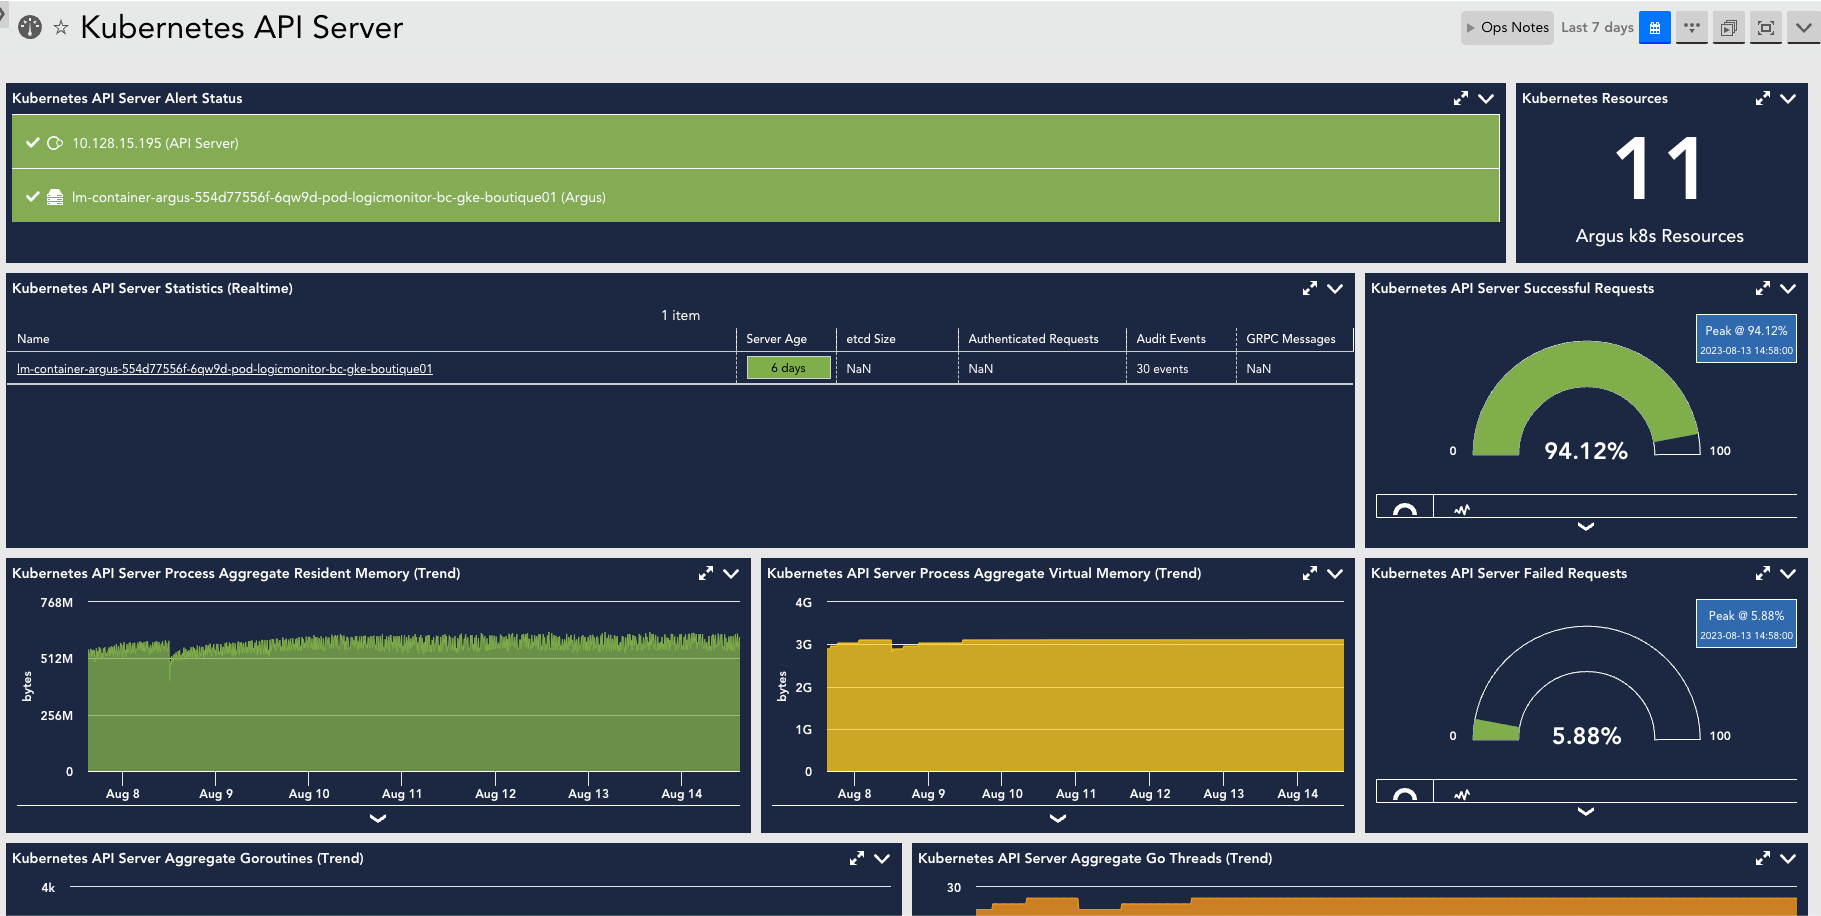
Creating Kubernetes API Server Dashboards
You can create out-of-the-box dashboards for monitoring the status of the Kubernetes API Server.
Requirement
Download the Kubernetes_API_Server.JSON file.
Procedure
- Navigate to Dashboards > Add.
- From the Add drop-down list, select From File.
- Import the downloaded
Kubernetes_API_Server.JSONfile to add the Kubernetes API Server dashboard and select Submit. - On the Add Dashboard from JSON File dialog box, enter values in the Name and the Dashboard Group fields.
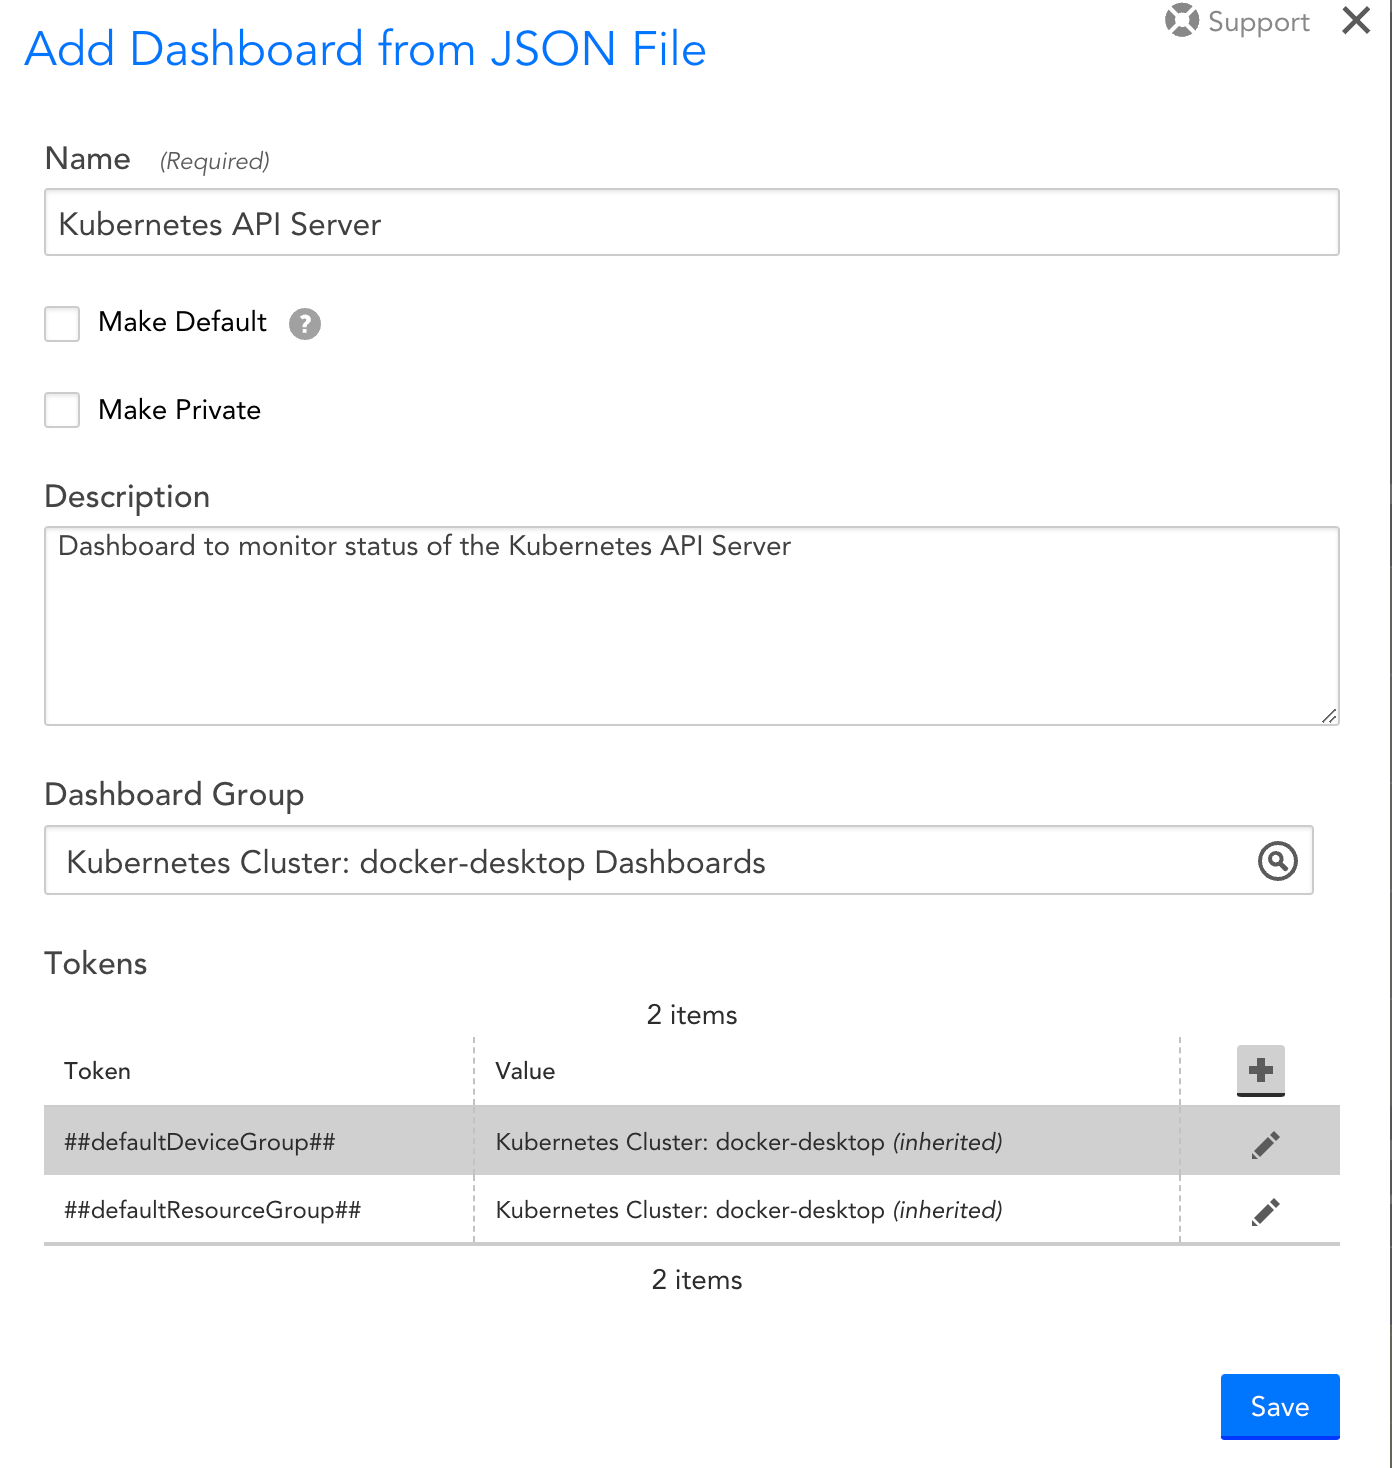
- Select Save.
On the Dashboards page, you can now see the new Kubernetes API Server dashboard created.