Troubleshooting LMDX Implementation
Last updated – 29 September, 2025
The LogicMonitor Data Exchange (LMDX) application integrates Edwin AI with your ServiceNow instances. For more information, see About LMDX. This article provides guidance when debugging your LMDX implementation.
Debugging Properties
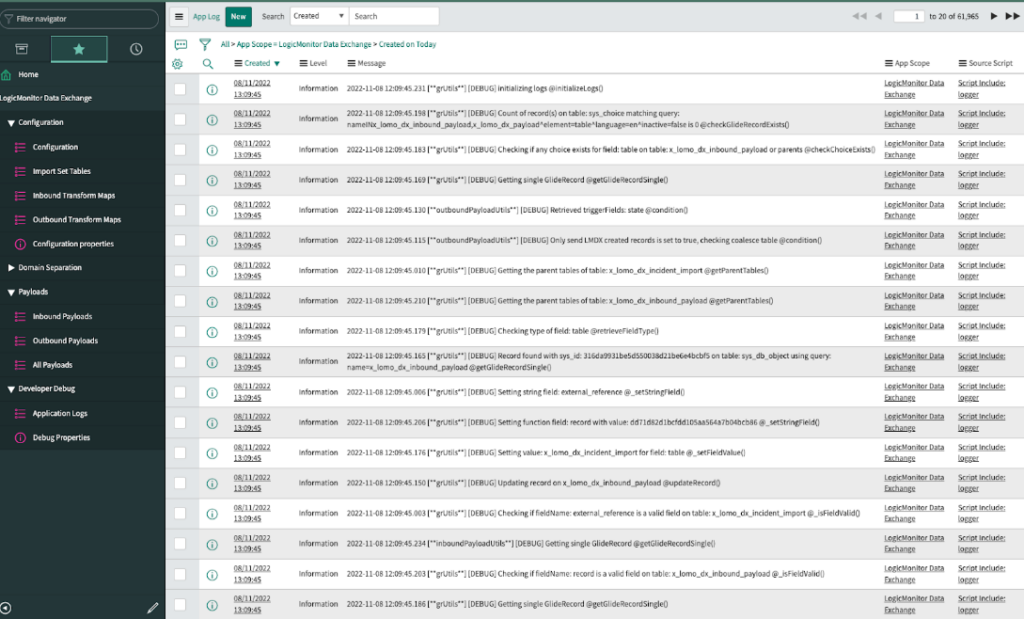
LMDX has a set of system properties that lets you turn on debugging messages for specific areas. You can find all debugging properties in ServiceNow under Developer Debug.
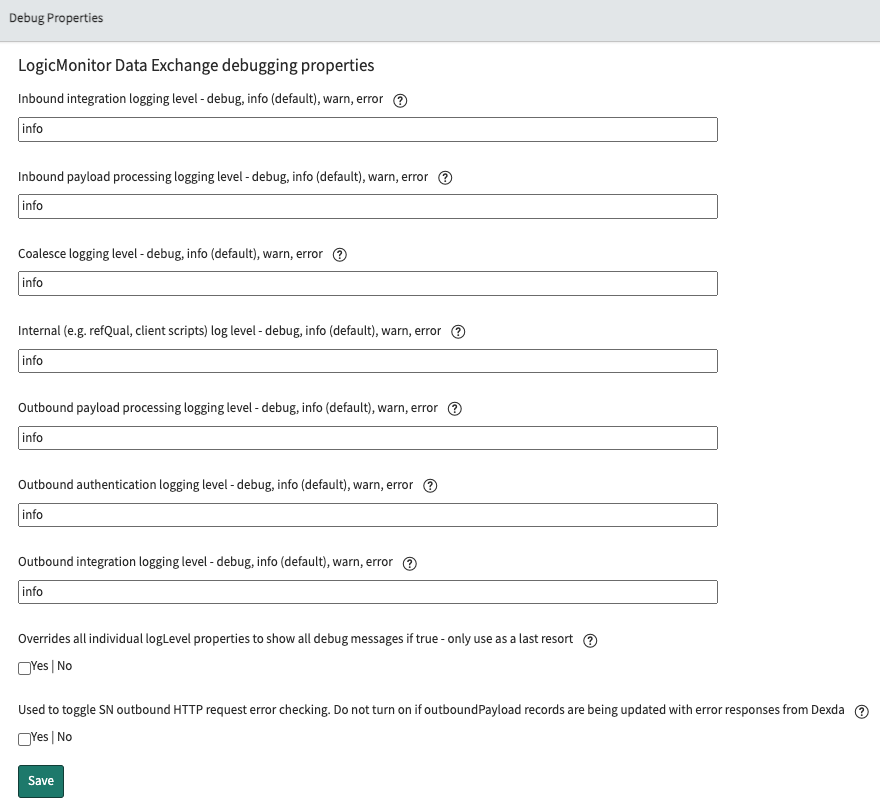
The following table lists available debugging properties.
| Property Name | Description |
x_lomo_dx.inbound.logLevel | Inbound HTTP requests. |
x_lomo_dx.payload.inbound.logLevel | Inbound payload processing. |
x_lomo_dx.coalesce.logLevel | Transform map coalescing. |
x_lomo_dx.internal.logLevel | ServiceNow application configuration, for example reference qualifiers and client scripts. |
x_lomo_dx.payload.outbound.logLevel | Outbound payload processing. |
x_lomo_dx.outbound.auth.logLevel | Edwin AI authentication. |
x_lomo_dx.outbound.logLevel | Outbound HTTP requests. |
x_lomo_dx.debug | Overall debug switch. Only use this if you are unsure of which area is causing errors. |
x_lomo_dx.outbound.snErrorCheck | Used to toggle SN outbound HTTP request error checking. Do not turn on if outboundPayload records are being updated with error responses from Edwin AI. |