Disclaimer: This content applies to the legacy UI and is no longer maintained. It will be removed at a future time. For up-to-date content, see Widgets Overview. At the time of removal, you will automatically be redirected to the up-to-date content.
Widget Overview
Last updated - 24 July, 2025
Introduction to Widgets
Data is added and displayed on dashboards through the creation of widgets. A variety of widget types enable the display of individual metrics, aggregate values, trends, statuses, relational values, and more.
LogicMonitor offers the following widget types:
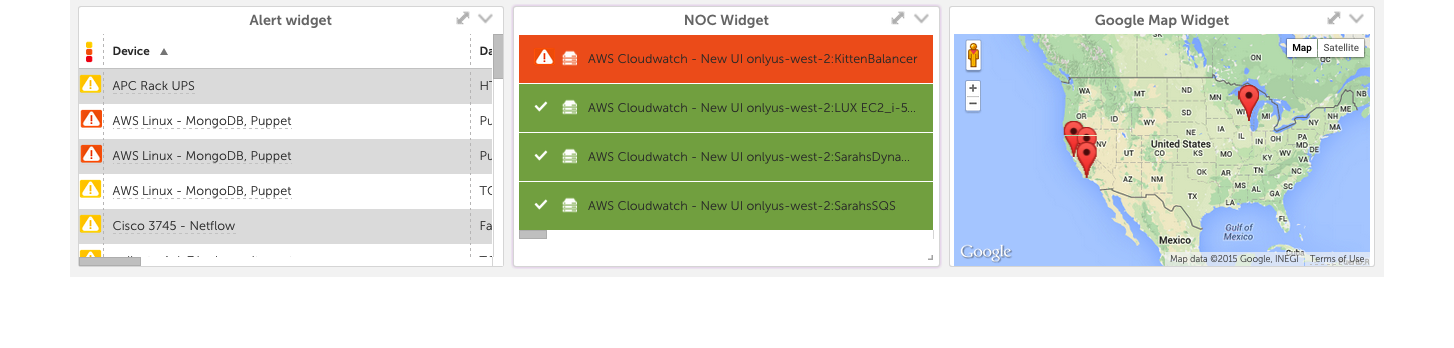
- Alert List widget. Alerts based on a variety of filters.
- JobMonitor widget. Quick view of JobMonitor status.
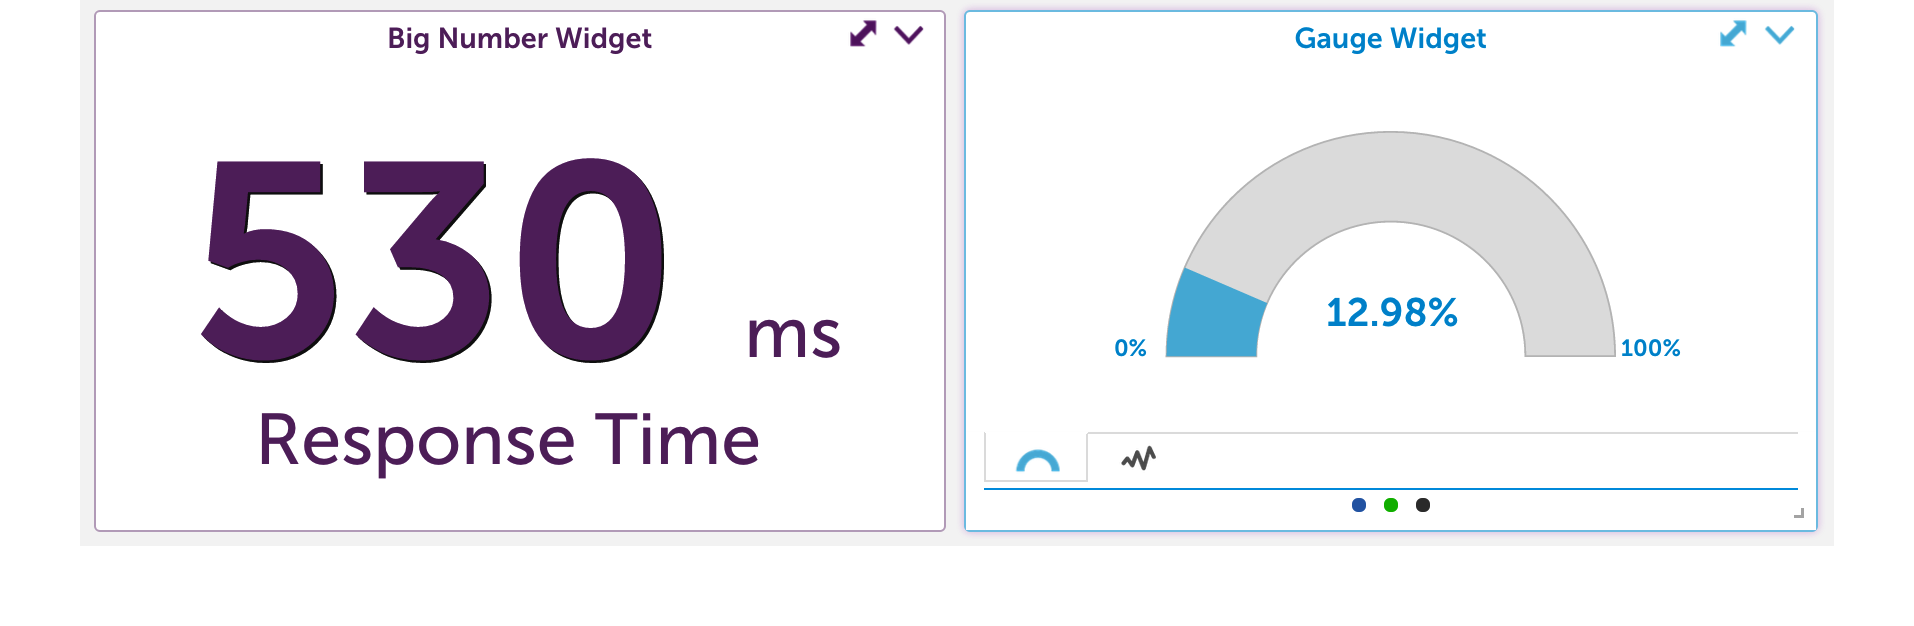
- Big Number widget. One to four specific values which can be sum, min, max or aggregate.
- Custom Graph widget. Graph any combination of datapoints together in one graph.
- Gauge widget. Speedometer view of individual or aggregate metric performance
- HTML widget. Embed any secure URL direct into your dashboard.
- Map widget. Visual status by location.
- NetFlow widget. Create any of the views currently visible under the Traffic tab for NetFlow-enabled devices. For more information on the Traffic tab, see Viewing, Filtering, and Reporting on NetFlow Data.
- NOC widget. Visual representation of group, device, or application status.
- Pie Chart widget. A useful way to display a metric in relation to other metrics, most commonly used for network traffic.
- Website Status widget. View of the status of a website from multiple testing locations.
- SLA widget. Displays the percentage of time available for one or more devices/widget.
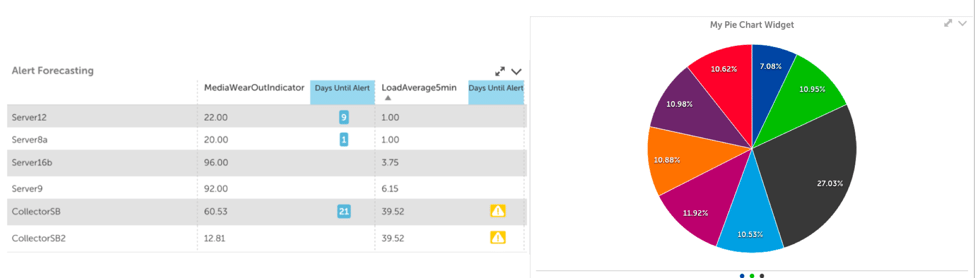
- Table widget. Displays datapoint values across multiple devices for performance and capacity comparison. Alert forecasting is enabled within the Table widget.
- Text widget. Displays HTML text or images on your dashboard.
For instructions on adding widgets to a dashboard, see Adding and Configuring Widgets.
Finding the Right Widget Type for Your Objective
The type of widget you choose for a dashboard is determined by the type of information you are looking to display. In this support article, we’ve classified widgets according to several common objectives.
I want to display status information
The recommended widgets for displaying status information are:
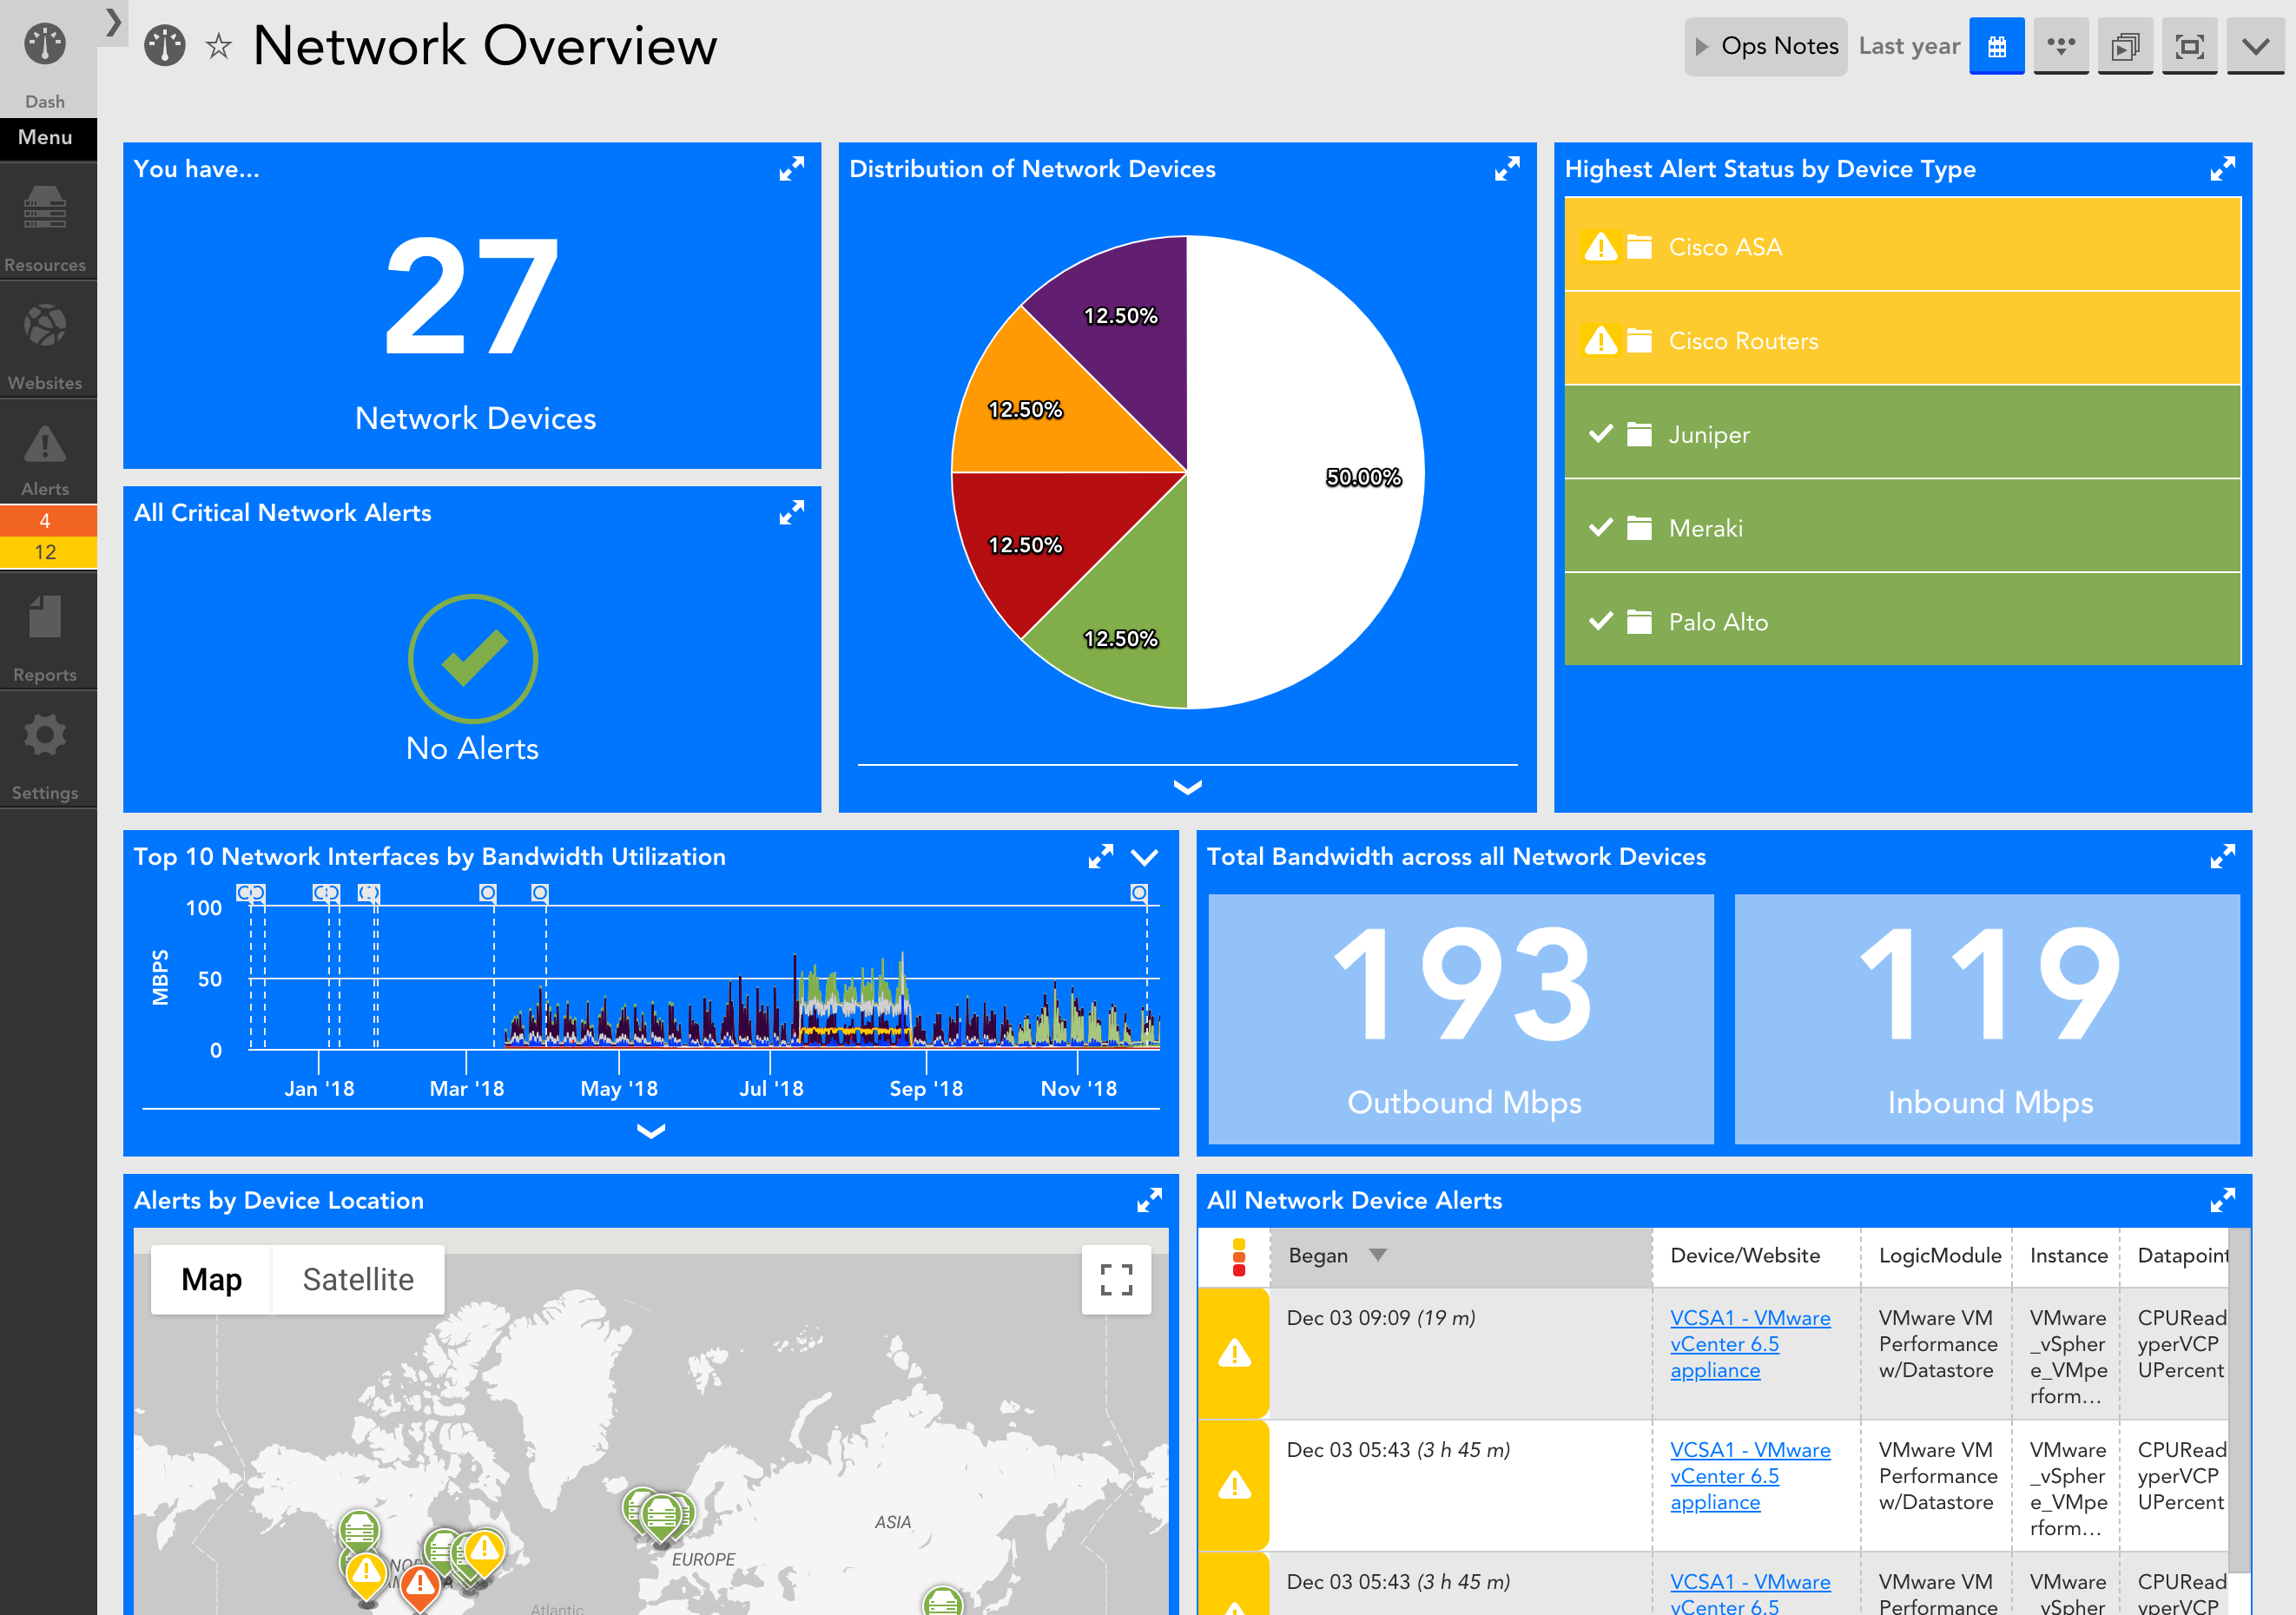
- Alert List widget. Fully customizable based on multiple filters, column selection, and sort order, display active alerts based on group or customer context. A miniature view of the Alerts page that allows you to have an easy to access pre filtered display.
- Google Map widget. Get the 30,000 foot view of location status. Display groups or devices based on location, including alert status.
- JobMonitor widget. Displays the status of batchjobs, including start and finish times.
- NOC widget. For a higher level view of status, or to get an at a glance view of multiple components. The NOC widget displays color coded items for groups, devices, DataSources, instances, or websites for an at-a-glance view of a location, application, or other meaningful combination.
- SLA widget. See the percent uptime for one or more devices or websites.
- Topology Map widget. Reflects the layer 2 relationships among resources in your network environment.
I want to display a single value
Displaying a single value, whether it is an individual metric or aggregate, can be best accomplished with the following widgets:
- Big Number widget. Displays one to four specific values. Values can be individual, aggregate, or based on calculations. Labels are configurable.
- Gauge widget. Best used when a number represented in a big number widget is better served by having a relative min/max value for context.
I want to see how one or many values are trending
There are two primary ways to see how a datapoint is trending over time, the device instance or overview graph and the Custom Graph widget. Both support line, area, and stack graph types.
- Device instance or overview graph. Graphs are defined as part of the DataSource and display datapoints specific to the DataSource. Graphs can be added to a dashboard from the Resources page, as discussed in Graphs Tab.
- Custom Graph widget. Enables any combination of datapoints to be displayed on a single graph. Values can be distinct or aggregate and can be limited to top ten.
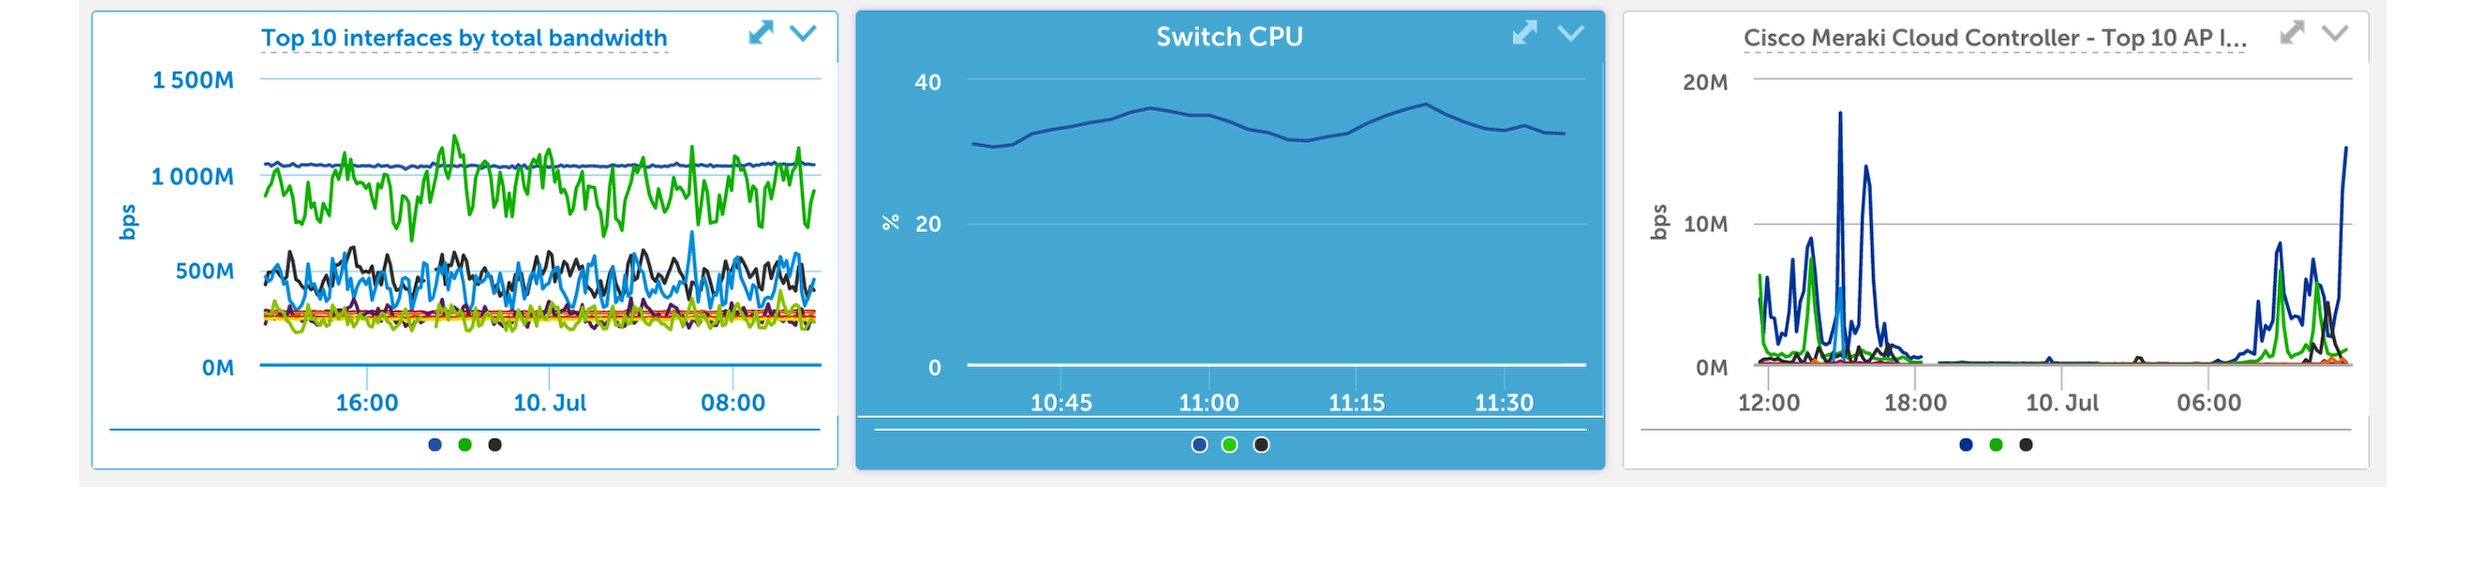
I want to compare multiple values in a single view
- Pie Chart widget. Ideal for comparing resource utilization across multiple devices, office locations, customers, etc. For example, you could compare the percentage of your network flow being used by each distinct office location.
- Table widget. Lets you easily compare datapoint values across multiple devices.
Which widgets are recommended for websites?
As with devices, website graphs can be added to a dashboard direct from the Websites page. You can also use the following widgets for websites:
- Alert List widget. A miniature view of the Alerts Page that allows for a convenient pre-filtered display of alerts.
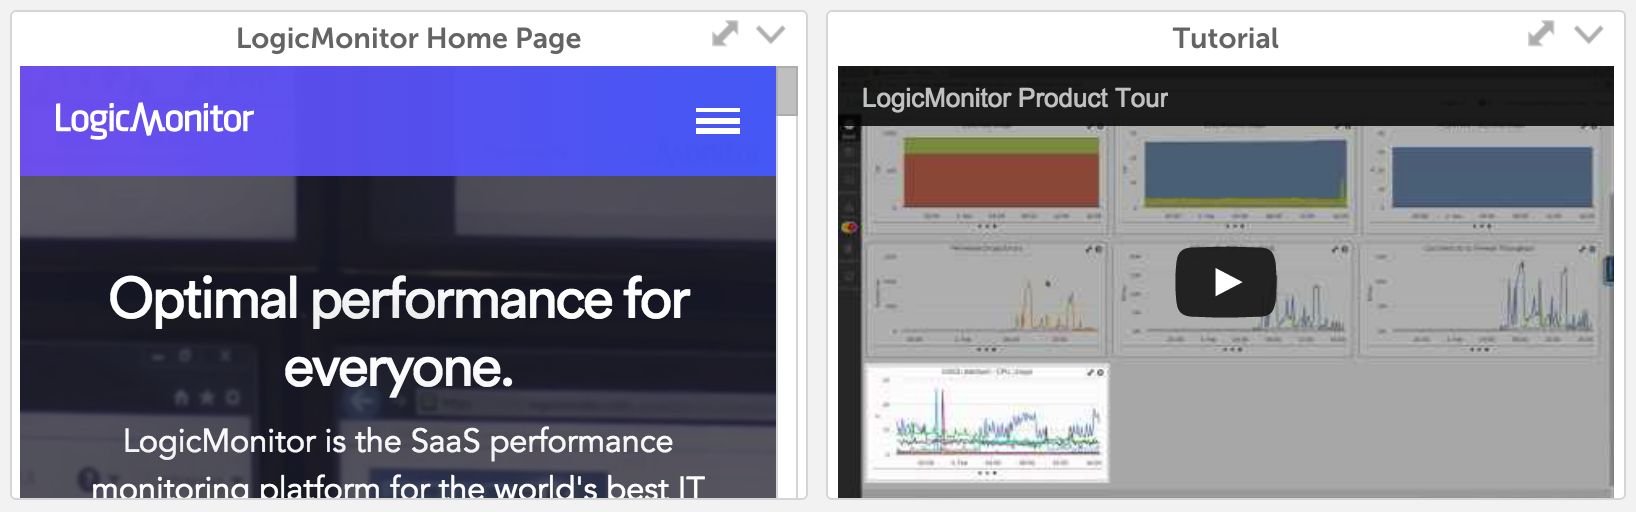
- HTML widget. An easy way to see what your customers see when accessing your URL.
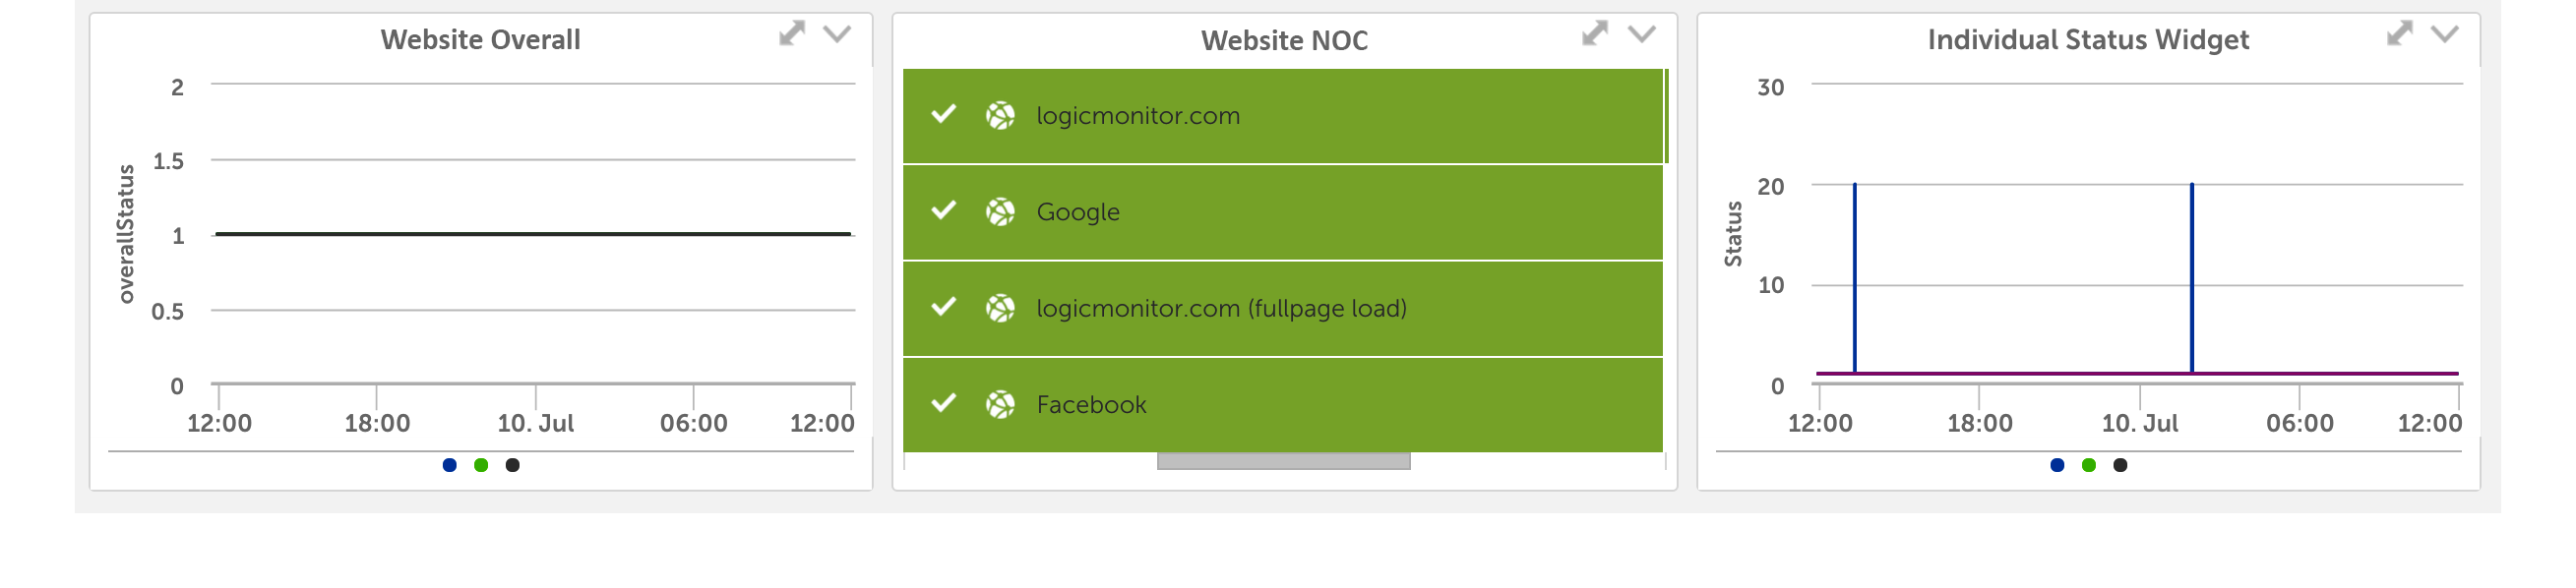
- NOC widget. See alert status of website groups or individual websites.
- SLA widget. See the percent uptime for one or more websites.
- Website Status widget. The status of a specific website across testing locations.
I want to embed external content
Videos, wikis, internal web pages, or other secure websites can be embedded in your dashboard using.
- HTML widget. Embed any secure URL.
- Text widget. Displays HTML text or images on your dashboard.