
Log Ingestion Overview
Last updated – 21 January, 2026
Almost every piece of an IT Infrastructure generates logs in some form. These log events from various resources arrive at the LM Logs ingestion endpoint for ingestion and further processing. During ingestion, information in the log lines is parsed to make it available for searching and data analysis.
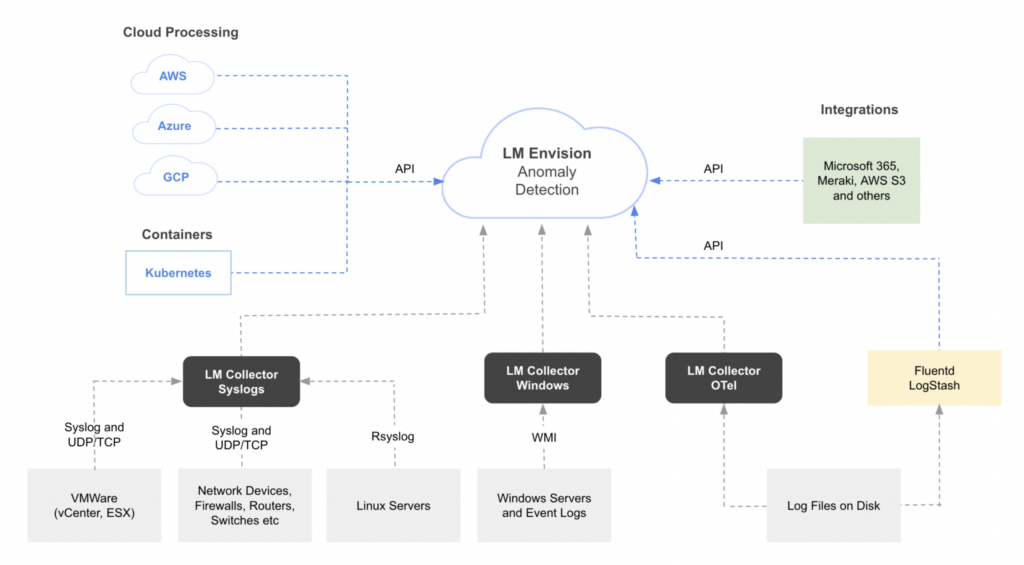
When setting up LM Logs, there are different ways of configuring resources and services to collect and send log data to LogicMonitor. Often an LM Collector is used, but you can also use the Logs REST API to send log events. The following shows examples of different log sources and methods for collecting and sending log data to LogicMonitor.
Sending Data to LM Logs
Resources must be configured to forward log data to LM Logs using one of various log data input methods. Because some methods are better suited for certain types of log data, choosing the right integration to send your data can improve how LogicMonitor processes the data and detects anomalies. For more information, see Log Anomaly Detection.
The various plugins and integrations offered by LogicMonitor for external systems merely help forward the log data. The integrations provide prewritten code that you can use in your environment to get your logs from wherever they are to the LogicMonitor API.
Log Input Options
Options for sending data to LogicMonitor depend on where the data is coming from:
- A resource, for example a host machine that generates log data.
- Log collectors or log servers.
- Cloud services.
- Other applications and technologies, including custom logs.
Available log data input options are described in the following.
LogSource
A LogSource provide templates that simplify configuration of log data collection and forwarding. LogSource is available for common log data sources like Syslog, Windows Events, and Kubernetes Events. A LogSource contains details about what logs to get, where to get them, and which fields should be parsed before sent to LM Logs for ingestion. For more information, see LogSource Overview.
Recommendation: LogSource is the recommended method to enable LM Logs. However, to use LogSource, the LM Collector must be version EA 31.200 or later.
To ingest logs, you can use any of the following LogicModules using the LM Collector:
- LogSource—Provides templates that simplify configuration of log data collection and forwarding. LogSource is available for common log data sources such as Syslog, Windows Events, and Kubernetes Events. A LogSource includes details about what logs to get, where to get them, and which fields should be parsed before sent to LM Logs for ingestion. For more information, see LogSource Overview.
Recommendation: LogSource is the recommended method to enable LM Logs. However, to use LogSource, the LM Collector must be version EA 31.200 or later. - EventSource—Provides definitive monitoring and alerting activity for non-numeric event-based data. An EventSource is a definition that instructs your Collector what information is collected or received, what resource the information is collected or received from, and when alerts are triggered on that information. For more information, see EventSource Configuration.
- DataSource—Provides templates to help you define which numerical data to collect, how to collect it, and which values should be graphed and trigger alerts. For more information, see DataSources Configuration.
Alternatively, you can send log events directly to LogicMonitor through the Logs REST API. Use this method of log ingestion for custom or application-based log generation. For more information, see Sending Logs to Ingestion API.
The following provides an overview of options for collecting and sending log data from different datasources to LM Logs.
| Datasource | Description | Using LogSource | Other configuration options |
| Network devices, firewalls, routers, and switches. | Forward Syslog logs using standard UDP/TCP protocols. | LogSource for Syslog. See Syslog LogSource Configuration. | Configure the log collection. See Syslog Log Ingestion Overview. |
| Linux servers | Forward Syslog logs from Unix-based systems. | LogSource for Syslog. See Syslog LogSource Configuration. | Configure the log collection. See Syslog Log Ingestion Overview. |
| VMWare (vCenter, ESX) | Forward logs from VMWare hosts using the built-in vmsyslogd service. | LogSource for Syslog. See Syslog LogSource Configuration. | N/A |
| Windows Servers and Event Logs | Forward logs from Windows- based systems using WMI. | LogSource for Windows Event Logging. See Windows Event Logging LogSource Configuration. | Install and configure the Windows Events LM Logs DataSource. See Windows Event Logs Ingestion. |
| Cloud Services – Amazon Web Service (AWS) | Forward Amazon CloudWatch logs using a Lambda function configured to send log events. | N/A | Configure the collection and forwarding of AWS logs. See AWS Logs Ingestion Overview. |
| Cloud Services – Microsoft Azure | Forward logs using an Azure function that consumes logs from an Event Hub. | N/A | Configure the collection and forwarding of Azure logs. See Azure Resource Log Configuration for Log Ingestion. |
| Cloud Services – Google Cloud Platform (GCP) | Forward different types of application logs from various GCP resources. | N/A | Configure the collection and forwarding of GCP logs. See Google Cloud Provider Log Ingestion Configuration. |
| Containers – Kubernetes | Forward logs from Kubernetes clusters, cluster groups, containerized applications, and pods. | LogSource for Kubernetes Event Logging. See Kubernetes Event Logging LogSource Configuration. LogSource for Kubernetes Pods. See Kubernetes Pods LogSource Configuration. | Install and configure the LM Kubernetes Monitoring Integration. The integration includes methods for logs for events, clusters, and pods. See Sending Kubernetes Logs and Events. |
| Log files on disk – application traces | Forward traces from instrumented applications. | LogSource for Log Files. See Log Files LogSource Configuration. | N/A |
| Log files on disk – LogStash events | Forward Logstash events to the LM Logs ingestion API. Can be used for most datasources. | LogSource for Log Files. See Log Files LogSource Configuration. | Install and configure the LM Logs Logstash plugin. See Sending Logstash Logs. |
| Log files on disk – any files | Forward logs from multiple sources, structure the data in JSON format, and forward to the LM Logs ingestion API. Can be used for most datasources. | LogSource for Log Files. See Log Files LogSource Configuration. | Install and configure the LM Logs Fluentd plugin. See Sending Fluentd Logs. |
| Custom logs | Forward custom logs directly to your LM account through the public API. Use this option if a log integration isn’t available, or you have custom logs you want to analyze. | LogSource for API Script (supports API filtering). See Script Logs LogSource Configuration. | Configure the log collection. See Sending Logs to Ingestion API. |
Recommendation: Ensure you use the available filtering options to remove logs that contain sensitive information so that they are not sent to LogicMonitor.
Deviceless Logs
In LM Logs, you can also view logs that come from the resources that are not being monitored by LogicMonitor. Logs that are not mapped to an LM-monitored resource (also called as “deviceless logs”) are still available to view and search. For such logs, the Resource and Resource Group fields are empty in the Logs page listing, and some functionalities may not be available such as log alerting and anomaly detection in certain situations.
Log Alerting for Deviceless Logs
You can create logalert groups for unmapped resources. Since there is no LM-monitored resource or resource group for these, LogicMonitor automatically associates the pipeline with a special resource and resource group. The resource name will be same as the pipeline name. The resource group for unmapped resources is called “LogPipelineResources”.
Note: The unmapped resource group LogPipelinesResources does not appear in the Resource tree. However, to assign permissions, this resource group appears at Settings > Users and Roles > User Access > Roles > Manage Roles.
Log alerts are created based on the alert conditions configured for the pipeline. You can see alerts for unmapped resources on the Alerts page. By default, log alerts for unmapped resources can only be seen by users with administrator access. You can change this by navigating to Settings > Users and Roles and assigning the desired permission to the LogPipelineResources group.
Anomaly Detection for Deviceless Logs
For deviceless logs, anomaly detection is based on the service (resource.service.name) and namespace (resource.service.namespace) keys. If these keys are not present in the ingested log event, anomaly detection will not be done. In case of Syslog, you can use Log Fields from LogSource to provide these values. For more information, see Syslog LogSource Configuration.
