
LM Logs Overview
Last updated – 10 June, 2026
LogicMonitor offers a unique and unified approach to log analysis based on algorithmic root-cause analysis. LM Logs analyzes log events from IT environments to identify normal patterns and deviations from these. Deviations are referred to as anomalies. Through anomaly detection teams can act on issues early, before they become more complex and expensive to resolve.
Getting Started
When enabling LM Logs for your LogicMonitor solution you must decide how to collect and send log data from monitored resources to LM Logs for ingestion. Data can come from different sources like networks, collectors, host machines, log servers, and cloud services.
Enabling LM Logs
When setting up LM Logs, source devices and services are configured to forward data to one of various log data input methods. Often this is a LogicMonitor Collector, but you can also use the Logs REST API to forward log events to LM Logs.
Some methods for sending logs are better suited for certain types of log data. Choosing the right integration to send log data can improve how LogicMonitor ingests and processes the data.
Depending on the source of data, you can enable LM logs as follows:
- LogSource—Use LogSource to configure the forwarding of log data to LM Logs. LogSource is a LogicModule that provides configuration support using templates for data collection from monitored logs.
- Collector Configuration—Configure log collection and forwarding to LM Logs by directly editing the agent.conf file for the collector. Using this method you can enable logs for Syslog, Windows Events, Kubernetes Events, and other common sources of log data.
- Cloud Services—For cloud services you can collect data through the API, and optionally an LM Collector. LogicMonitor supports Amazon Web Services (AWS), Microsoft Azure, and the Google Cloud Platform (GCP).
For more information about enabling options, see Log Input Options.
Log Ingestion and Processing
Log events are sent to the API endpoint for LM Logs. Here logs are enriched with metadata, and forwarded to the log ingestion services for further processing. The ingestion service performs validation, authentication, authorization and resource mapping. For more information, see About Log Ingestion and Log Processing.
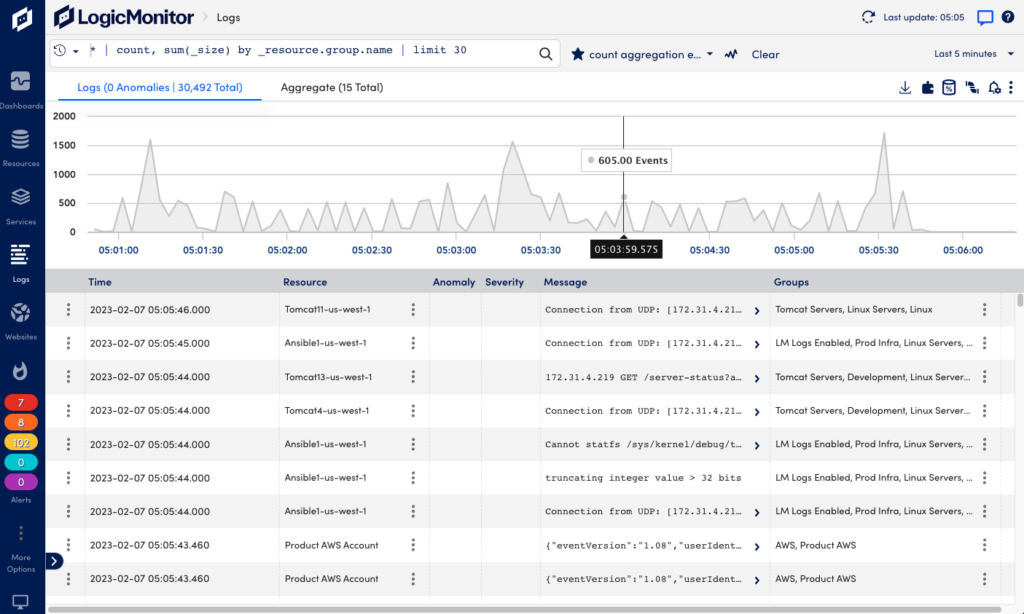
Viewing Logs
Once logs are sent to LM Logs, they are mapped to monitored resources based on information sent to the API. You can see ingested log events and log anomalies in the Logs page where you can use keyword search and filtering for analysis.
When investigating issues, you can also see log information in context of for example alerts and resources. For more information, see Viewing Logs and Log Anomalies.
Note: Logs can be viewed in LM Logs even if the log is not associated with an LM-monitored resource. Even without resource mapping, or when there are resource mapping issues, logs are still available for viewing and searching. For more information, see Deviceless Logs.
Log Anomalies
Anomaly detection identifies data that does not conform to expected patterns. Through log profiles you can gain insight into resource behavior, allowing you to potentially catch issues before they escalate into more severe events. For more information, see Log Anomaly Detection.
Log Queries
Using the LM Logs query language you can search and filter logs by resource, resource group, and time range. This helps you narrow down information to quickly find relevant logs when troubleshooting. Query Tracking lets you monitor usage and track counts for specific logs. For more information, see Query Language Overview and Query Tracking.
LogAlert Groups and LogAlerts
Log events are channeled into logalert groups for analysis. Using logalerts you can define logalert group filters to track specific logs and trigger alerts only for issues you want to be notified about. LogAlerts use regular expression patterns to match ingested logs and trigger the alerts. For more information, see Log LogAlert Groups and LogAlerts.
Troubleshooting
If you are having issues setting up log ingestion or reviewing logs, check the Troubleshooting guide for common issues. You can also find troubleshooting help for each integration in the configuration guide in the Log Ingestion section.
