
Troubleshooting Kubernetes Monitoring
Last updated - 29 October, 2025
Kubernetes Resource Visibility Limit
Addition of excessive Kubernetes resources causes service disruptions and degrade portal performance. To support platform performance and optimize the user experience, LogicMonitor enforces a limit on the number of Kubernetes resources.
LogicMonitor enforces this limit starting with v.225.
Requirements for Resolving Kubernetes Resource Visibility Limit
If the platform-wide limit of 25,000 resources is reached, additional Kubernetes resources are excluded by the system and do not display in the platform.
Before troubleshooting, review the following requirements:
- The default platform-wide limit for Kubernetes Resources is 25,000.
- Additional Kubernetes resources beyond this limit are not displayed in the platform.
- The limit applies to all resources, including those that have been deleted but are retained based on retention policy
Resolving the Kubernetes Resource Visibility Limit
If the resource limit is reached and additional Kubernetes resources do not display, do the following:
- Review the Resource Retention Policy
Check theglobalDeleteAfterDurationproperty in thelm-container-configuration.yamlfile to see your current retention configuration or review the setting in the LogicMonitor portal. You can also check thekubernetes.resourcedeleteafterdurationproperty in the Kubernetes root folder.
Note: Shorter retention periods can help reduce your total Resource count.
- Adjust the Retention Period
If the currently set retention limit is too long, adjust it to a more suitable value. Shortening the retention period reduces the number of retained (deleted) resources counted toward the limit. - Contact Customer Support Manager
If your operational needs require a higher threshold than 25,000 resources, contact your Customer Success Manager to discuss available options.
If the Helm install commands fail:
- Make sure that the Kubernetes RBAC enabled option was correctly selected during install. This controls the ‘enableRBAC’ Helm chart values, which must match the RBAC in your cluster (for example if RBAC is not enabled for your cluster, this value must be false).
- Confirm that your LogicMonitor API Tokens are valid, and have sufficient permission.
- Check the logs for the Argus & Collectorset-Controller pods
If Helm install commands succeed, but your cluster is not added to monitoring:
- Check whether the Collector Group added. If it wasn’t, there may be an issue with the LogicMonitor API Tokens provided. You can use the LogicMonitor Audit Log to identify if the request was denied.
- Check whether Collectors were successfully installed. If the Collector Group was added, but Collectors weren’t successfully installed, it’s not likely to be an issue with your API Tokens. It may be that Collector installation memory requirements were not met – confirm that this is not the case. If the Collectors aren’t properly installed, it’s also a good idea to look at the logs for the Argus, Collectorset-Controller, and Collector pods.
- If you are using OpenShift, you may need to elevate the permissions of the serviceaccount for the Collector to enable install. You can do this via the following command (assumes the default namespace is used):
oc adm policy add-scc-to-user anyuid system:serviceaccount:default:collector
If Helm install commands succeed, and your cluster was added into monitoring but data collection does not work:
- Ensure you’re using the latest version of the DataSources. We regularly release new versions of our DataSources to include bug fixes and improvements. To import newer versions, please see this article
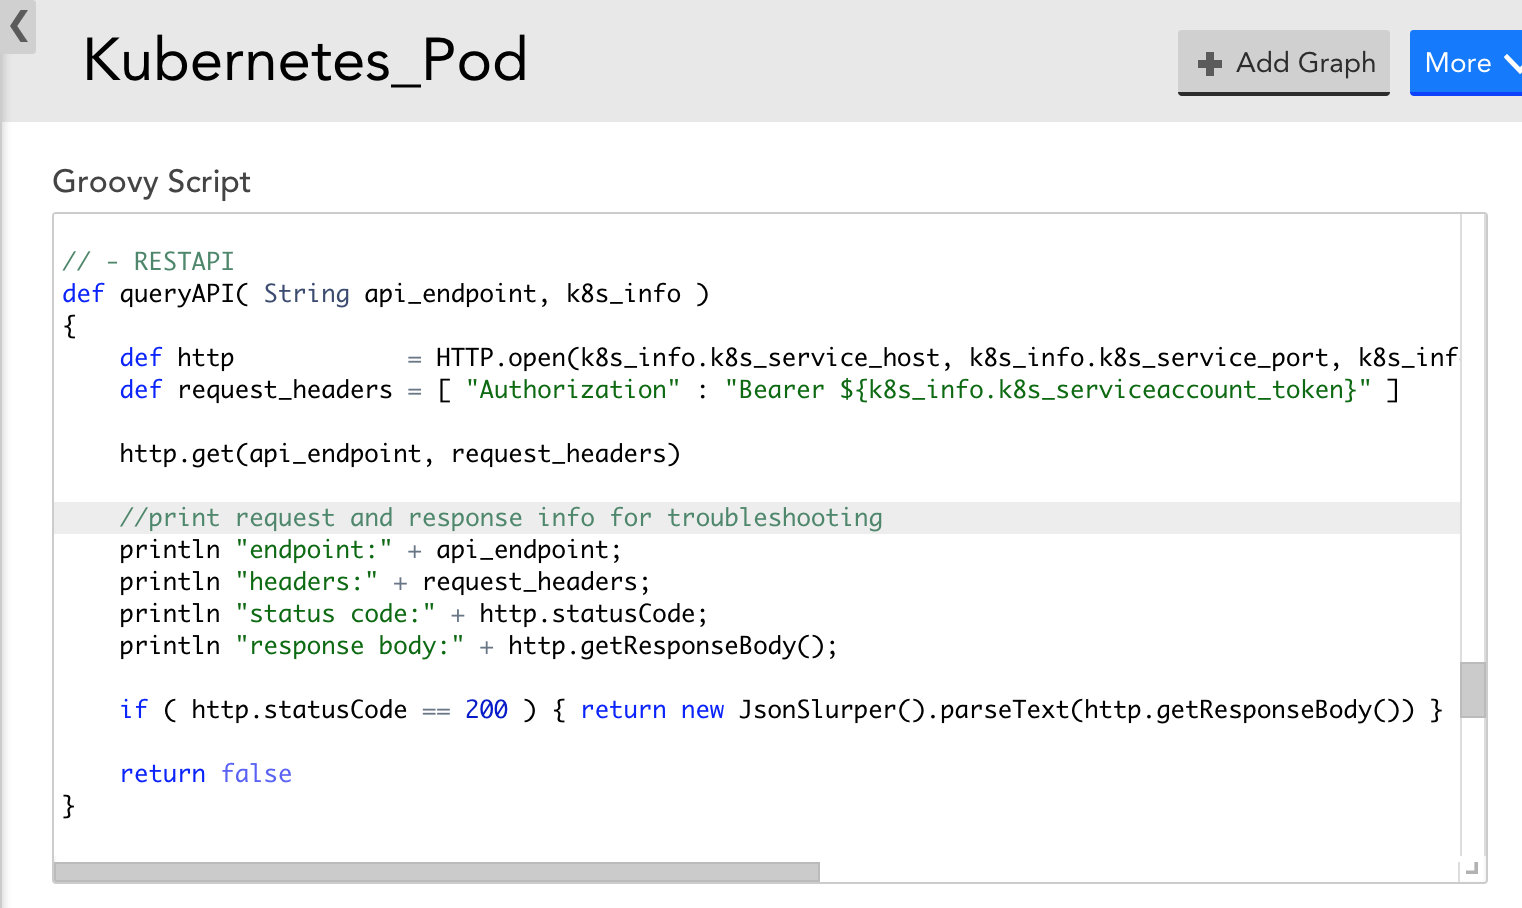
- If, with the latest version of the DataSources, data collection still doesn’t work – you can modify the DataSource to display the Kubernetes API response and status code to get more information. For example, the Pod DataSource could be modified to print out request and response information to narrow down what error the Kubernetes API is returning during data collection attempts, as in the following screenshot. This may help you identify why data collection isn’t working.
If you are unable to set up Argus and Collectorset-Controller pods in GKE due to memory, CPU, and ephemeral storage, use the following configuration:
- Ensure to set the resource limits and requests (memory, CPU, ephemeral storage) for the collector using the Argus configuration file.
Sample file:
statefulsetspec:
      template:
        spec:
         containers:
           - name: collector
           resources:
             requests:
               cpu: 1000m
               ephemeral-storage: 5Gi
memory: 2GiIf the following gRPC connection failure occurs while installing Argus:
level=warning msg="Error while creating gRPC connection. Error: context deadline exceeded" argus_pod_id=<pod-id> debug_id=<id> goroutine=1 method=pkg/connection.createGRPCConnection watch=init
- Run the following command to log in to the Argus Pod shell:
kubectl exec -it <argus_Pod_name> /bin/sh
- Check communication between the Argus and Collectorset-Controller pods:
curl http://collectorset-controller:50000
- If the communication fails and an error occurs, you must check the parameters of the restrictions set in the internal network policies.
If Collector pods restart frequently on an OpenShift v4.x cluster and cause monitoring gaps, do the following:
The Docker collector runs all the collection jobs; however, the limit is insufficient for the large-scale clusters as OpenShift has a default container PID limit of 1024 that limits the number of processes to 1024.
You can modify the settings by using a ContainerRuntimeConfig custom resource.
For example, you have labeled a Pod as machineconfigpool on which you want to increase the PID limit with key as custom-crio and value as custom-pidslimit, then modify the configuration file as follows:
apiVersion: machineconfiguration.openshift.io/v1
kind: ContainerRuntimeConfig
metadata:
 name: custom-pidslimit
spec:
 machineConfigPoolSelector:
   matchLabels:
     custom-crio: custom-pidslimit
 containerRuntimeConfig:
pidsLimit: 4096Note: The appropriate PID limit may vary based on the collector size and the number of Kubernetes resources that are monitored. However, the default PID limit set for the small-size collector is a minimum of 4096.
You can also verify if the PID limit is effective by entering the following command in the pod shell:cat /sys/fs/cgroup/pids/pids.current
