
Alerts Tab
Last updated – 25 March, 2026
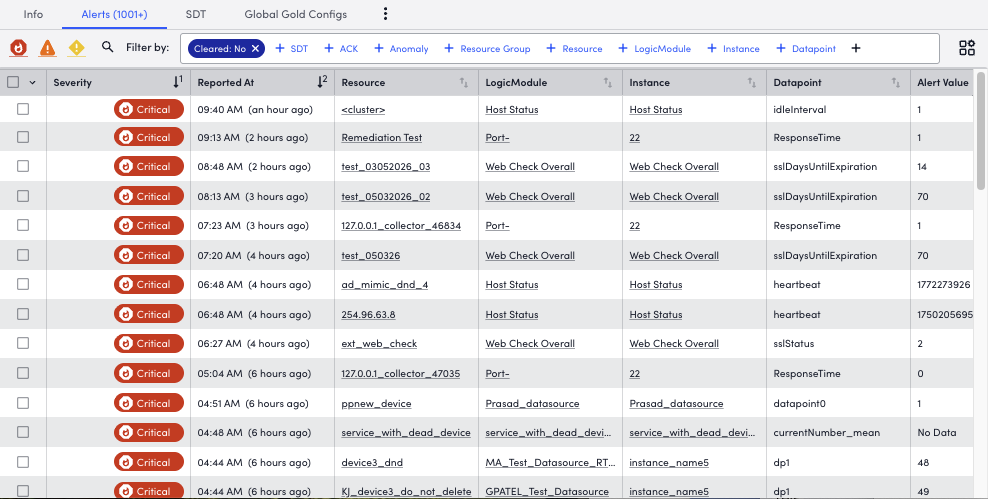
The Alerts tab is a filtered view of the Alerts page, displaying active alerts only for the current selected item (for example, a resource group, resource, DataSource, Service, or instance found in the Resources tree).
Active alerts can be customized using various filters (for example, severity level, resource, instance). For more information about the filters, see Filtering Alerts from Managing Alerts from the Alerts Page.
Note: The Global Time Picker does not filter alerts in the Alerts tab. This view displays the current active alert state for the selected item. To filter alerts by a specific time range, use the Alerts page. For more information, see Managing Alerts from the Alerts Page.
Note: You can also view data forecast graphs and anomaly detection. For more information, see Data Forecast Visualization and Anomaly Detection Visualization.
