Kubernetes Controller Manager Monitoring
Last updated - 10 August, 2023
The Controller Manager are control loops that continuously watch the state of your cluster loop in a Kubernetes cluster. The Controller Manager monitors the current state of your cluster through the API Server and makes appropriate changes to keep the application running by ensuring sufficient Pods are in a healthy state. For more information, see Controllers from Kubernetes documentation.
Important: We do not support Kubernetes Controller Manager monitoring for managed services like OpenShift, Amazon Elastic Kubernetes Service (EKS), Google Kubernetes Engine (GKE), and Azure Kubernetes Service (AKS) because they do not expose the Kubernetes Control Plane components.
Requirements for Monitoring Controller Manager
Ensure you have the Kubernetes_Controller_Manager datasource enabled.
Note: This is a multi-instance datasource, with each instance indicating a Controller Manager. This datasource is available for download from LM Exchange.
Setting up Kubernetes Controller Manager Monitoring
Installation
You do not need separate installation on your server to use the Kubernetes Controller Manager.
Depending on your preference, you can install LM Containers with the following two options:
- Installing through the user interface. For more information, see Installing the LM Container Helm Chart.
- Installing through the command line interface. For more information, see Installing LM Container Chart using CLI.
Configuration
The Kubernetes Controller Manager is pre-configured for monitoring. If you do not see any data for the Kubernetes Controller Manager resource, do the following:
- In your system, enter /etc/kubernetes/manifests in the terminal.
- Open the kube-controller-manager.yaml file for updating.
- In kube-controller-manager Pod under kube-system namespace, change the –bind-address at .spec.containers.command from 127.0.0.1 to <Value of status.podIP present on kube-controller-manager pod>.
Note: Run the kubectl get pod -n kube-system -o yaml | grep “podIP” command to get the value of status.podIP present on kube-controller-manager pod .
- Save the kube-controller-manager.yaml file.
Note: If –bind-address is missing, the scheduler continues to run with its default value 0.0.0.0.
For monitoring custom controlled managers, do as follows:
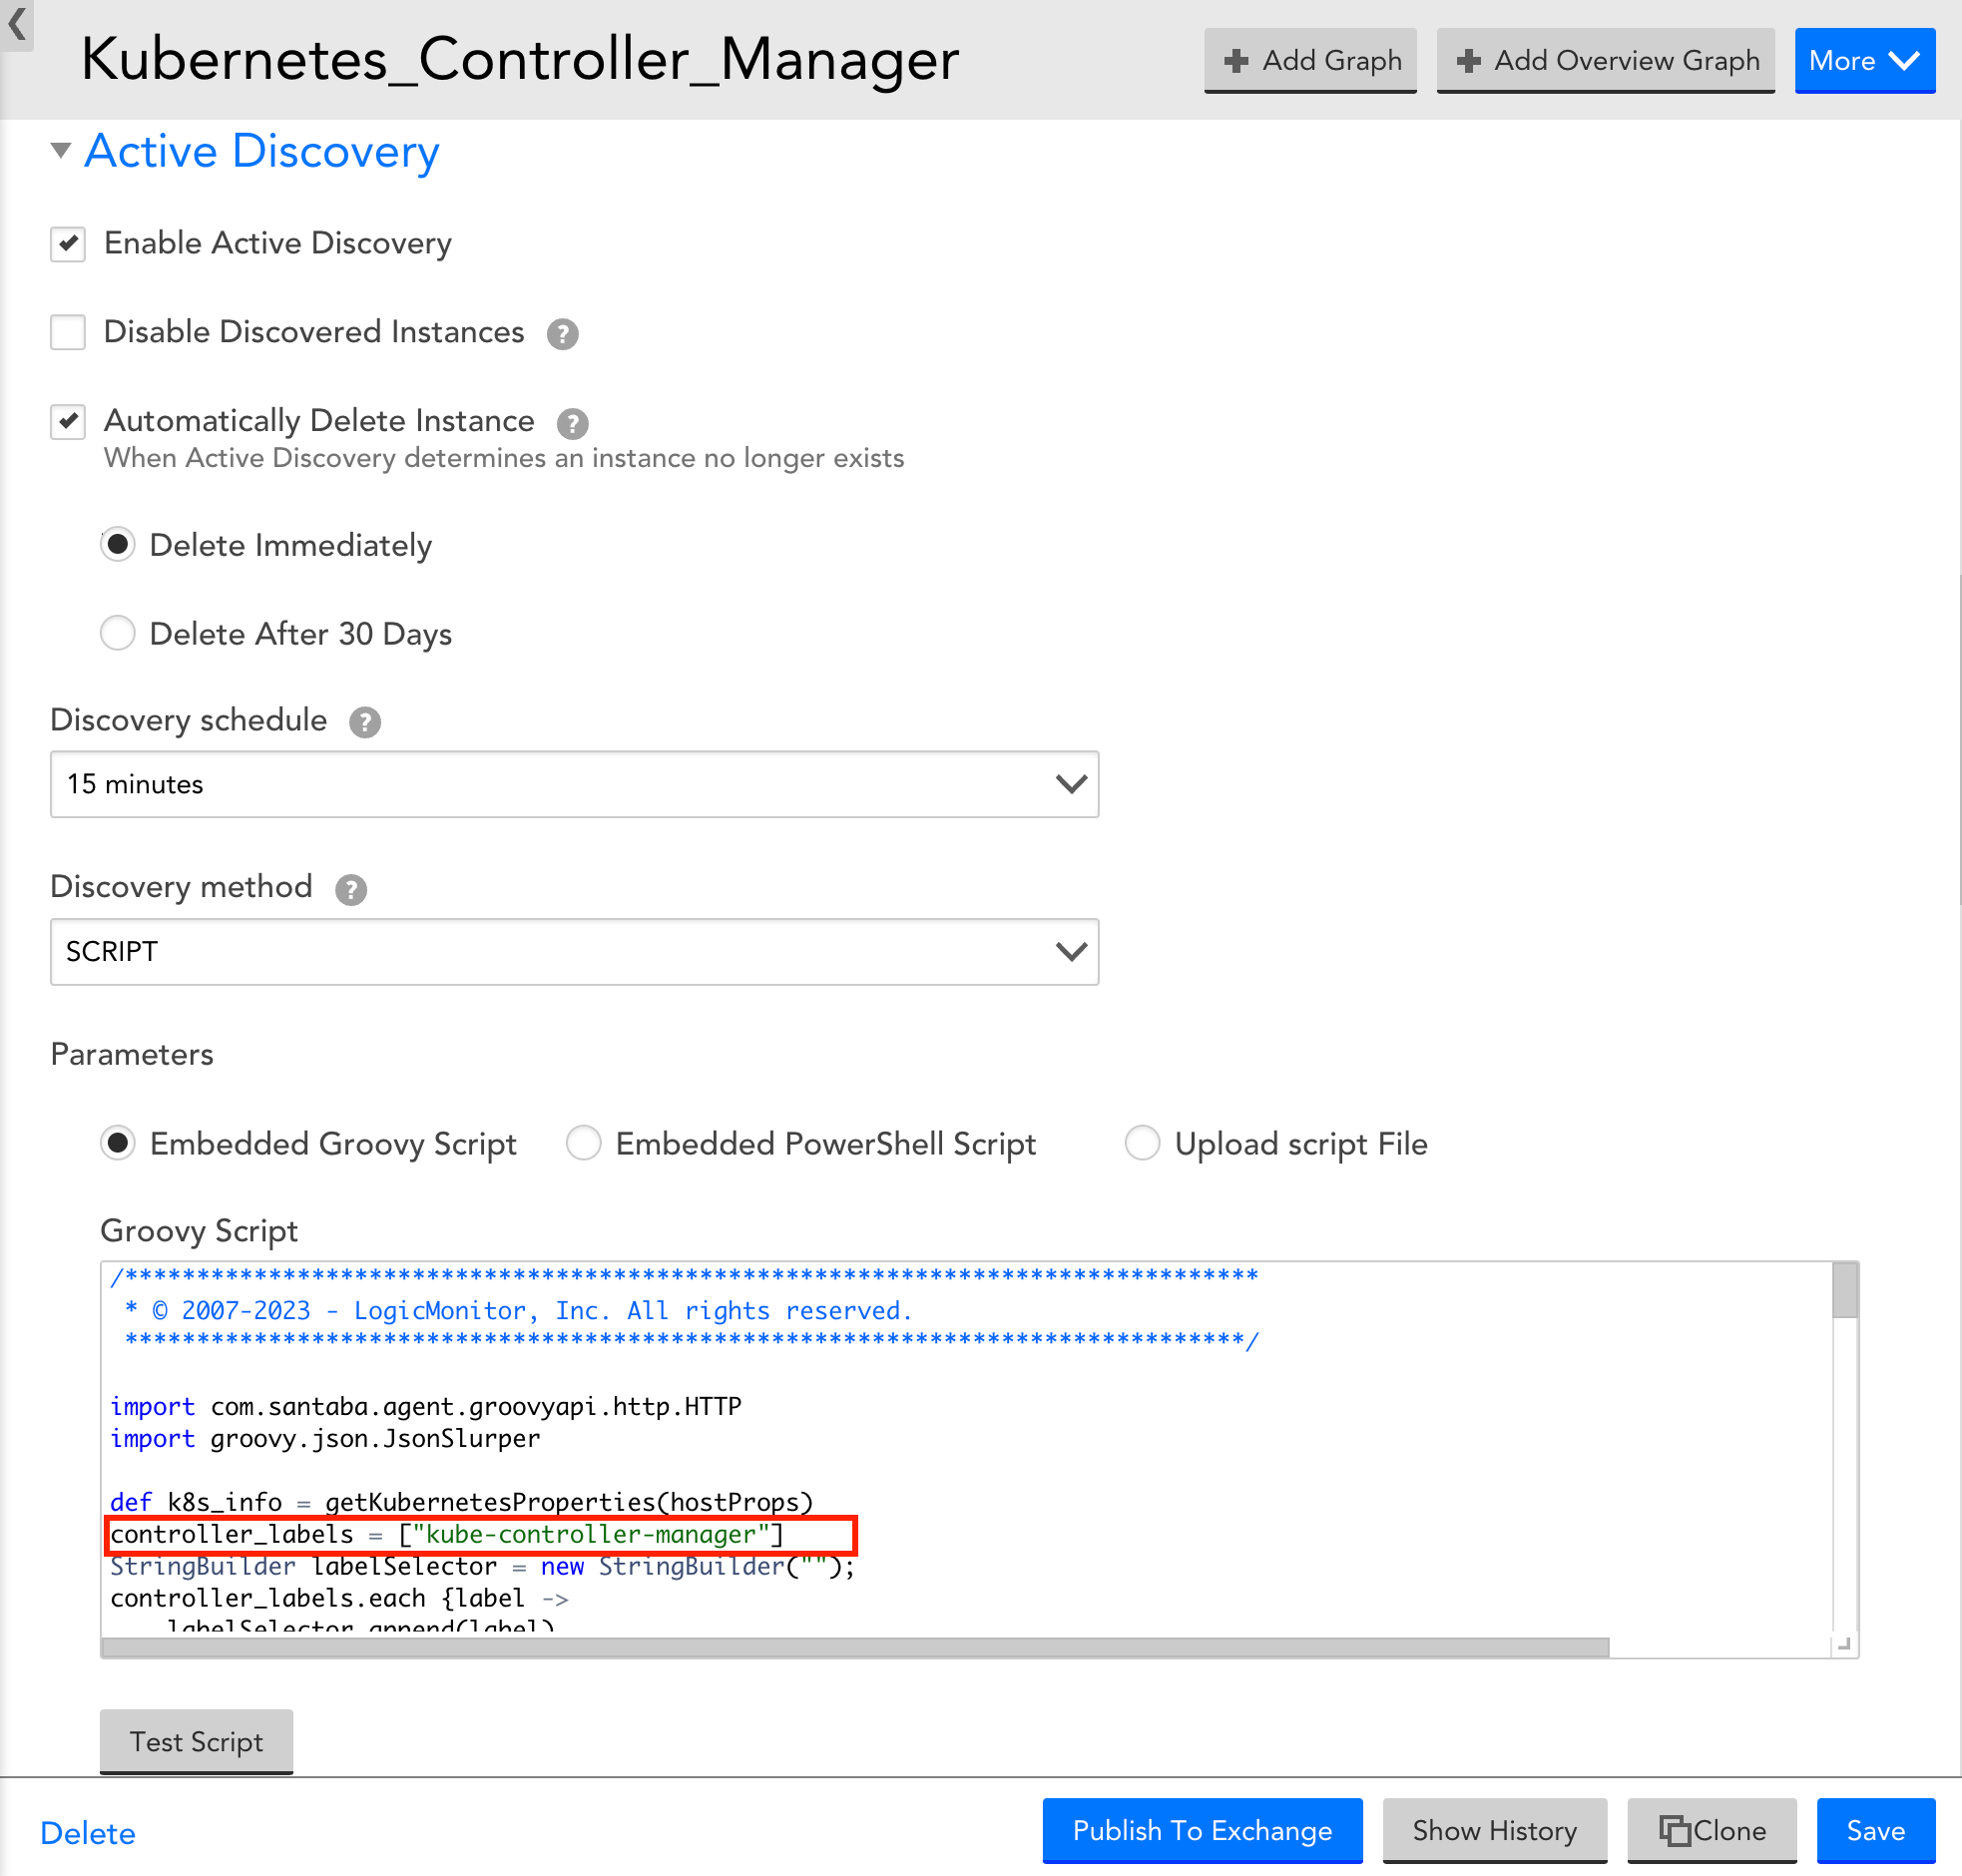
- In LogicMonitor, navigate to Settings > DataSources > select Kubernetes Controller Manager DataSource.
- In the Kubernetes Controller Manager DataSource page, expand Active Discovery.
- In the Parameters section, select the Embedded Groovy Script option.
- In the Groovy Script field, enter the required component name for the controller_label array.
- Expand Collector Attributes and in the Groovy Script field, enter the required component name for the controller_label array.
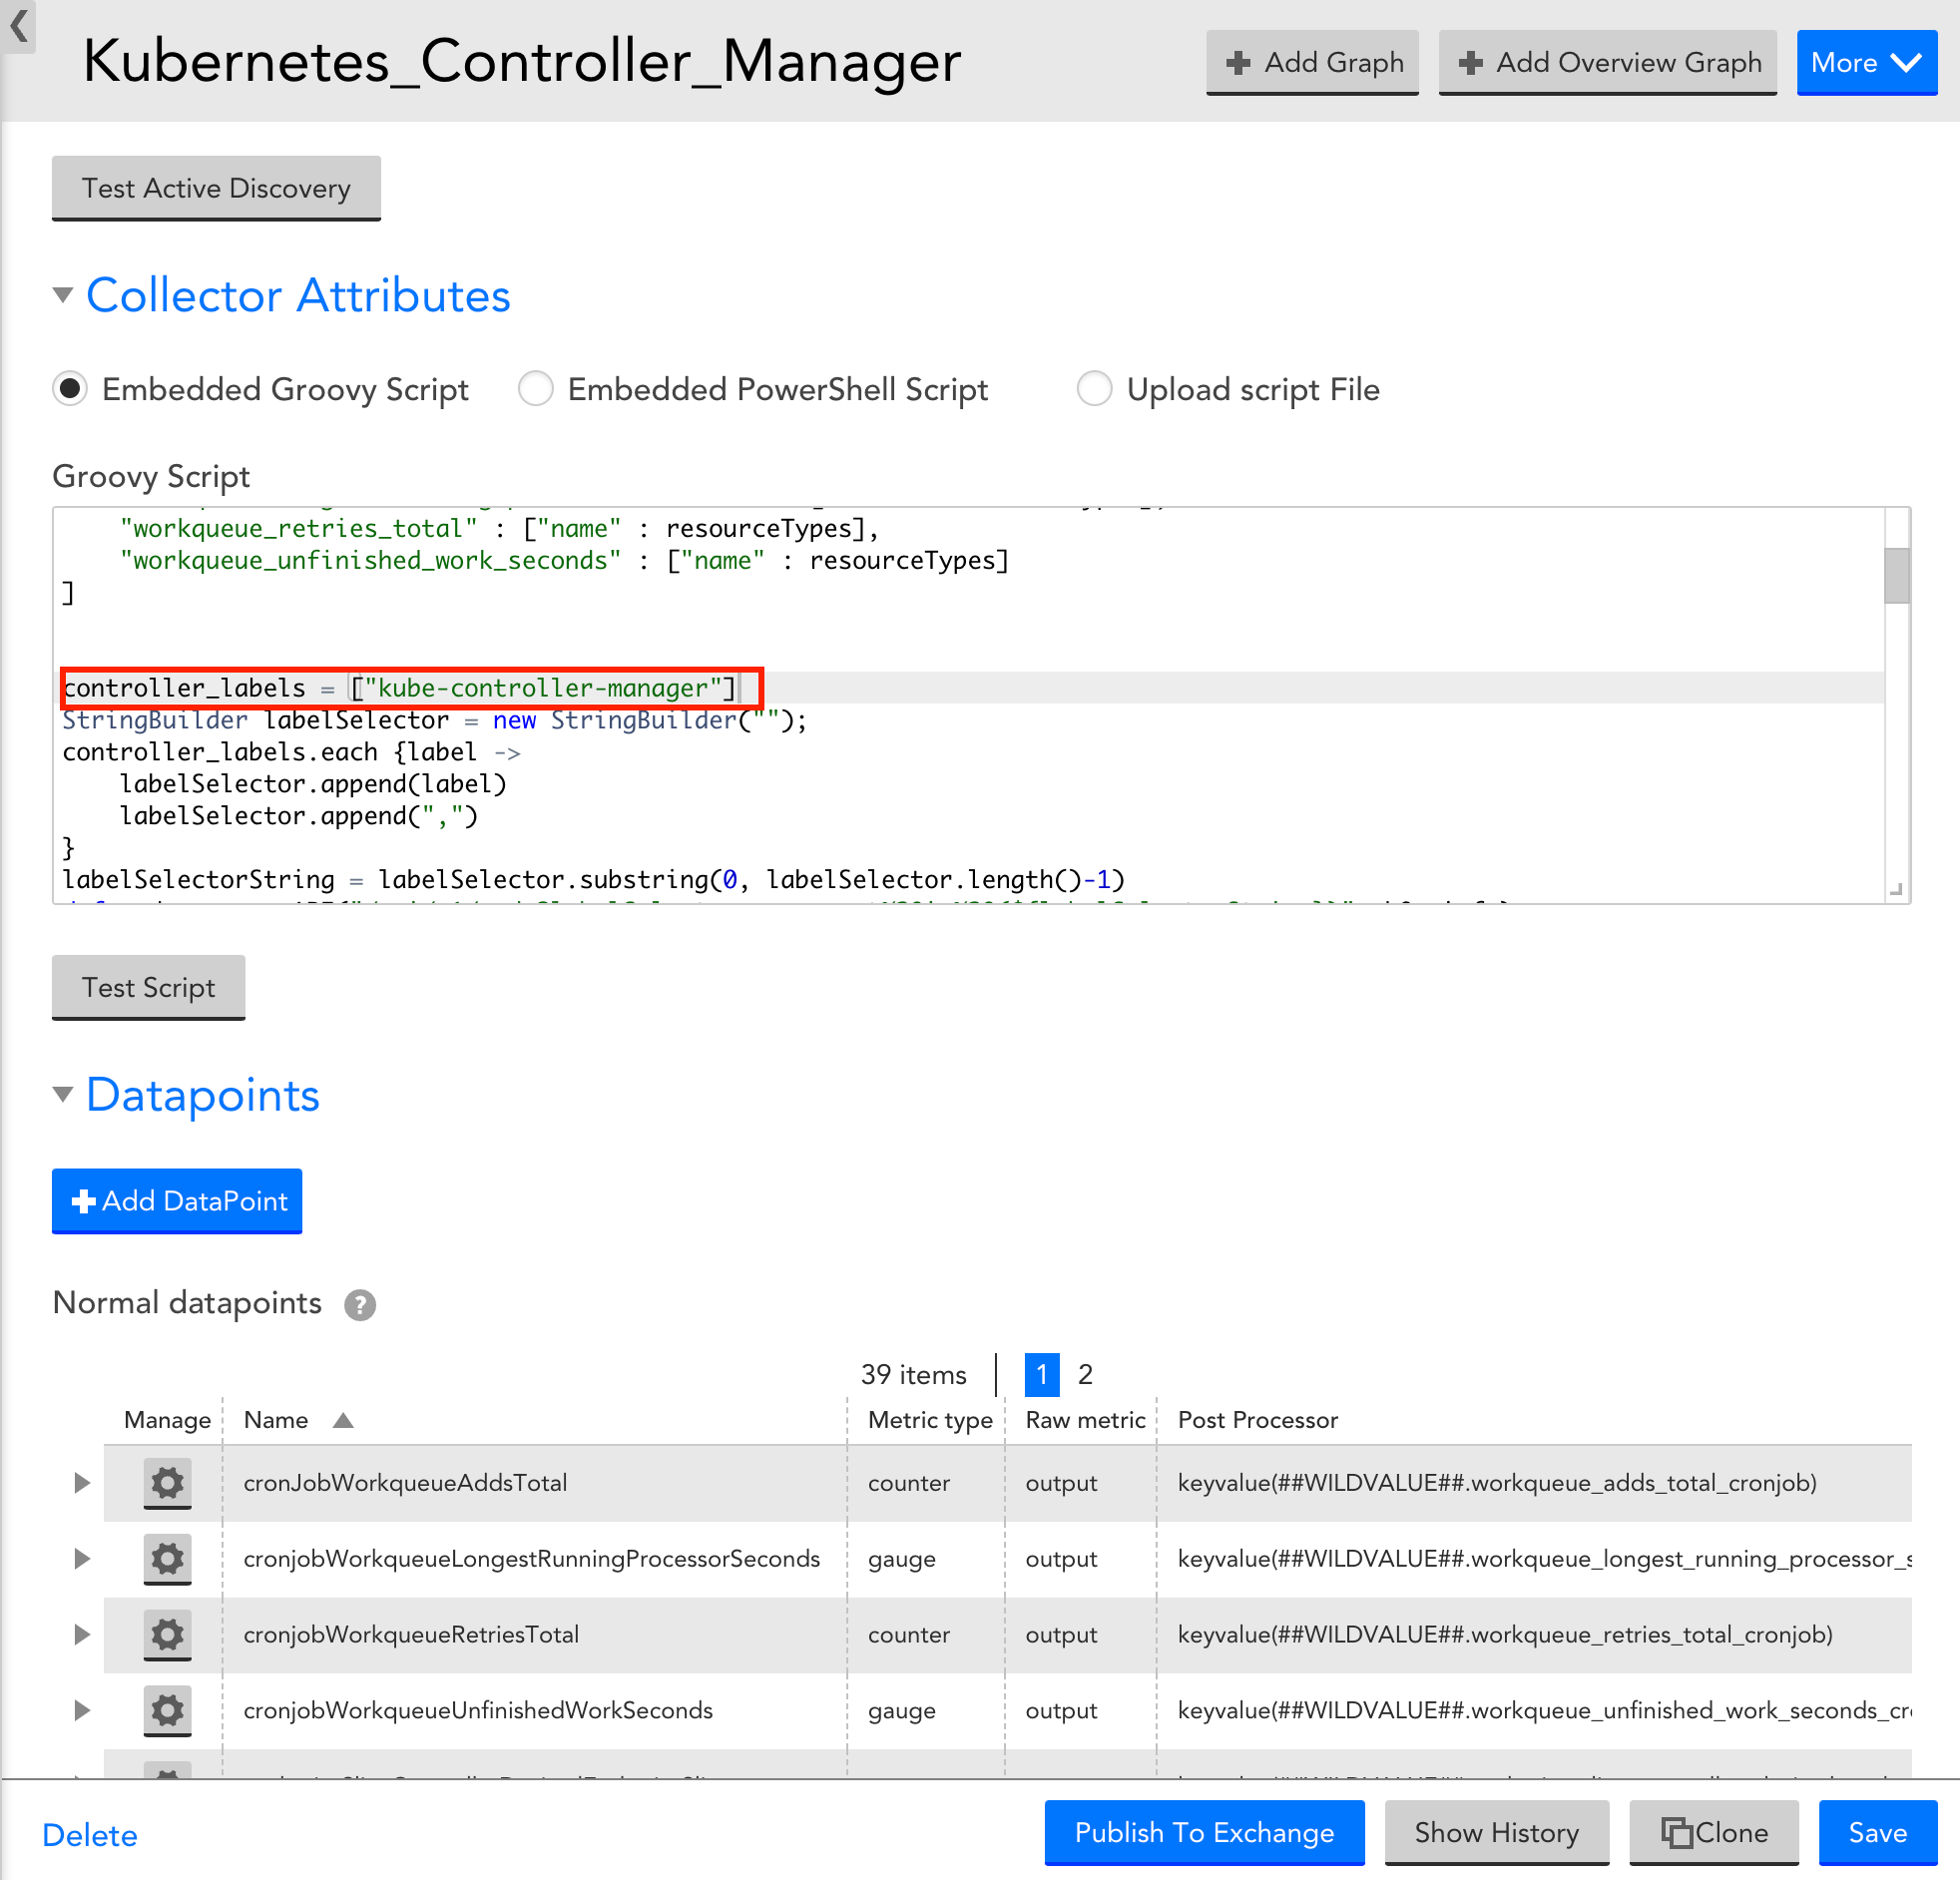
- Select Save to save the Kubernetes Controller Manager DataSource.
Viewing Kubernetes Controller Manager Details
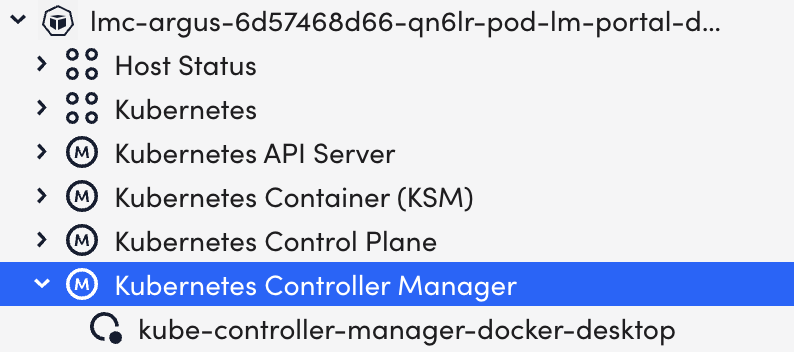
Once you have installed and configured the Kubernetes Controller Manager on your server, you can view all the relevant data on the Resources page.
- In LogicMonitor, navigate to Resources > select the required Kubernetes Controller Manager resource.
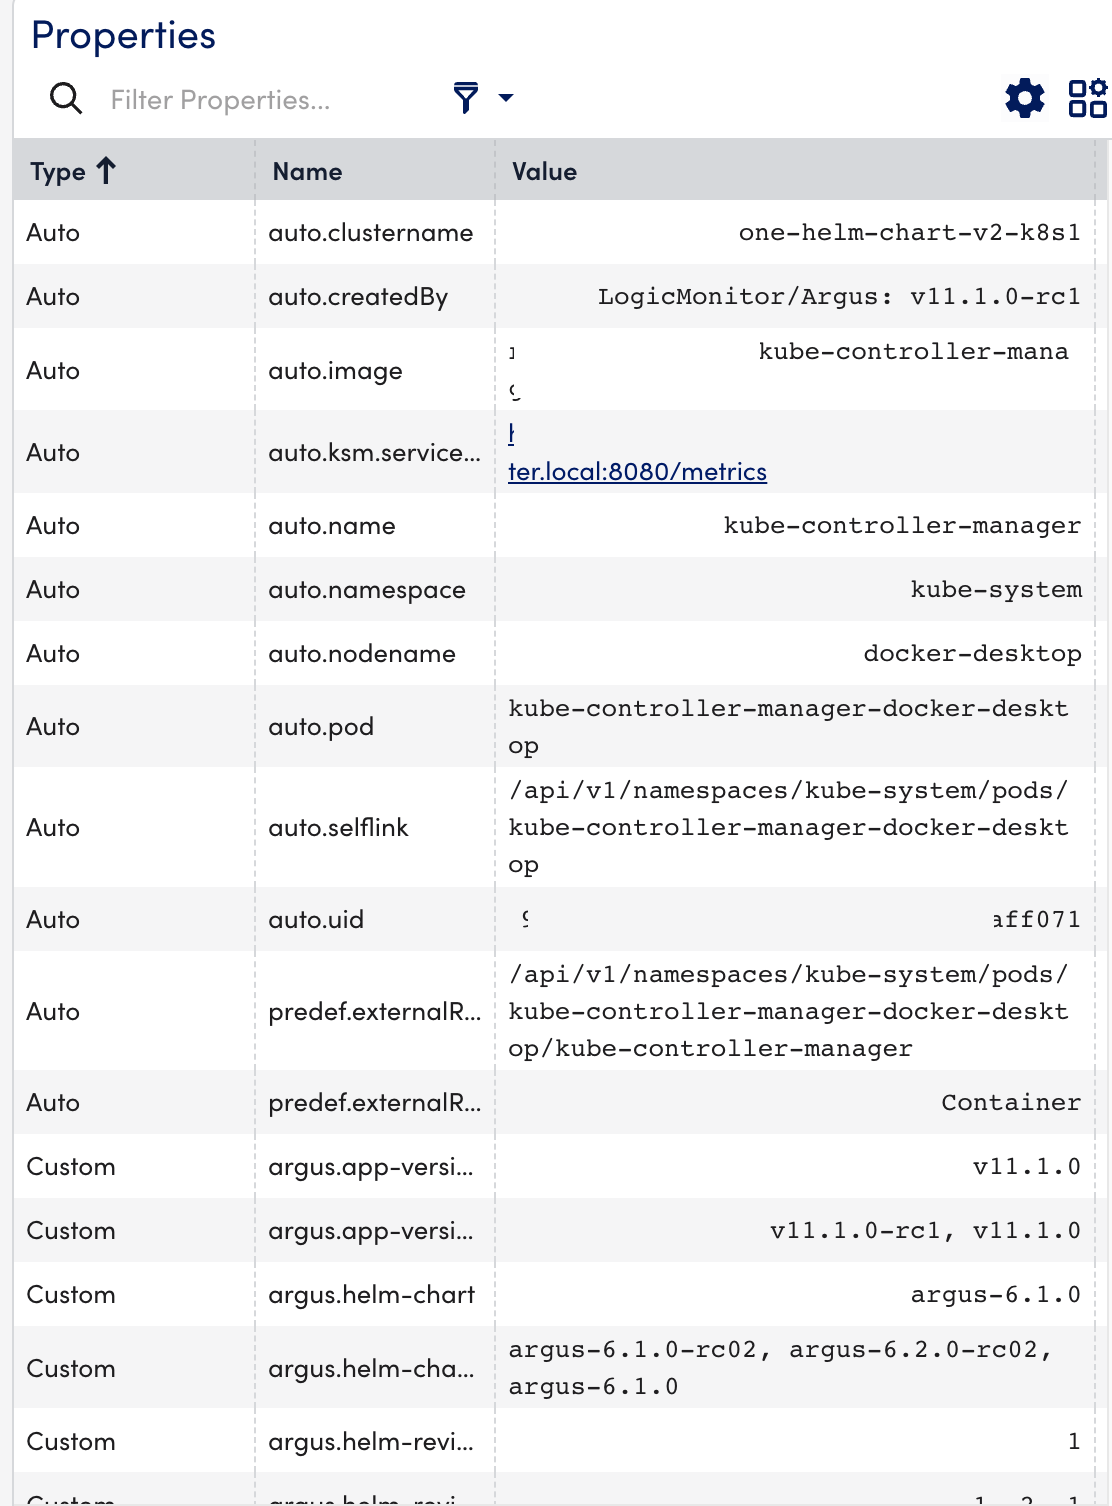
- Select the Info tab to view the different properties of the Kubernetes Controller Manager.
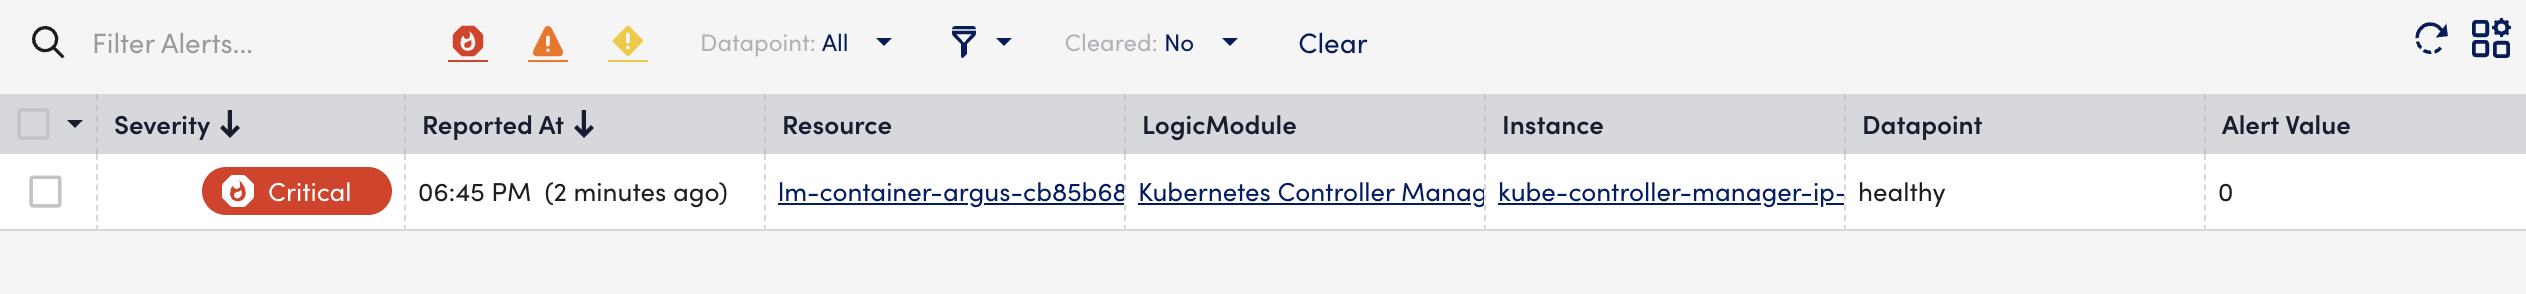
- Select the Alerts tab to view the alerts generated while checking the status of the Kubernetes Controller Manager resource.
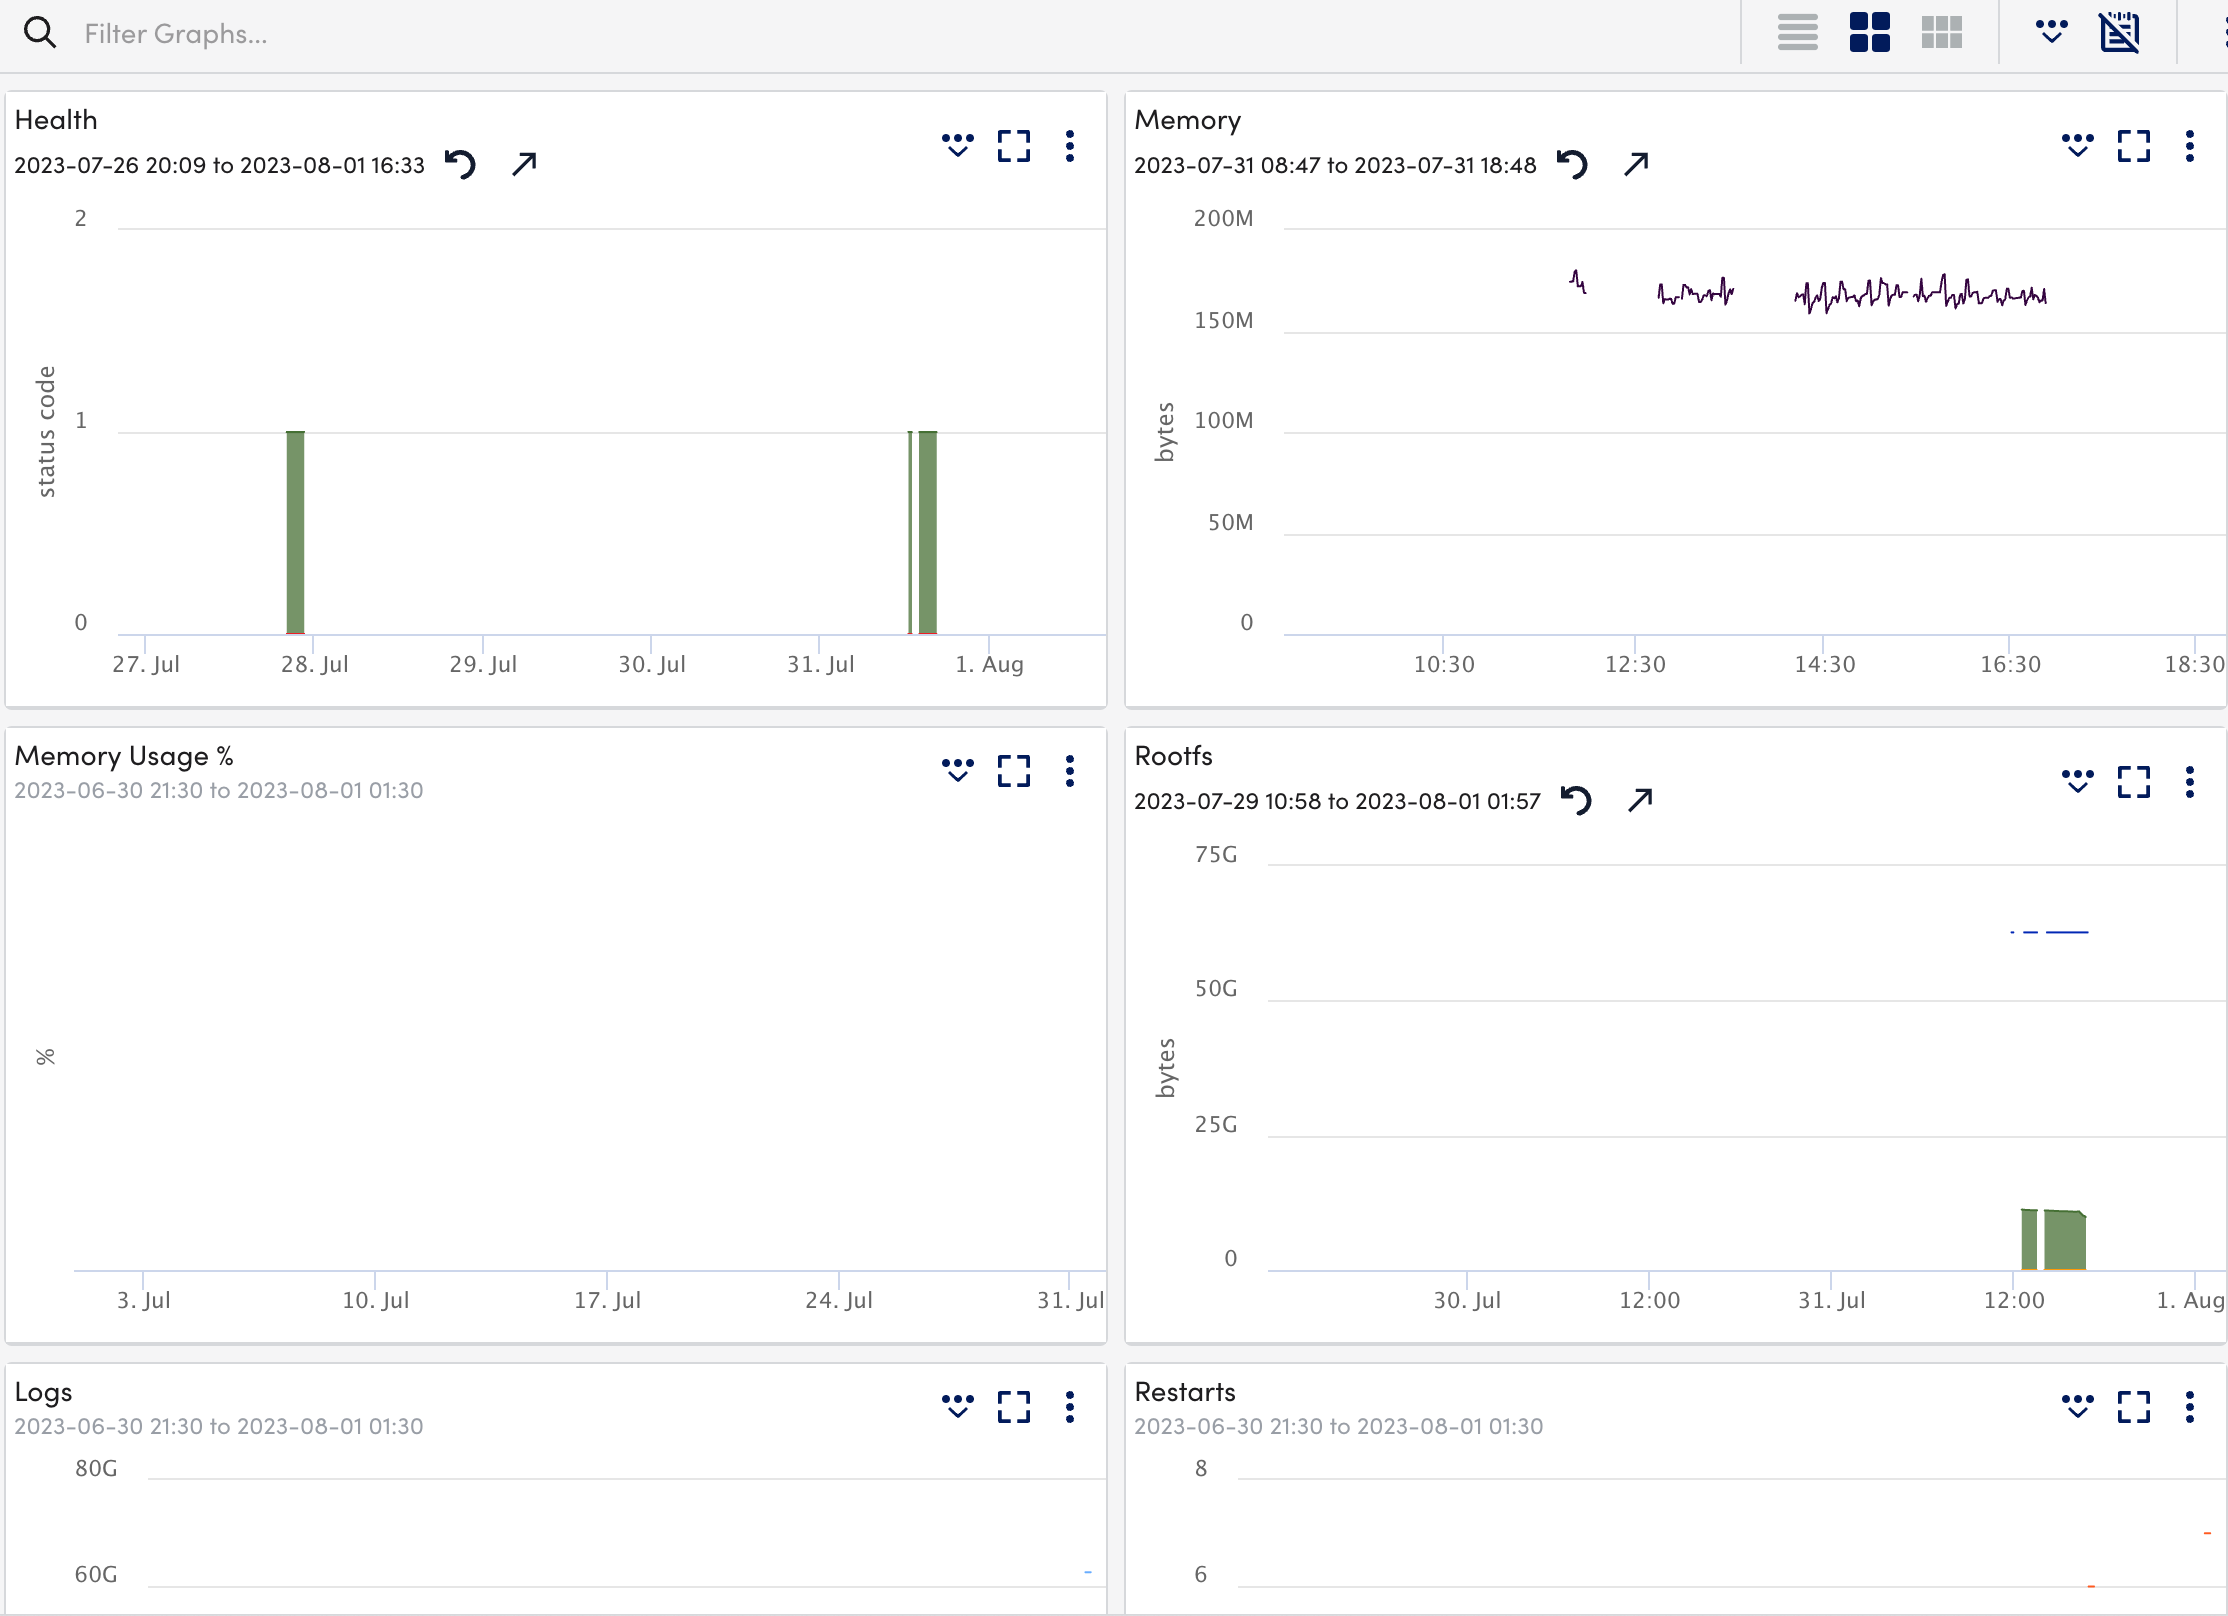
- Select the Graphs tab to view the status or the details of the Kubernetes Controller Manager in the graphical format.
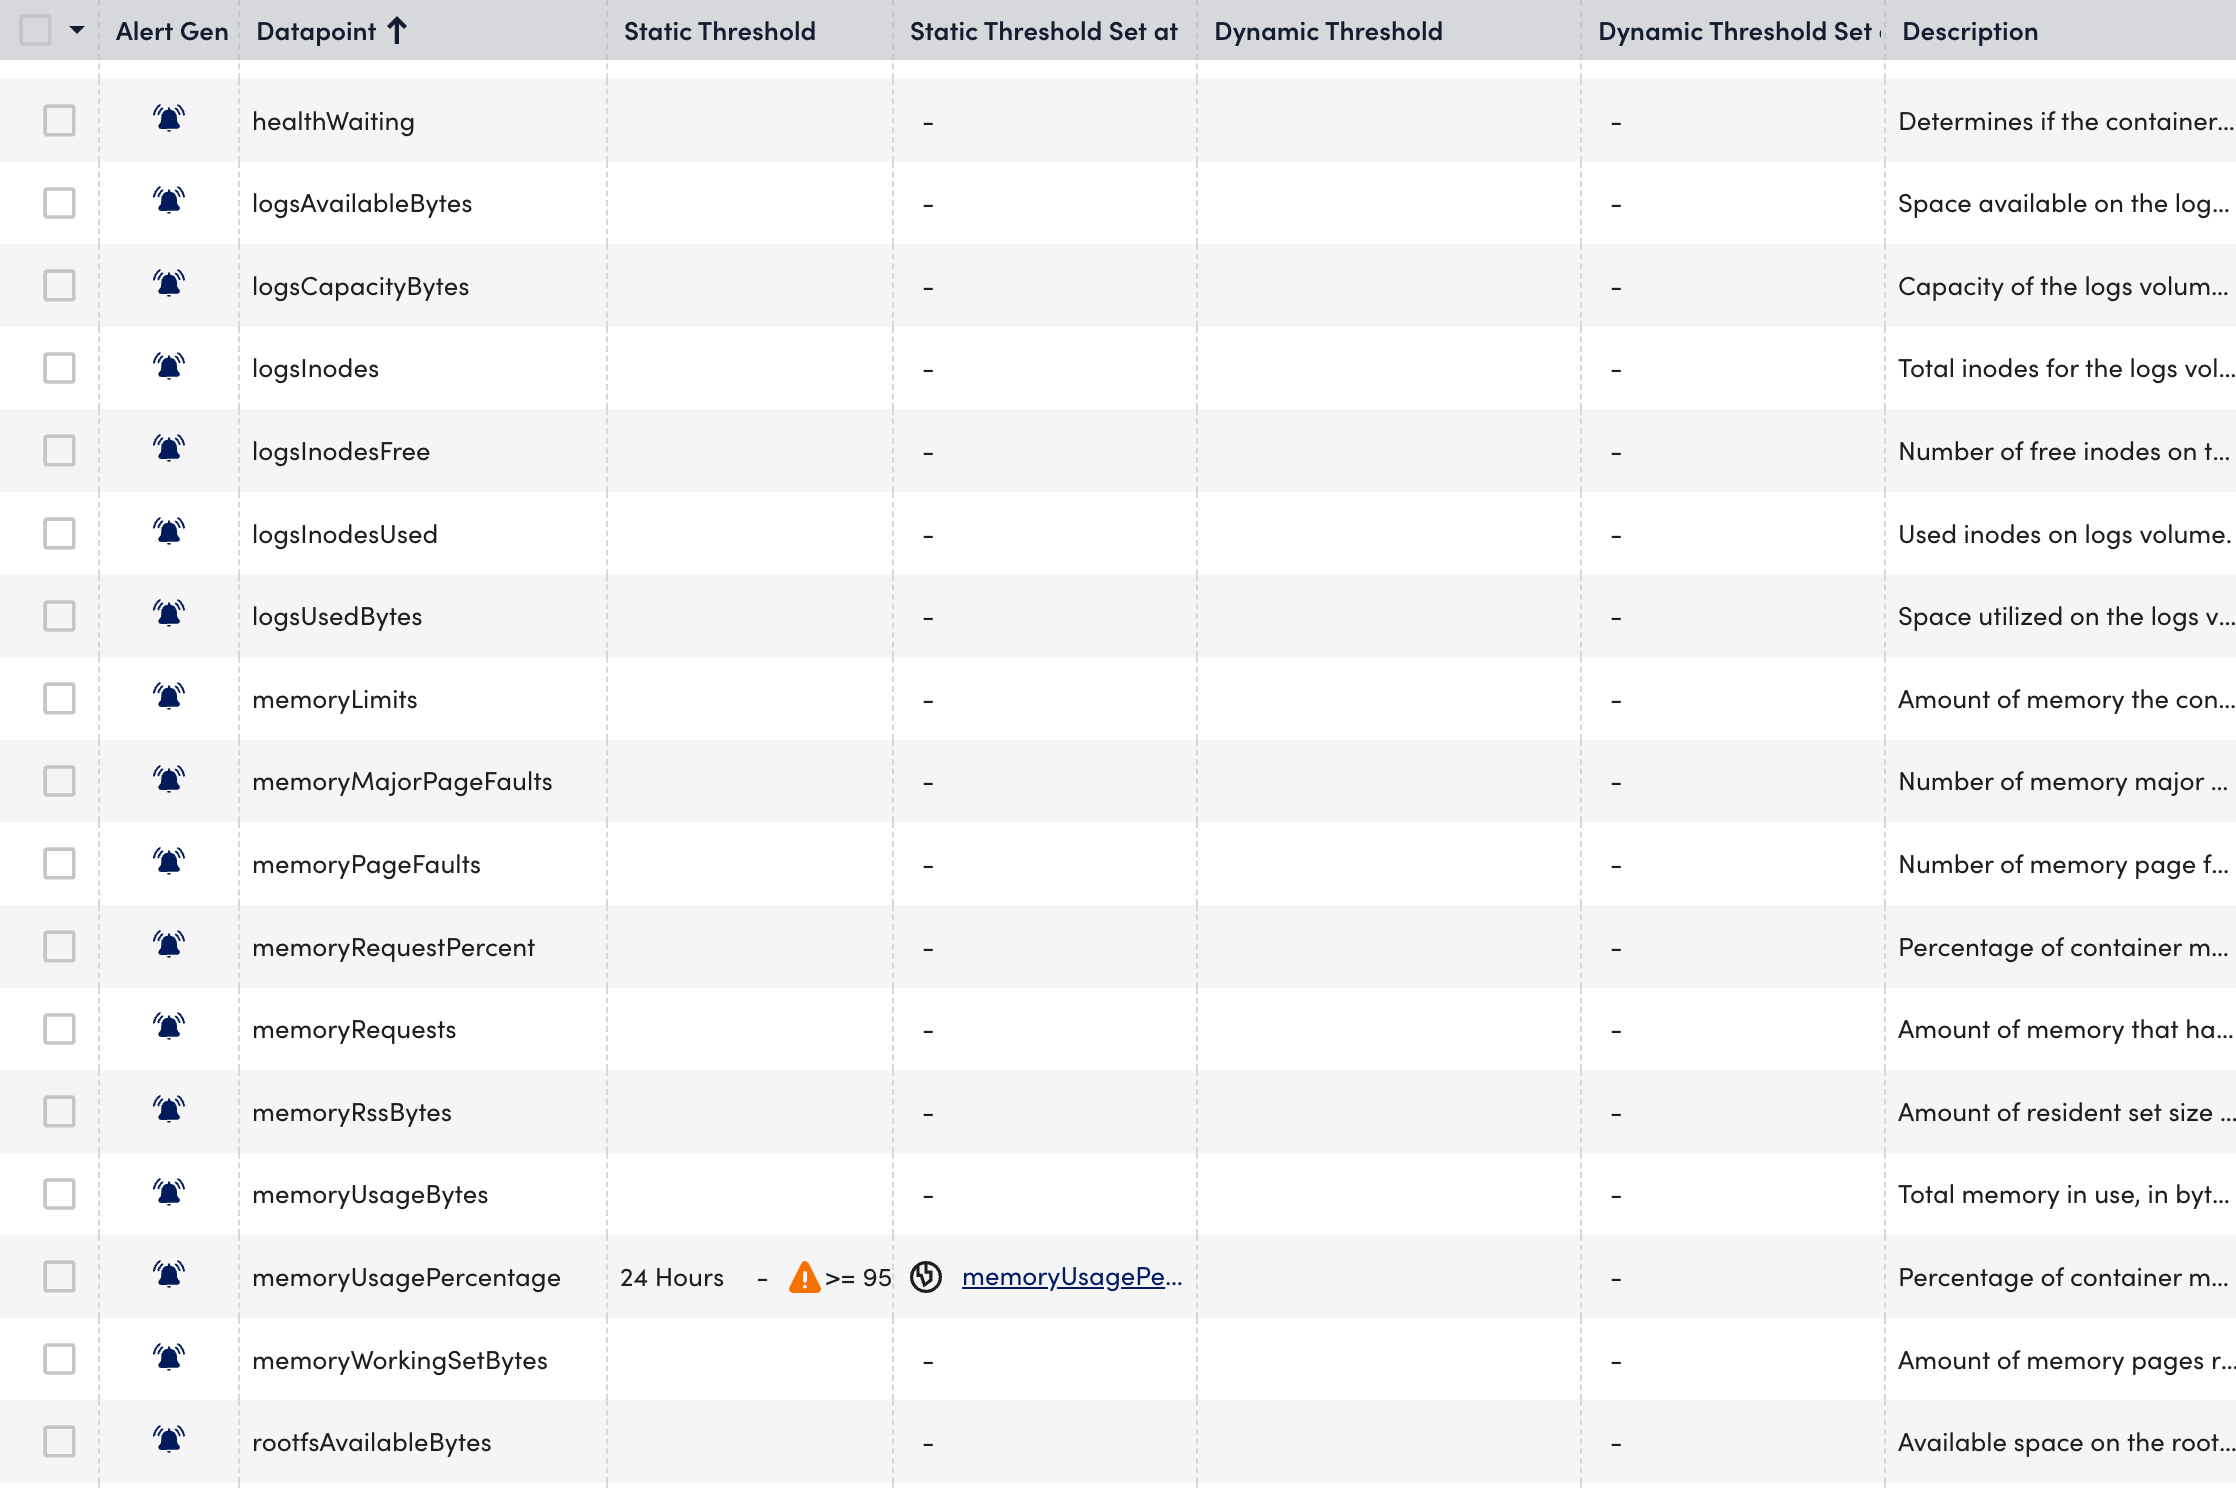
- Select the Alert Tuning tab to view the datapoints on which the alerts are generated.
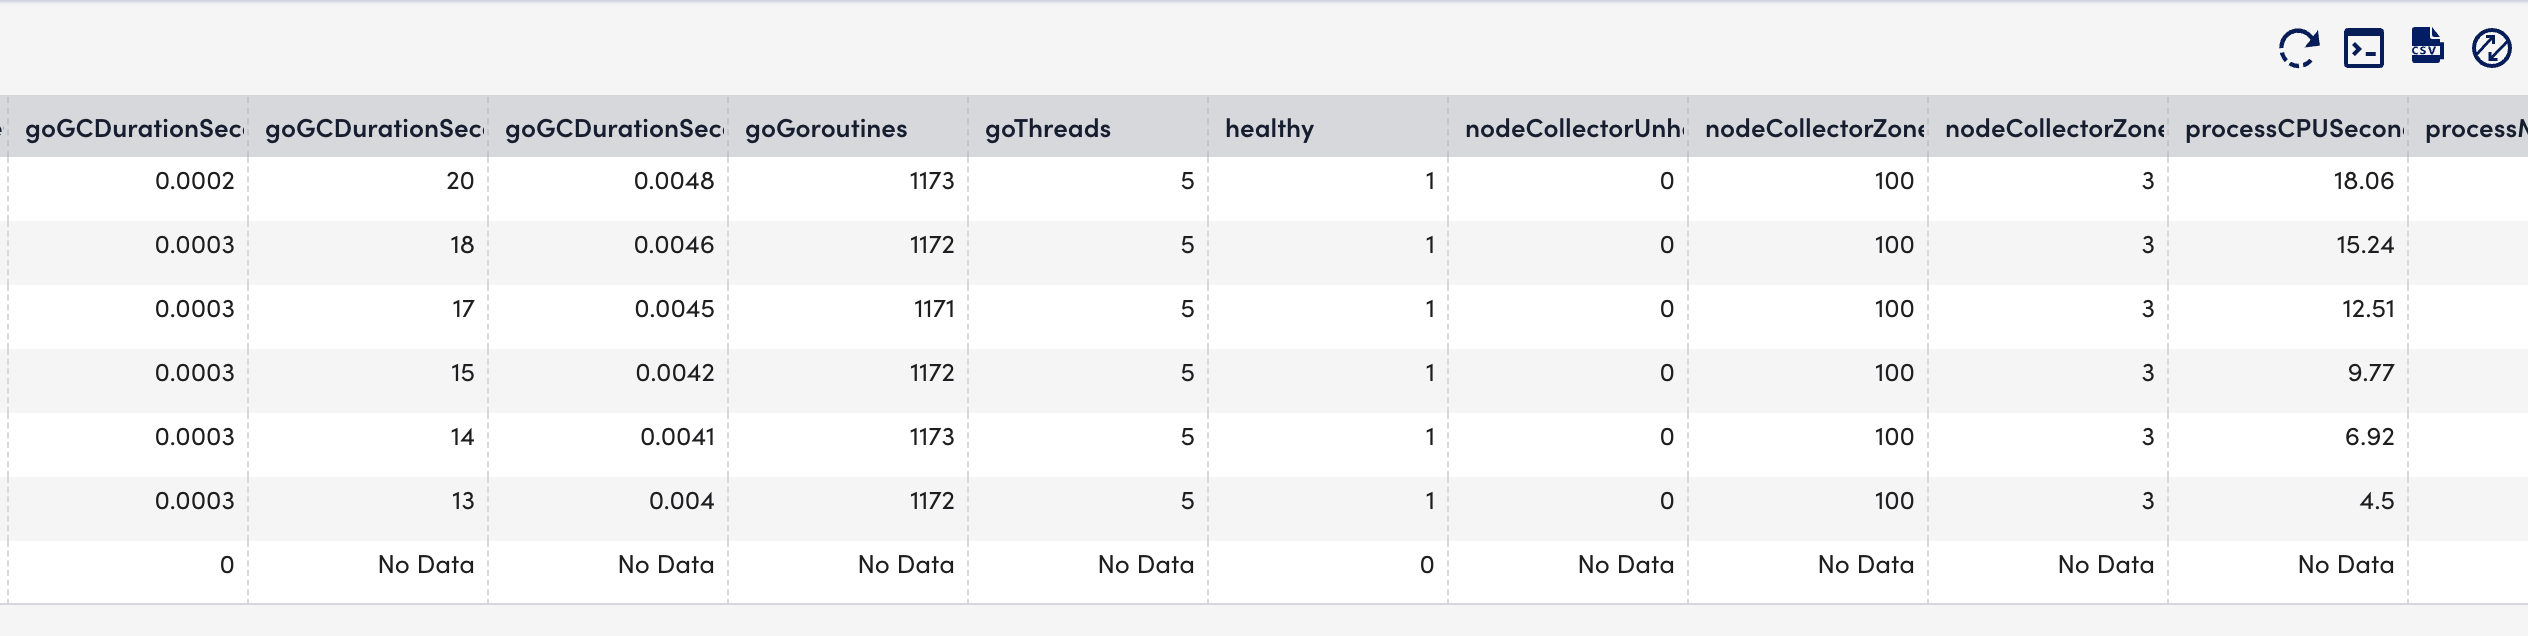
- Select the Raw Data tab to view all the data returned for the defined instances.