
Interface Bandwidth Report
Last updated - 26 March, 2026
The Interface Bandwidth report displays maximum and average values for interface inbound and outbound throughputs across multiple resources. The information is displayed as a table and can include a graph for each interface, allowing you to view multiple interface metrics across a group of devices.
Disclaimer: When generating the Interface Bandwidth report, only the following default DataSources are supported:
- snmp64_If-
- snmpIf-
- WinIf-
- snmp64_If_novlan
- snmp64_If_user_ports-
- SNMP_Network_Interfaces
Custom DataSources are not supported when generating the Interface Bandwidth report.
Configuring the Interface Bandwidth Report
- In LogicMonitor, navigate to Reports.
- Select
 > Add Report > select Add for the Interface Bandwidth report.
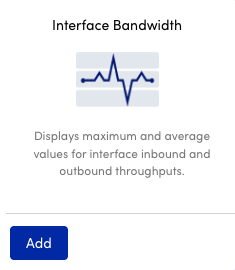
- In the Name field, enter a name for the report.
Report names cannot include the operators and comparison functions used in LogicMonitor’s datapoint expression syntax. - (Optional) In the Description field, enter a description for the report.
For example, you can enter a description of the specific purpose of the report. - From Report Group, select the report group where your report is stored.
Matching groups display as you type, and you can select the group from the list. - From Format, select the type of format for the output of the report.
You can select HTML, PDF, or CSV.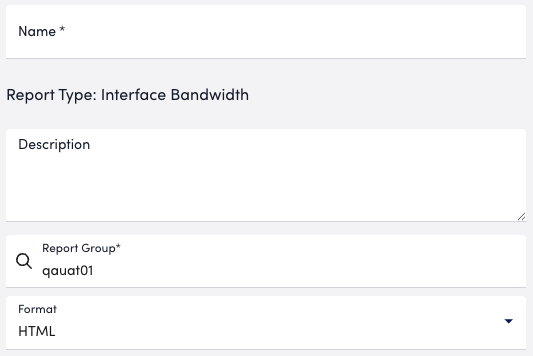
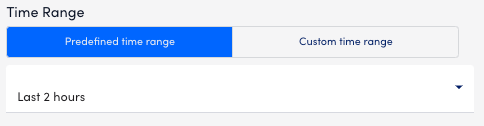
- In the Time Range section, do one of the following to configure the time range that you want the report to display information for:
- To configure a set time range, choose Predefined time range, and then select a time range.
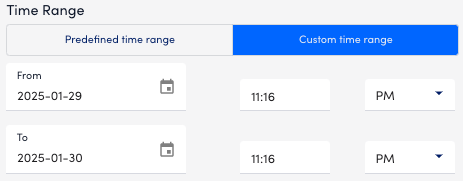
- To configure a custom time range, choose Custom time range, and then configure the following:
- Enter or choose a date in the From field, and then configure the settings to define the time you want the report to start at.
- Enter or choose a date in the To field, and then configure the settings to define the time you want the report to end at.
- To configure a set time range, choose Predefined time range, and then select a time range.
- Do one of the following to base the Interface Bandwidth report on resources or resource groups:
- To add a resource group, select Resource Group and enter the name of a resource group from the Resource Group field.
LogicMonitor attempts to match values as you type.
- To add a resource group, select Resource Group and enter the name of a resource group from the Resource Group field.
Note: You can select a combination of both glob and distinct values to specify your resources or resource groups. For more information, see Using Glob Expressions Throughout the LogicMonitor Portal.
- To add a resource, select Resource and enter the name of a resource from the Resources field. LogicMonitor attempts to match values as you type.
Note: You can select a combination of both glob and distinct values to specify your resources or resource groups. For more information, see Using Glob Expressions Throughout the LogicMonitor Portal.
- Indicate which DataSource to include in the report using the Datasource, Instance, and Description fields.

- Toggle the Scale by units of 1024 switch to change the scale of the graph.
By default, the graph is scaled by units of 1000. - To limit the number of results displayed in the report, select an option from the Number of results to display in report dropdown menu.
The report displays the number of DataSources you have defined based on the selected time range.
For example, if you defined an SNMP_Network_Interface DataSource for interfaceStatusorInErrorsand you select “Top 10,” your report displays the top 10 interfaces based onStatusorInErrors.Note: If “All” is selected, the report displays all available data based on the Resources or Resource Groups defined. - From the Report Format dropdown menu, select the format for how you want the report displayed.
- From the Percentile dropdown menu, select the percentile to capture the highest usage levels experienced during the peak traffic hours.
For example, if you select the 95th percentile, it provides a reliable metric for evaluating your network’s bandwidth performance, capturing the highest usage levels experienced during the top 5% of peak traffic periods. This helps distinguish between typical traffic patterns and temporary fluctuations. - From the Data Format dropdown menu, select the format to convert the data into.
By default, the data format is set to Bits.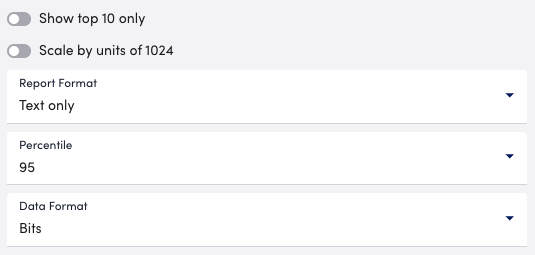
- In Report Schedule settings, do the following to configure the report to generate on a schedule:
- Toggle the Generate this report on a schedule switch.
- From Frequency, select how frequent you want the report to generate, and then configure when you want the report to generate.
For example, if you configure the report to generate daily, you can choose the time to generate the report each day. If you configure the report to generate weekly, you can choose the day of the week and time to generate the report for the selected date. If you configure the report to generate monthly, you can configure the day of the month and time to generate the report.
Each frequency option provides you a setting for selecting the time zone. - In Recipients Email, enter the name of the user you want to receive the generated report. You can also add recipient groups.
You can enter as many users as needed.
LogicMonitor attempts to match values as you type.
The recipients you add to the report are emailed a generated report based on the format you configured and the email associated with the username.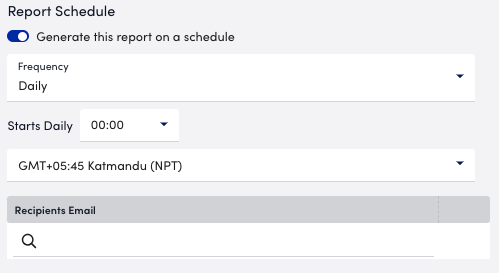
- Do one of the following to save the report:
- Select Save.
The report saves to the Report Group you selected.
If you configured the report to generate on a schedule, the report generates and sends to recipients based on the frequency you configured. - Select Save and Run.
The report saves to the Report Group you selected and generates a report based on the format you configured.
If you configured the report to generate on a schedule, the report generates and sends to recipients based on the frequency you configured.
- Select Save.
Threshold Limits for Interface Bandwidth Report
Note: For ad-hoc reports, you must select the maximum date range as less than or equal to last month. If you require a date range more than the previous month, you must schedule the required reports.
Adhoc Requests Thresholds (Limit for number of graphs)
| CSV | HTML | |
| 250 | 120 |
Scheduled Requests Thresholds
| CSV | HTML | |
| 600 | 600 |
Adhoc Requests Thresholds (Limit for number of instances)
| CSV | HTML | |
| 500 | 4200 | 3700 |
Scheduled Requests Thresholds
| CSV | HTML | |
| 19900 | 5000 | 5000 |
