
Installing Argus and Collectorset-Controller
Last updated - 14 March, 2022
Disclaimer: Argus and Collectorset-Controller Helm Charts are being phased out. For more information to switching to the new LM Container Helm Chart for a simpler install and upgrade experience, see Migrating Existing Kubernetes Clusters Using LM Container Helm Chart.
Argus is a tool for monitoring Kubernetes with LogicMonitor. Argus runs as a Pod in your cluster and uses LogicMonitor’s API to add Nodes, Pods, Services, and resources into monitoring. Once in monitoring, data collection starts automatically. Argus uses Kubernetes API to collect data for all monitored resources. Additionally, you can leverage LogicMonitor DataSources to monitor your applications running within the cluster.
Argus offers the following key features for Kubernetes monitoring:
- Automated Resource Discovery: Argus leverages Kubernetes events and LogicMonitor’s API to provide real-time accuracy of the resources of a cluster in LogicMonitor. With Argus, you can discover etcd members, cluster Nodes, Services, Pods, and resources. You can also automate the management of their lifecycle as Resources in LogicMonitor.
- Comprehensive Monitoring: Argus manages the Dockerized LogicMonitor Collectors running in a StatefulSet and collects data via the Kubernetes API for Nodes, Pods, Services, Containers, and resources.
You can install Argus either by using the command-line interface (CLI) or from your LogicMonitor portal.
Requirements
To install Argus, you need the following:
- Helm 3
- Kubernetes v1.14 or later
- Add LogicMonitor chart repository:
$ helm repo add logicmonitor https://logicmonitor.github.io/k8s-helm-charts - Ensure to install the LogicMonitor Collectorset-controller before installing Argus. For more information, see Installing Collectorset-controller.
- Refer to the Configuration templates of Helm charts values.yaml. to select compatible versions of the Collectorset-controller and Argus binaries.
Installing Collectorset-Controller
A Collectorset-Controller automatically installs and manages the LogicMonitor’s Collectors based on the requirements added in the configurations file.
Requirements:
- Helm chart (refer to Configuration templates of Helm charts values.yaml)
- LogicMonitor account
1. Navigate to Resources > Add and select “Kubernetes Cluster”.
2. On the Add Kubernetes Cluster page, enter the required details and click Next.
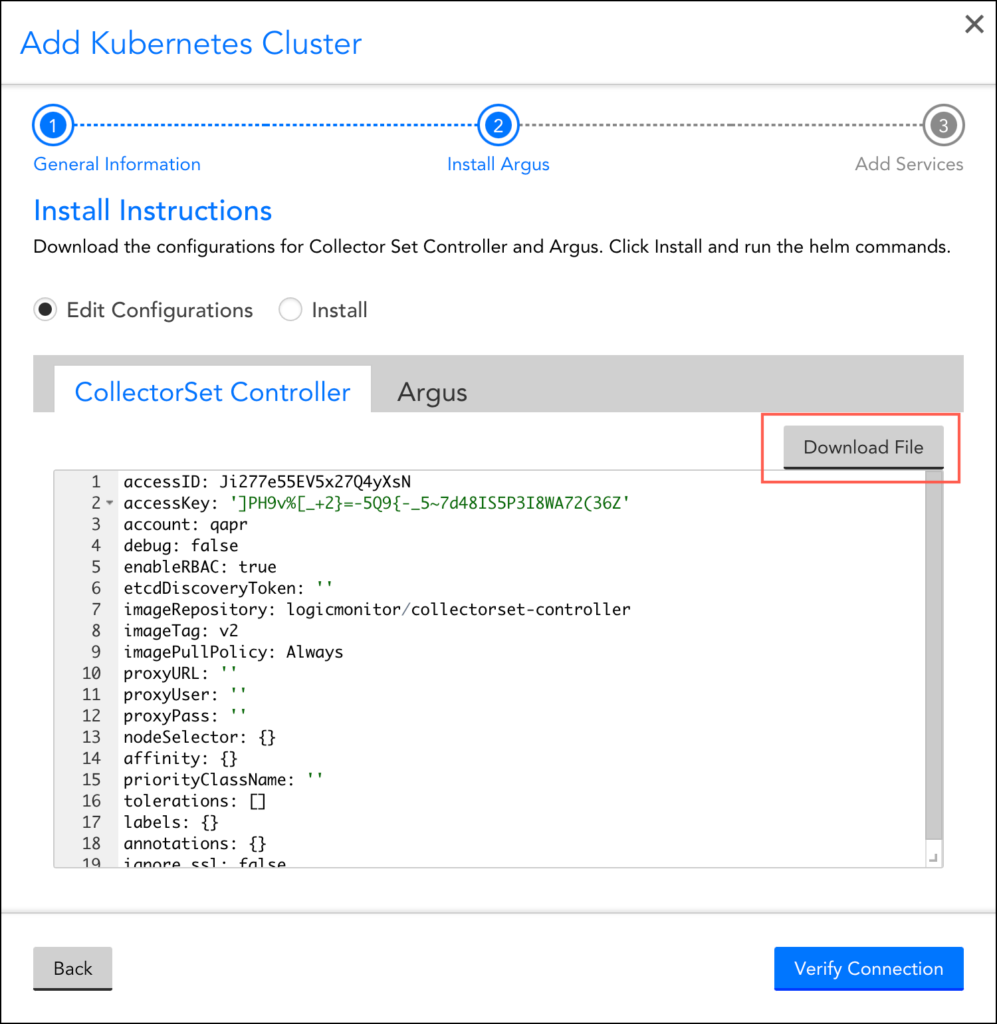
3. In the Install Argus section, select “Edit Configurations” to enter the required configuration details.
Note: You may click Download File, to edit the configuration file from your LogicMonitor portal, or you can create the file using the template.
4. Update the configuration parameters in the configuration file.
5. Export the configuration file path and enter the following helm command:
$ export COLLECTORSET_CONTROLLER_CONF_FILE=<collectorset-controller-configuration-file-path>
$ helm upgrade \
  --install \
  --debug \
  --wait \
  --namespace="$NAMESPACE" \
  -f "$COLLECTORSET_CONTROLLER_CONF_FILE" \
collectorset-controller logicmonitor/collectorset-controllerFor more information on the list of values and their descriptions used in the collectorset-controller configuration yaml file, see Default value from ArtifactHUB.
Installing Argus
The setup wizard provides the configuration and installation commands for the applications needed for monitoring CollectorSet-Controller and Argus.
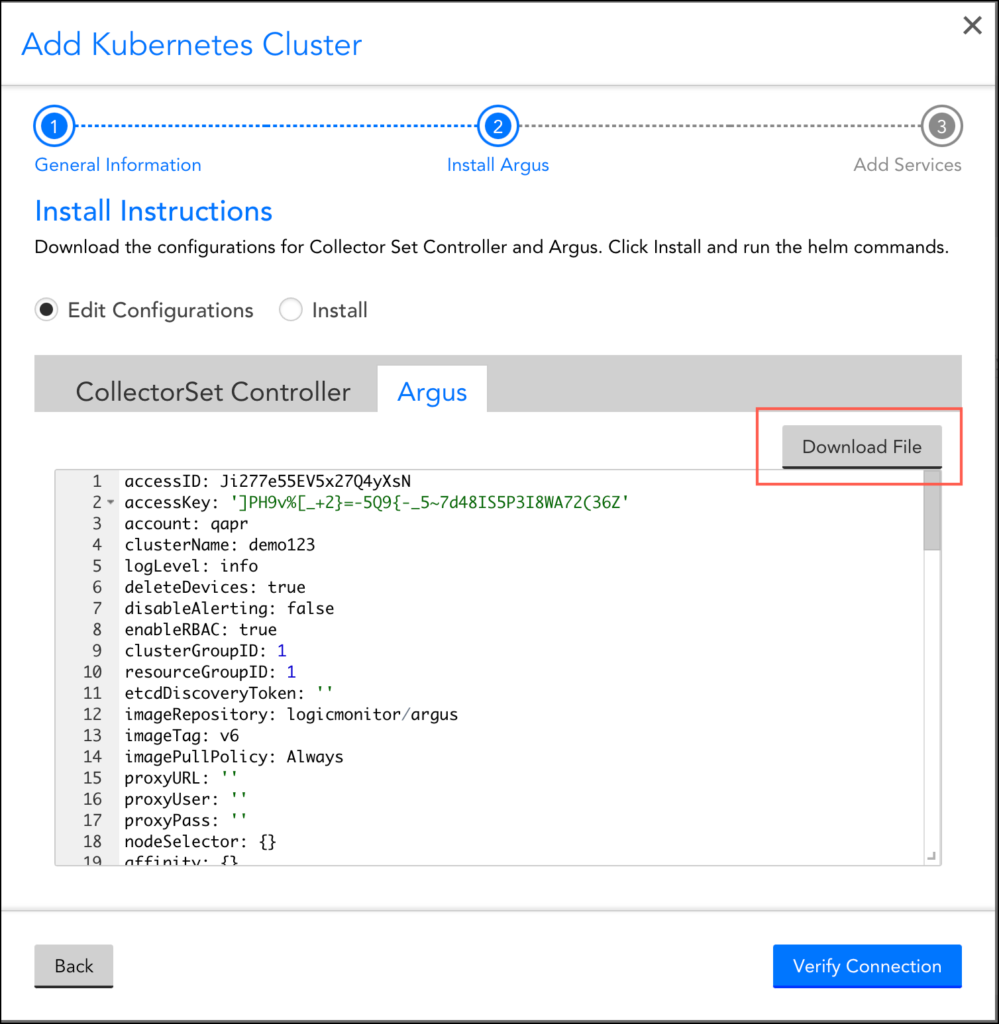
- From the setup wizard, select “Edit Configuration” to customize the YAML configuration files for the CollectorSet-Controller and Argus. For the complete list of configuration options, see Configurations.
Note: You can click Download File to edit the configuration and install them using the Kubernetes CLI.
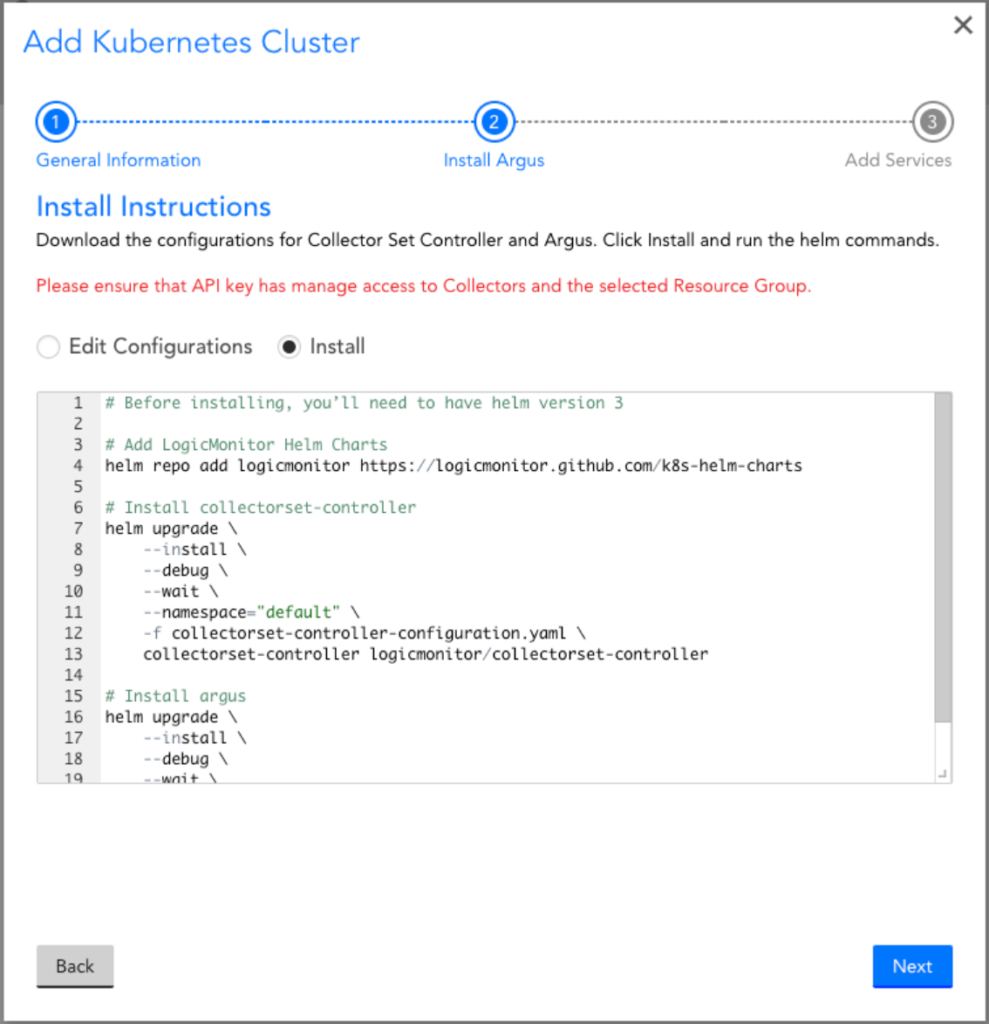
2. Select “Install” to see the Helm commands to install the CollectorSet-Controller and Argus and LogicMonitor’s Helm Charts. You can copy and paste the commands to install the integration into your cluster.
For more information on the list of values and their descriptions used in the argus configuration yaml file, see Default value from ArtifactHUB.
3. Click Verify Connection to ensure that the Collectors and the cluster resources were properly added into monitoring.
Note: The connection verification process may take up to a minute.
