
LogAlert
Last updated - 11 November, 2025
LogAlerts are triggered when specific patterns or keywords display in log data. To manage these alerts, use LogAlert Groups. A LogAlert Group defines how and where alerts are applied. LogAlert Group-related LogAlerts, similar to how folders or resource groups organize items in the Resource tree.
LogAlert Groups are typically structured by resource or resource group. This structure enables scalable and intuitive alert management. For example:
- Use a LogAlert group named “Cisco ASA” to group alerts related to firewall logs.
- Use “Domain Controllers – East Region” to apply alerts to domain controllers in a specific geographic region.
Each LogAlert Group targets a specific set of Resources or Resource groups. The LogAlerts within the LogAlert Group define when alerts are triggered, such as when a log message contains a specific keyword or matches a pattern.
LogAlerts are based on log queries that match specific conditions in ingested logs. These matches can be based on a keyword, string, key-value pair, or a regular expression (regex) pattern. When a match occurs, LogicMonitor triggers an alert and sends a notification to inform users about the log event or anomaly.
With LogAlerts, you can speed up your investigation by adding LogAlerts to track the logs you always want to know about or creating alerts on a detected anomaly.

Viewing LogAlerts
On the Logs page, select the LogAlerts group icon to open the LogAlert page, where you can review and manage alerts.
- Severity—Displays the level (Critical, Error, Warning) configured for the alert.
- Display As—Shows the configured display name of the alert.
- Logs query—Displays the regular expression pattern to match log events that will trigger the alert.
- LogAlert type—Displays the type of alert, such as basic or stateful alert.
- LogAlert Group—Displays the LogAlert Group that the alert applies to.
- Description—Provides a short explanation of the alert.
- Active—Lets you toggle the alert on and off.
- Filter— alerts by a specific LogAlert Group.
Considerations for LogAlert
- Alert rate limit—Each LogAlert Group can generate up to 90 alerts per minute. Alerts that exceed this rate are dropped and not processed.
- LogAlert Group limits—Each portal supports up to 20 log LogAlert Groups.
- Per-LogAlert Group Alert limits—Each LogAlert Group supports up to 55 log alerts, which include:
- Time-Based LogAlert—Up to 10 time-based alerts per LogAlert Group can be created. Time-based alerts are generated when at least one log matches a defined condition within a selected time window (10 min, 30 min, 1 hr, 8 hrs, or 1 day).
- Stateful LogAlert—Up to 10 stateful alerts per LogAlert Group can be created.
Note: Time period–based alerts and stateful alerts cannot be combined in the same log alert. Only Basic alert types support time-based trigger options.
Adding LogAlerts
You can add LogAlerts directly from any log event or anomaly listed in the Logs page, or from the LogAlert Groups and LogAlerts pages.
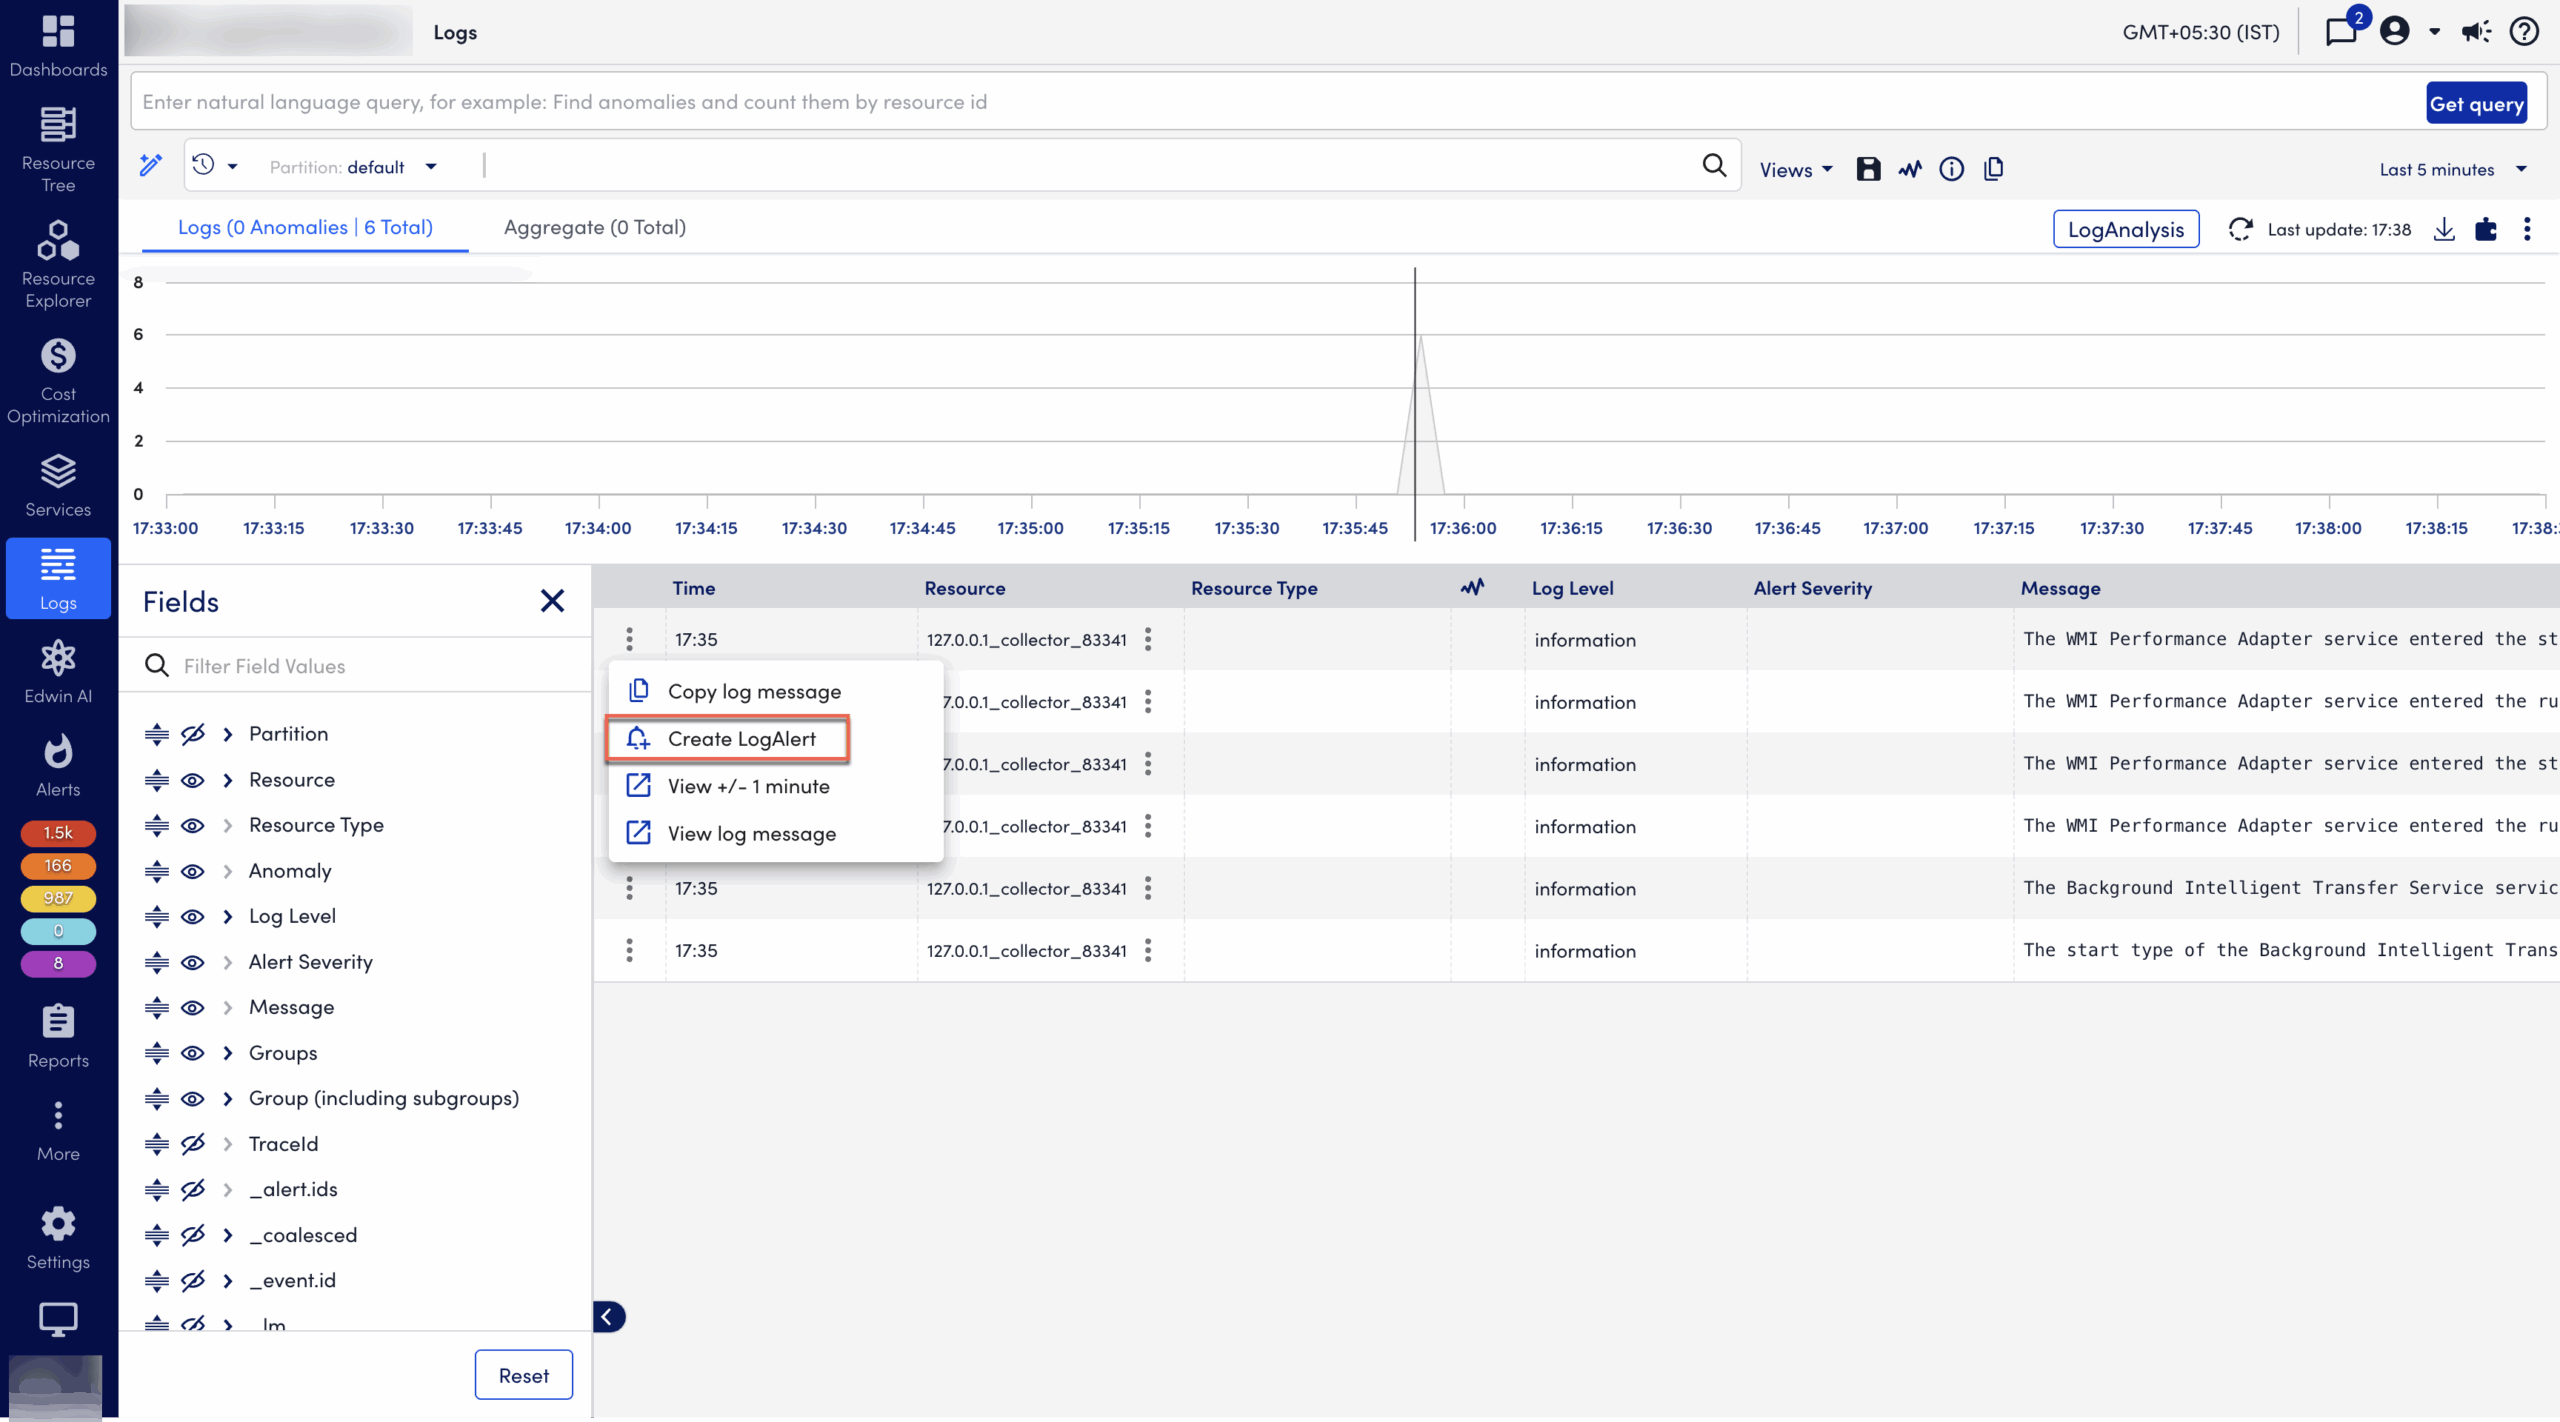
- From a log event or anomaly on the Logs page: Open the action menu at the beginning of the log line and select “Create alert” to open the Add LogAlert dialog.
- From the LogAlert Group page: Select the LogAlerts icon or count to open the LogAlerts page, and select Add LogAlert to add an alert.
Note: You need at least one LogAlert group to be able to add a log alert. For more information, see Log Processing LogAlert Group. Log queries used in LogAlert cannot include aggregate functions, but they can include parse statements and comparison operators such as .
You can add the following LogAlerts:
Adding LogAlert
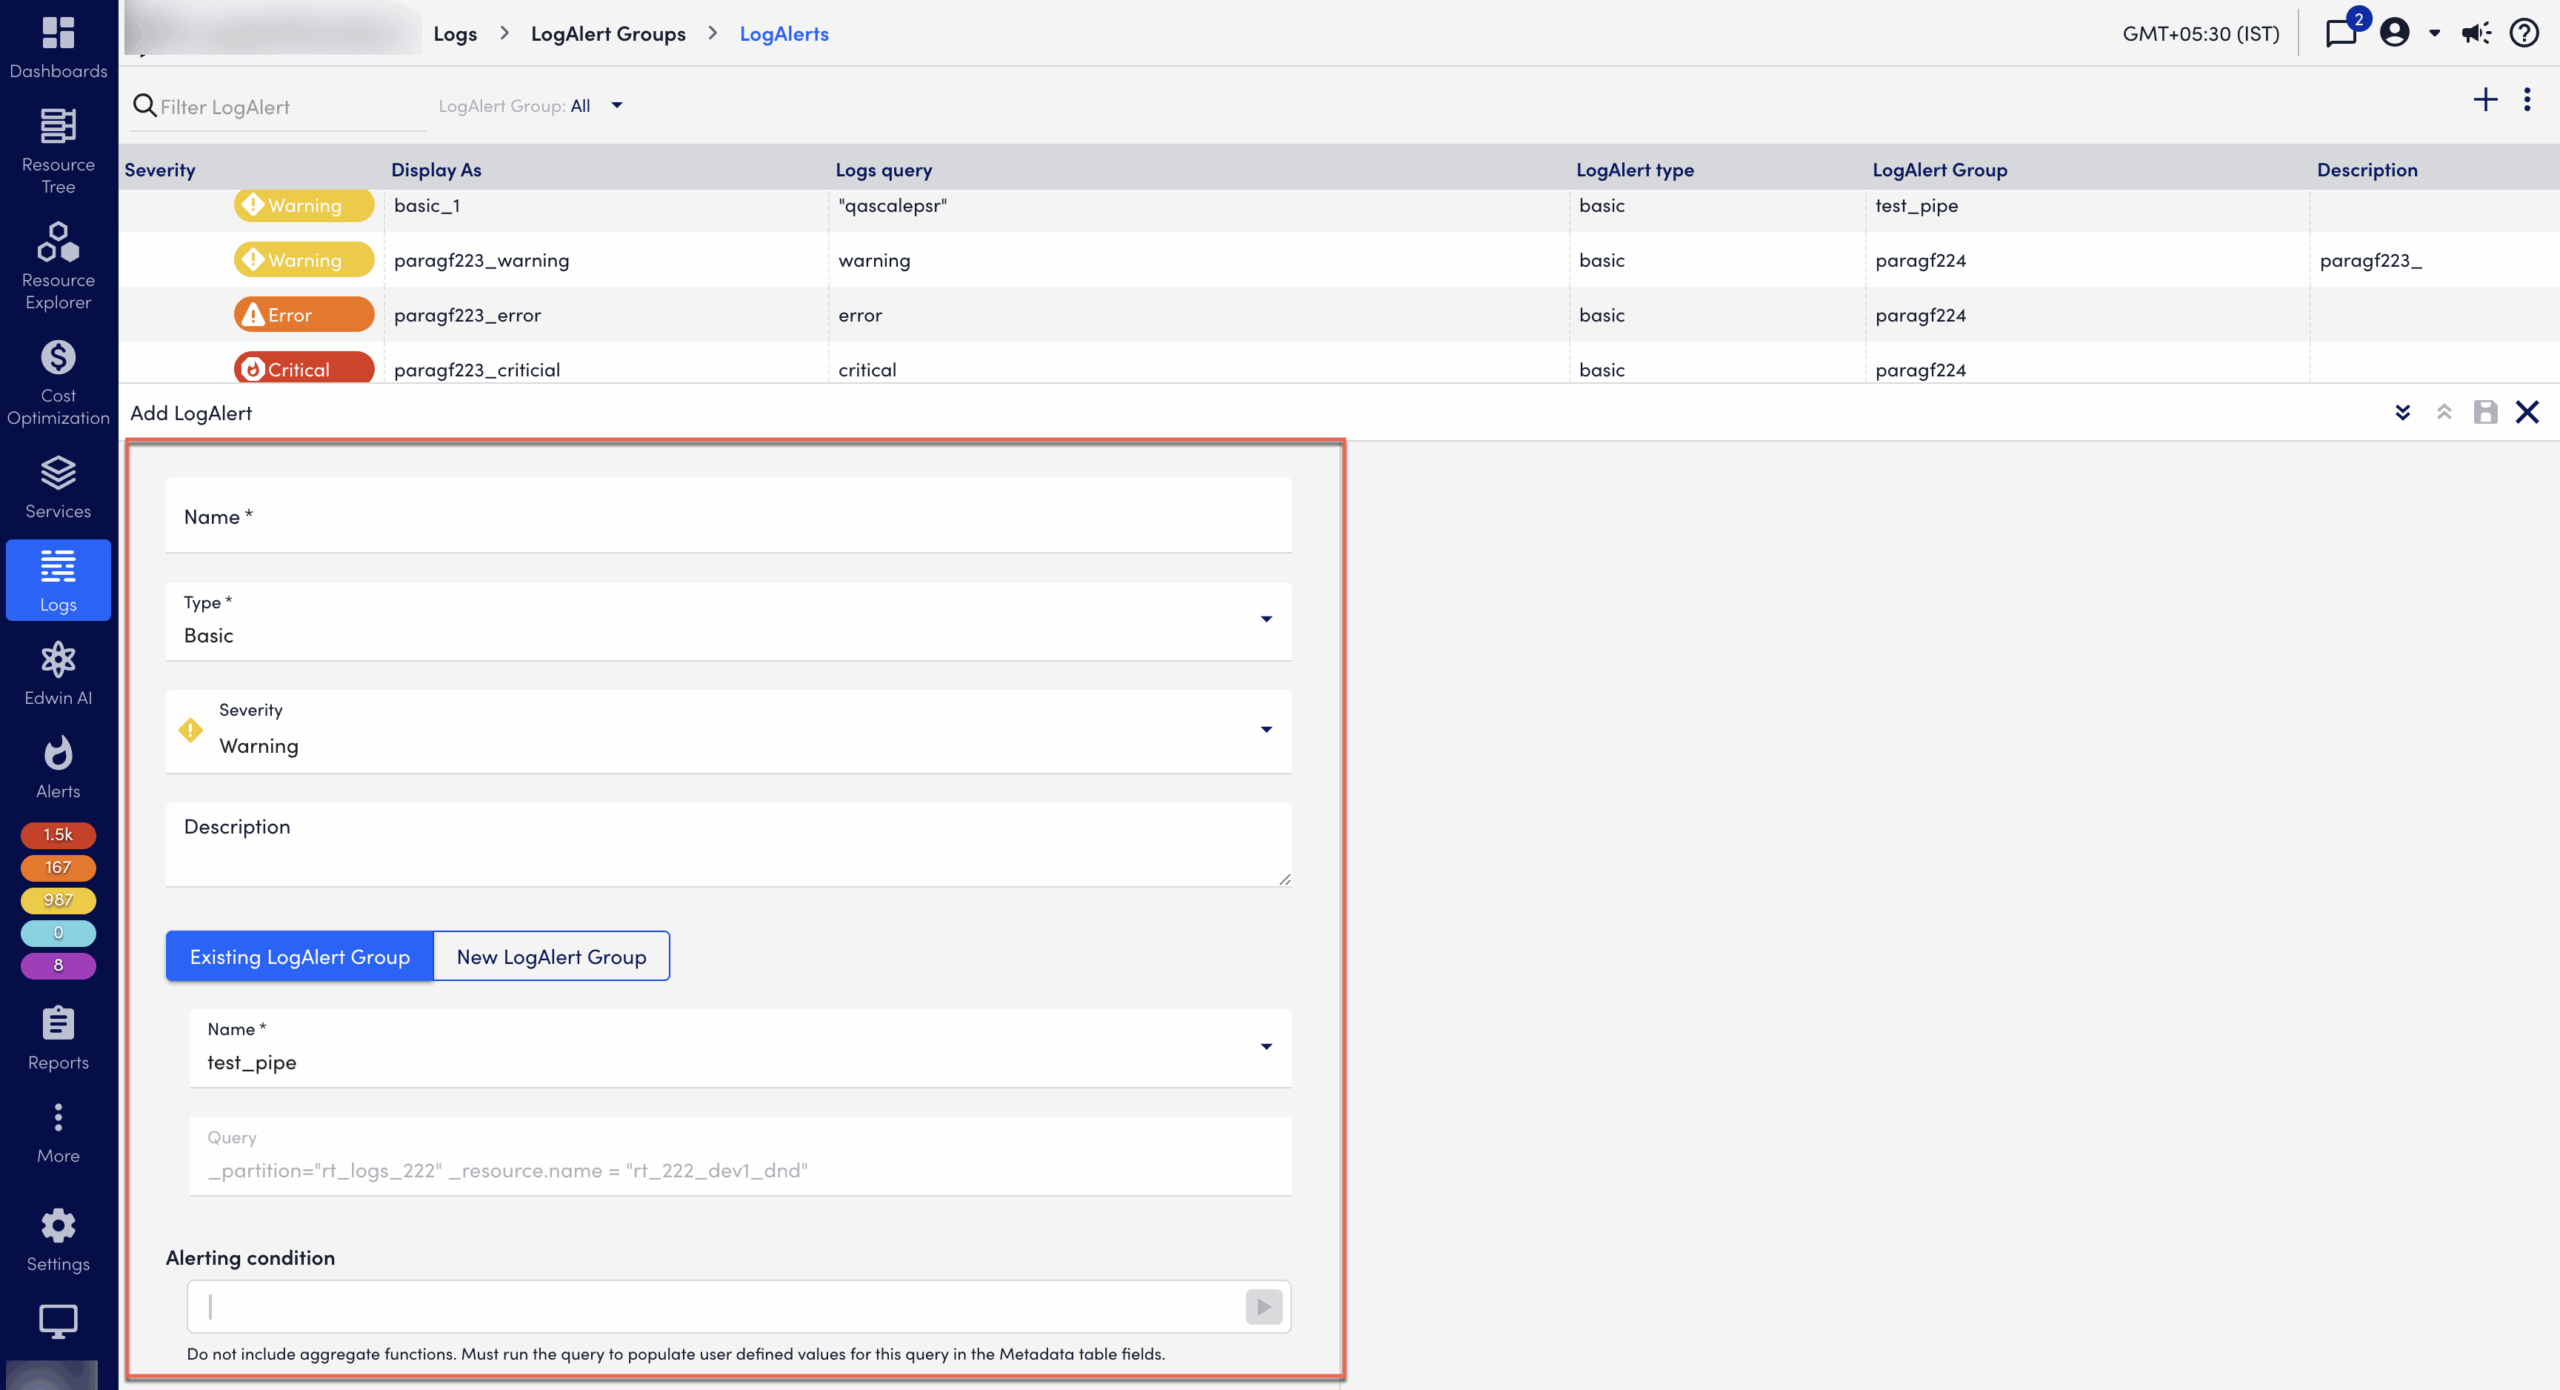
In the Add LogAlert dialog, enter information as follows:
- Select the type of Alert severity level (Critical, Error, Warning) to generate when conditions are met.
- Enter a Display name and a Description to be displayed in the list of LogAlerts.
- Select a LogAlert Group to apply the alert (unless prefilled).
- Unless prefilled, enter a Logs query to filter the events in the LogAlert Group. For more information, see Writing a Filtering Query. Select the arrow to preview the results and refine your query before you save.
- From Trigger alert, to activate a LogAlert, do the following:
- for each matching log – Select this option if you want to generate an alert for each log matching a condition.
- only after matching logs within – Select this option to generate an alert if a certain number of logs match a condition within a defined time period. To generate an alert, there must be at least 1 matching log. You can select the following time intervals: 10 minutes, 30 minutes, 1 hour, 8 hours, and 1 day.
Important: After an alert is generated, to generate the next alert, the time of the first log is considered as the starting point of the time interval and no alert is generated until the time interval is complete. For example, if you select only after 3 matching logs within 10 minutes, the alert is generated after the third log with matching condition is processed within 10 minutes. If there are 6 logs with matching condition within 10 minutes, then the alert for the first set of 3 matching logs is generated. After that, the time of the first log is considered as the starting point of the 10 minutes time interval and no alert is generated until the 10 minutes time interval is complete.
- To define Alert clear conditions, enter the time that the alert will persist. The default is 60 minutes.
- Toggle the Auto-clear after acknowledge switch on to clear the alert after it is acknowledged.
- Toggle the Active switch on to activate the alert.
- In the LogNotes field, enter internal information, links, or instructions to guide incident response (for example, runbooks, escalation steps, or system diagrams).
- Select the Save icon to add the alert.
Note: The Clear after setting will clear alerts after the specified time, even if the Auto-clear after acknowledge toggle is off. Alerts will only be acknowledged if the Auto-clear after acknowledge toggle is on.
When you return to the LogAlert page, you can review the alert you created in the table.
Example
The LogAlert Group Windows Servers (_resource.group.name="Windows") targets a subset of logs related to a “Windows” resource group. The alert triggers on specific keywords or values (eventcode 1100 and application log files). Including the resource group name in the alert query is optional; however, its inclusion does not impact the alert’s functionality.
Acknowledging Alerts
When log alerts are matched, they trigger standard LogicMonitor alert notifications based on the alert settings (Critical, Warning, Error) and will route through the configured escalation chain.
You can also:
- View the log alert in the Logs graph, where it will display as a line alongside the alerting log event.
- Acknowledge or clear the alert in the Alerts list.
Adding a stateful LogAlert
To add a stateful LogAlert, do the following:
- From a log event or anomaly on the Logs page, open the Action menu at the beginning of the log line and select Create LogAlert to open the Add LogAlert dialog.
Alternatively, from the LogAlert Groups page, select the LogAlert icon or LogAlert count to open the LogAlert page, and select the plus sign to add a LogAlert. - In the LogAlert name field, enter a name for the LogAlert.
- From the LogAlert type dropdown list, select Stateful.
- From the Alert severity dropdown, select the type of alert severity level, such as Critical, Error, or Warning, when the conditions are met.
- Enter the description for the alert.
- Select the toggle Existing LogAlert Group or New LogAlert Group to choose an existing LogAlert Group or a new LogAlert Group to create the LogAlert.
Note: If you select an existing LogAlert Group, the name and the query of that LogAlert Group is displayed. If you select New LogAlert Group, you must add the name, description, and logs query for the LogAlert Group.
- Unless prefilled, enter a Logs query to filter the events in the LogAlert Group. For more information, see Writing a Filtering Query.
- Select the arrow to preview the results and refine your query before you save.
- In the Alerting condition field, type a query or select the existing queries by clicking inside the field to add an alerting condition. Use this condition to generate an alert.
Note: For the stateful alert, under Trigger alerts, the for each matching log option is selected by default to generate an alert for each log that matches with the condition. The only after matching logs within option is unavailable for the stateful alert condition type.
- Under Alert condition, to add a condition to clear a LogAlert, do the following:
- Type a query for a Clear condition or select the existing queries from the list. Use this condition to clear an alert.
- For Clear after, enter the time that the alert will persist. The default is 60 minutes. You can choose time in days, hours, and minutes.
- Toggle the Auto-clear after acknowledge switch on to clear the alert after it is acknowledged.
Recommendation: Do not include aggregate functions in the log query. You must run the query by selecting Run Query to populate user-defined values in the Alert grouping criteria and Log metadata fields included in alerts table fields.
- In the Grouping criteria table, to add alert grouping criteria, do the following:
- Select the add icon to add the alerting criteria.
- In the Alert grouping criteria and Clear grouping criteria fields, select or type the alerting and clearing criteria.
- Select Apply.
Note:
- Alert grouping criteria refer to the set of log metadata field names used to group alerts based on their corresponding field values. Each unique combination of these values results in a single alert instance. Subsequent alerts that match the same criteria same criteria are deduplicated to reduce alert fatigue and minimize noise.
- Resource is a default alert grouping criteria.
- The actual values of alert grouping criteria fields must match for exact correlation between log events.
- You can add maximum of 2 alert grouping criteria.
- Toggle the Active switch on to activate the alert.
- Under the Log metadata fields included in alert section, do the following to add metadata in the alert information.
- Select Add Record ➕ to add a new field.
- In the Logs fields, search for or enter the name of the metadata field, and select Apply.
- To delete a field, select Delete in the Actions column for the corresponding field.
- In the LogNotes field, enter internal information, links, or instructions to guide incident response (for example, runbooks, escalation steps, or system diagrams).
Note: You can add up to 10 log metadata field names. Corresponding field values are extracted directly from the triggering log event and appended to the alert information. The selected log metadata fields and their values display in the Log Metadata column on the Alerts page and in the alert details panel of both the Alerts and Logs pages. All extracted field values are automatically converted into a JSON-formatted string before being added to the alert details.
- Select the Save icon to add the LogAlert.
